Google Earth Engine——美国PRISM插值程序模拟了天气和气候如何随海拔变化,并考虑了海岸效应、温度反转和可能导致雨影的地形障碍。
Google Earth Engine——美国PRISM插值程序模拟了天气和气候如何随海拔变化,并考虑了海岸效应、温度反转和可能导致雨影的地形障碍。

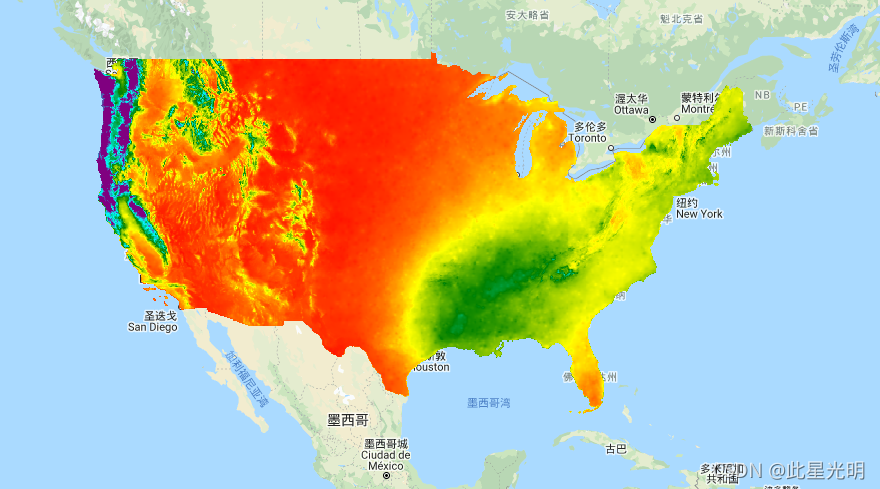
The PRISM daily and monthly datasets are gridded climate datasets for the conterminous United States, produced by the PRISM Climate Group at Oregon State University. Grids are developed using PRISM (Parameter-elevation Regressions on Independent Slopes Model). PRISM interpolation routines simulate how weather and climate vary with elevation, and account for coastal effects, temperature inversions, and terrain barriers that can cause rain shadows. Station data are assimilated from many networks across the country. For more information, see the Descriptions of PRISM Spatial Climate Datasets.
PRISM日数据集和月数据集是美国本土的网格化气候数据集,由俄勒冈州立大学的PRISM气候小组制作。网格是使用PRISM(独立坡度模型的参数-海拔回归)开发的。PRISM插值程序模拟了天气和气候如何随海拔变化,并考虑了海岸效应、温度反转和可能导致雨影的地形障碍。站点数据来自全国各地的许多网络。欲了解更多信息,请参见PRISM空间气候数据集的描述。
Dataset Availability
1981-01-01T00:00:00 - 2010-12-31T00:00:00
Dataset Provider
Collection Snippet
ee.ImageCollection("OREGONSTATE/PRISM/Norm81m")
Resolution
4638.3 meters
Bands Table
Name | Description | Min* | Max* | Units |
|---|---|---|---|---|
ppt | 30 Year average of monthly total precipitation (including rain and melted snow) | 0.03 | 1046.09 | mm |
tmean | 30 Year average of monthly mean temperature (calculated as (tmin+tmax)/2) | -16.15 | 37.88 | °C |
tmin | 30 Year average of monthly minimum temperature | -21.9 | 29.79 | °C |
tmax | 30 Year average of monthly maximum temperature | -10.78 | 46.63 | °C |
tdmean | 30 Year average of monthly mean dew point temperature | -19.07 | 25.22 | °C |
vpdmin | 30 Year average of monthly minimum vapor pressure deficit | 0 | 33.11 | hPa |
vpdmax | 30 Year average of monthly maximum vapor pressure deficit | 0.37 | 94.11 | hPa |
* = Values are estimated
Name | Type | Description |
|---|---|---|
PRISM_CREATION_DATE | List of Strings | List of original creation dates for each band, e.g: the first element is for the first band "ppt", the second element is for the second band "tmean" |
PRISM_DATASET | List of Strings | List of dataset types per-band |
PRISM_VERSION | List of Strings | List of code versions per-band |
PRISM_FILENAME | List of Strings | List of original filenames per-band |
[Daly, C., J.I. Smith, and K.V. Olson. 2015. Mapping atmospheric moisture climatologies across the conterminous United States. PloS ONE 10(10):e0141140. doi:10.1371/journal.pone.0141140.
代码:
var dataset = ee.ImageCollection('OREGONSTATE/PRISM/Norm81m');
var precipitation = dataset.select('ppt');
var precipitationVis = {
  min: 0.0,
  max: 300.0,
  palette: ['red', 'yellow', 'green', 'cyan', 'purple'],
};
Map.setCenter(-100.55, 40.71, 0);
Map.addLayer(precipitation, precipitationVis, 'Precipitation');