GEE 案例——如何计算sentinel-2中每一个单景影像的波段的DN值并绘制直方图
GEE 案例——如何计算sentinel-2中每一个单景影像的波段的DN值并绘制直方图

原始问题
我正试图在 Google 地球引擎中为整个图像集合计算一个直方图。为了达到我想要的结果,我现在所做的是计算每个单独图像的直方图直方图1 并将它们相加,不知道是否正确。
简介
直方图基本上是一个配对值列表。因此,您可以用函数映射它,而无需 for/ 循环。以下代码片段包含了为整个图像集生成直方图的算法的重要部分。
函数
ee.Reducer.fixedHistogram(min, max, steps, cumulative)
Creates a reducer that will compute a histogram of the inputs using a fixed number of fixed width bins. Values outside of the [min, max) range are ignored. The output is a Nx2 array of bucket lower edges and counts (or cumulative counts) and is suitable for use per-pixel.
创建一个聚类器,使用固定数量、固定宽度的分隔来计算输入的直方图。超出 [min, max] 范围的值将被忽略。输出是一个 Nx2 数组,包含桶下边缘和计数(或累计计数),适合按像素使用。
Arguments:
min (Float):
The lower (inclusive) bound of the first bucket.
max (Float):
The upper (exclusive) bound of the last bucket.
steps (Integer):
The number of buckets to use.
cumulative (Boolean, default: false):
When true, generates a cumulative histogram.
Returns: Reducer
ui.Chart.image.histogram(image, region, scale, maxBuckets, minBucketWidth, maxRaw, maxPixels)
Generates a Chart from an image. Computes and plots histograms of the values of the bands in the specified region of the image.
- X-axis: Histogram buckets (of band value).
- Y-axis: Frequency (number of pixels with a band value in the bucket).
根据图像生成图表。计算并绘制图像指定区域内色带值的直方图。
X 轴 直方图桶(带值)。
Y 轴 频率(带值在桶中的像素数量)。
Returns a chart.
Arguments:
image (Image):
The image to generate a histogram from.
region (Feature|FeatureCollection|Geometry, optional):
The region to reduce. If omitted, uses the entire image.
scale (Number, optional):
The pixel scale used when applying the histogram reducer, in meters.
maxBuckets (Number, optional):
The maximum number of buckets to use when building a histogram; will be rounded up to a power of 2.
minBucketWidth (Number, optional):
The minimum histogram bucket width, or null to allow any power of 2.
maxRaw (Number, optional):
The number of values to accumulate before building the initial histogram.
maxPixels (Number, optional):
If specified, overrides the maximum number of pixels allowed in the histogram reduction. Defaults to 1e6.
Returns: ui.Chart
ui.Chart.array.values(array, axis, xLabels)
Generates a Chart from an array. Plots separate series for each 1-D vector along the given axis.
- X-axis = Array index along axis, optionally labeled by xLabels.
- Y-axis = Value.
- Series = Vector, described by indices of the non-axis array axes.
从数组生成图表。沿着给定的坐标轴为每个一维向量绘制单独的序列。
X-axis = 沿轴的数组索引,可选择用 xLabels 标注。
Y 轴 = 数值。
系列 = 矢量,由非轴数组轴的索引描述。
Returns a chart.
Arguments:
array (Array|List<Object>):
Array to chart.
axis (Number):
The axis along which to generate the 1-D vector series.
xLabels (Array|List<Object>, optional):
Labels for ticks along the x-axis of the chart.
Returns: ui.Chart
代码:
// FUNCTIONS//
function normalize(image, minValue, maxValue){
var image1 = image.subtract(minValue);
var diff = maxValue.subtract(minValue);
var image2 = image1.divide(diff);
return image2.copyProperties(image, ["system:time_start"]);
}
// CODE //
// Dataset selection
var s2 = ee.ImageCollection('COPERNICUS/S2').filterMetadata('MGRS_TILE', 'equals', '32UPU');
var start = ee.Date('2021-11-01');
var end = ee.Date('2022-01-01');
var s2 = s2.filterDate(start, end);
print("s2", s2);
// Normalizing image collection images with overall minimum and maximum - here only for Band 2
var band = 'B2';
var colIm = s2.select(band);
var minImage=colIm.min();
var maxImage=colIm.max();
var maxValue = ee.Number(maxImage.reduceRegion({
reducer: ee.Reducer.max(),
geometry: s2.geometry(),
maxPixels:10e10,
scale: 100
}).get(band));
var minValue = ee.Number(minImage.reduceRegion({
reducer : ee.Reducer.min(),
geometry : s2.geometry(),
maxPixels : 10e10,
scale : 100
}).get(band));
var s2_norm = colIm.map(function(img){return normalize(img, minValue, maxValue)});
print("s2_norm", s2_norm);
Map.centerObject(s2_norm);
// Histogram for single Image
var image = s2_norm.first();
var histogram_single = image.reduceRegion({
reducer : ee.Reducer.fixedHistogram(0,1,256),
geometry : s2_norm.geometry(),
maxPixels : 10e9
}).get(band);
print('Histogram for Single Image', histogram_single);
var values = ee.Array(histogram_single).toList().map(function (ele) {
return ee.List(ele).get(0);
});
//print("values", values);
var counts = ee.Array(histogram_single).toList().map(function (ele) {
return ee.List(ele).get(1);
});
//print("counts", counts);
// Create Histogram over all Images
var histo = s2_norm.reduce(ee.Reducer.fixedHistogram ({min:0, max: 1, steps: 256, cumulative: true}));
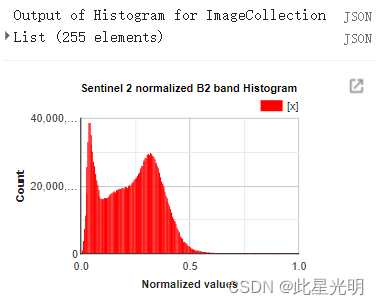
print('Output of Histogram for ImageCollection',histo.select('B2_histogram'));
Map.addLayer(s2_norm.geometry(), {}, 's2_norm');
//Map.addLayer(histo);
print("scale", image.projection().nominalScale());
// Define the chart and print it to the console.
var chart =
ui.Chart.image.histogram({image: image, region: s2_norm.geometry(), scale: 35})
.setOptions({
title: 'Sentinel 2 normalized B2 band Histogram',
hAxis: {
title: 'Normalized values',
titleTextStyle: {italic: false, bold: true},
viewWindow: {min: 0, max: 1}
},
vAxis:
{title: 'Count', titleTextStyle: {italic: false, bold: true}},
colors: ['blue']
});
print(chart);
var chart2 = ui.Chart.array.values({array: counts, axis: 0, xLabels: values})
.setOptions({
title: 'Sentinel 2 normalized B2 band Histogram',
colors: ['red'],
hAxis: {
'title': 'Normalized values',
titleTextStyle: {italic: false, bold: true}
},
vAxis:
{title: 'Count', titleTextStyle: {italic: false, bold: true}},
}).setChartType('ColumnChart');
print(chart2);
var s2_norm_lst = s2_norm.toList(s2_norm.size());
var allValues = s2_norm_lst.map(function (ele) {
var histogram = ee.Image(ele).reduceRegion({
reducer: ee.Reducer.fixedHistogram(0,1,255),
geometry: s2_norm.geometry(),
maxPixels: 10e9}
).get(band);
return ee.List(ee.Array(histogram).toList());
});
allValues = ee.List(allValues).flatten();
var len = allValues.size();
var list = ee.List.sequence(0, len.subtract(1), 2);
var tot_list = list.map(function(ele){
var start = ee.Number(ele).int();
var end = ee.Number(ele).add(2).int();
var new_list = ee.List([]);
var element = ee.List(allValues.slice(start, end));
new_list = new_list.add(element);
return new_list.get(0);
});
//print(tot_list);
var allValues = tot_list.map(function (ele) {
return ee.List(ele).get(0);
});
var allCounts = tot_list.map(function (ele) {
return ee.List(ele).get(1);
});
var chart3 = ui.Chart.array.values({array: allCounts, axis: 0, xLabels: allValues})
.setOptions({
title: 'Sentinel 2 normalized B2 band Histogram',
colors: ['red'],
hAxis: {
'title': 'Normalized values',
titleTextStyle: {italic: false, bold: true}
},
vAxis:
{title: 'Count', titleTextStyle: {italic: false, bold: true}},
}).setChartType('ColumnChart');
print(chart3);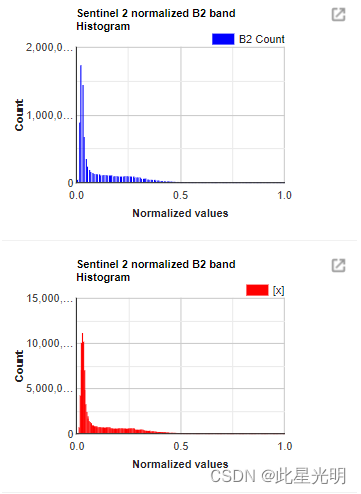
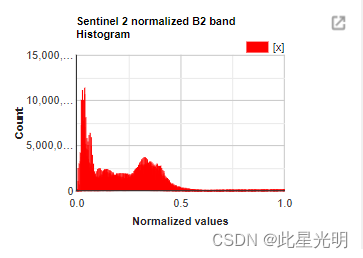
第一张图表(蓝色)是使用集合中第一张图像的 ui.Chart.image.histogram 获得的(您的 histo 图像对于获得整个集合的直方图没有用处,也无法添加到地图画布中)。只能在比例尺大于 35 米时使用(但是,B2 波段的比例尺为 10 米)。第二和第三个图表(红色)分别显示第一幅图像和整个图像集。
代码2
// FUNCTIONS//
function normalize(image, minValue, maxValue){
    var image1 = image.subtract(minValue);
    var diff = maxValue.subtract(minValue);
    var image2 =  image1.divide(diff);
    return image2.copyProperties(image, ["system:time_start"]);
}

// CODE //

// Dataset selection
var s2 = ee.ImageCollection('COPERNICUS/S2').filterMetadata('MGRS_TILE', 'equals', '32UPU');
var start = ee.Date('2021-11-01');
var end = ee.Date('2022-01-01');
var s2 = s2.filterDate(start, end);
print(s2);

// Normalizing image collection images with overall minimum and maximum - here only for Band 2
var band = 'B2';
var colIm = s2.select(band);
var minImage=colIm.min();
var maxImage=colIm.max();
var maxValue = ee.Number(maxImage.reduceRegion({
  reducer: ee.Reducer.max(),
  geometry: s2.geometry(),
  maxPixels:10e10,
  scale: 100
  }).get(band));
var minValue = ee.Number(minImage.reduceRegion({
  reducer : ee.Reducer.min(),
  geometry : s2.geometry(),
  maxPixels : 10e10,
  scale : 100
  }).get(band));

var s2_norm = colIm.map(function(img){return normalize(img, minValue, maxValue)});

// Histogram for single Image
var image = s2_norm.first();
var histogram_single = image.reduceRegion({
      reducer : ee.Reducer.fixedHistogram(0,1,255),
      geometry : s2_norm.geometry(),
      maxPixels : 10e9
      }).get(band);
print('Histogram for Single Image', histogram_single);

// Create Histogram over all Images
var s2_norm_lst = s2_norm.toList(s2_norm.size());

var allValues = s2_norm_lst.map(function (ele) {
  var histogram = ee.Image(ele).reduceRegion({
        reducer: ee.Reducer.fixedHistogram(0,1,255),
        geometry: s2_norm.geometry(),
        maxPixels: 10e9}
      ).get(band);
  return ee.List(ee.Array(histogram).toList());
});


allValues = ee.List(allValues).flatten();

var histo = ee.List([]);
for (var i=0;i<255;i++){
  var slice = ee.List(allValues.slice(i*2+1, ee.Number(allValues.size()),510));
  var element = ee.Number(slice.reduce(ee.Reducer.sum()));
  var bin = ee.List(allValues.slice(i*2, ee.Number(allValues.size()),510));
  var element2 = ee.Number(bin.reduce(ee.Reducer.mean()));
  var histo = histo.add([element2,element]);
}

print('Output of Histogram for ImageCollection', histo);

var allValues = histo.map(function (ele) {

  return ee.List(ele).get(0);

});

var allCounts = histo.map(function (ele) {

  return ee.List(ele).get(1);

});

var chart3 = ui.Chart.array.values({array: allCounts, axis: 0, xLabels: allValues})
                .setOptions({
                  title: 'Sentinel 2 normalized B2 band Histogram',
                  colors: ['red'],
                  hAxis: {
                    'title': 'Normalized values',
                    titleTextStyle: {italic: false, bold: true}
                  },
                  vAxis:
                    {title: 'Count', titleTextStyle: {italic: false, bold: true}},

                }).setChartType('ColumnChart');

print(chart3);