Geovista | 3D地图数据还可以这样玩?!赶紧学...
Geovista | 3D地图数据还可以这样玩?!赶紧学...

DataCharm
发布于 2024-03-07 12:25:13
发布于 2024-03-07 12:25:13
前言
我们的数据可视化课程已经上线啦!!目前课程的主要方向是 科研、统计、地理相关的学术性图形绘制方法,后续也会增加商务插图、机器学等、数据分析等方面的课程。课程免费新增,这点绝对良心!
我们第一个数据可视化交流圈子也已经上线了,主要以我的第一本书籍《科研论文配图绘制指南-基于Python》为基础进行拓展,提供「课堂式」教学视频,还有更多拓展内容,可视化技巧远超书籍本身,书籍修正和新增都会分享到圈子里面~~
参与课程或者圈子的你将获取到:学员答疑、可视化资源分享、可视化技巧补充、可视化业务代做(学员和甲方对接)、副业交流、提升认知等等。
「Geovista」-地图网格渲染王炸工具~~
在给大家准备我们子新增的Python地理可视化课程时,真的很容易就发现好用的可视化工具,这部,又发现了一个-「Geovista」,GeoVista 的目标很简单,就是为 PyVista 提供便捷的制图功能。
- Geovista介绍
Geovista库就是实现由PyVista支持的制图渲染和网格分析功能,其集成了大量绘图功能,提供了专门用于绘制地图功能的PyVista模块。
简单地说,GeoVista和PyVista的关系,就如同Cartopy和Matplotlib之间的关系。
- Geovista安装
由于事专门正对地理数据的,这边建议单独构建一个新的虚拟环境,然后再使用以下语句进行安装:
conda install -c conda-forge geovista
不建议使用pip安装。
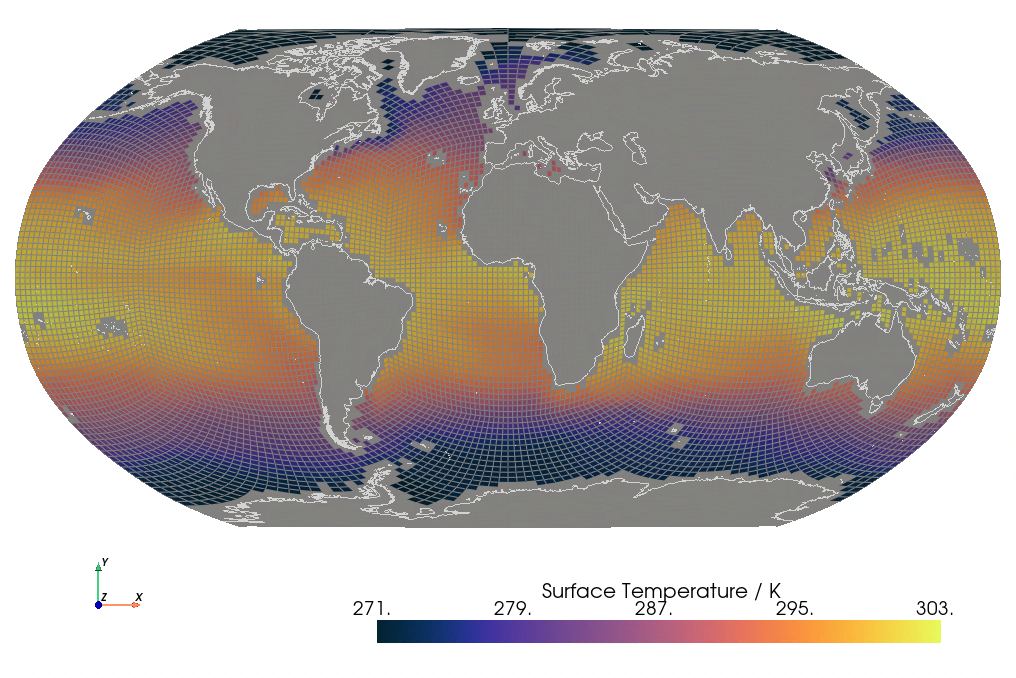
- Geovista可视化案例
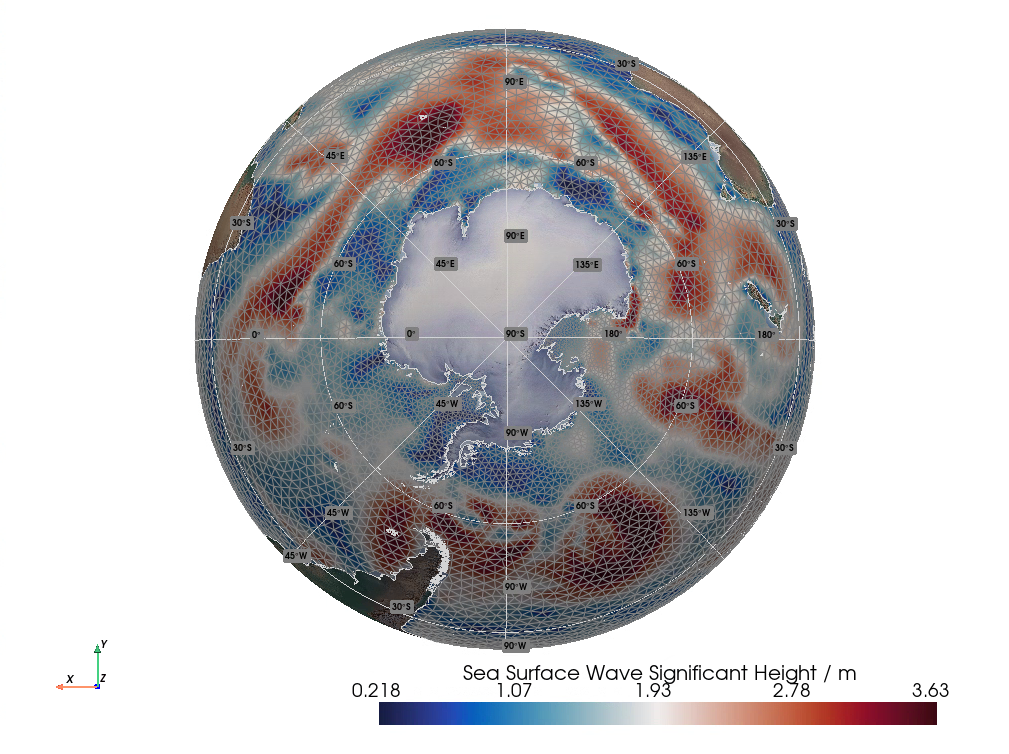
import geovista as gv
from geovista.pantry.data import ww3_global_tri
import geovista.theme

# Load the sample data.
sample = ww3_global_tri()

# Create the mesh from the sample data.
mesh = gv.Transform.from_unstructured(
    sample.lons, sample.lats, connectivity=sample.connectivity, data=sample.data
)

# Plot the mesh.
plotter = gv.GeoPlotter()
sargs = {"title": f"{sample.name} / {sample.units}"}
plotter.add_mesh(mesh, show_edges=True, scalar_bar_args=sargs)
plotter.add_base_layer(texture=gv.natural_earth_hypsometric())
plotter.add_coastlines(resolution="10m")
plotter.add_graticule()
plotter.view_xy(negative=True)
plotter.add_axes()
plotter.show()
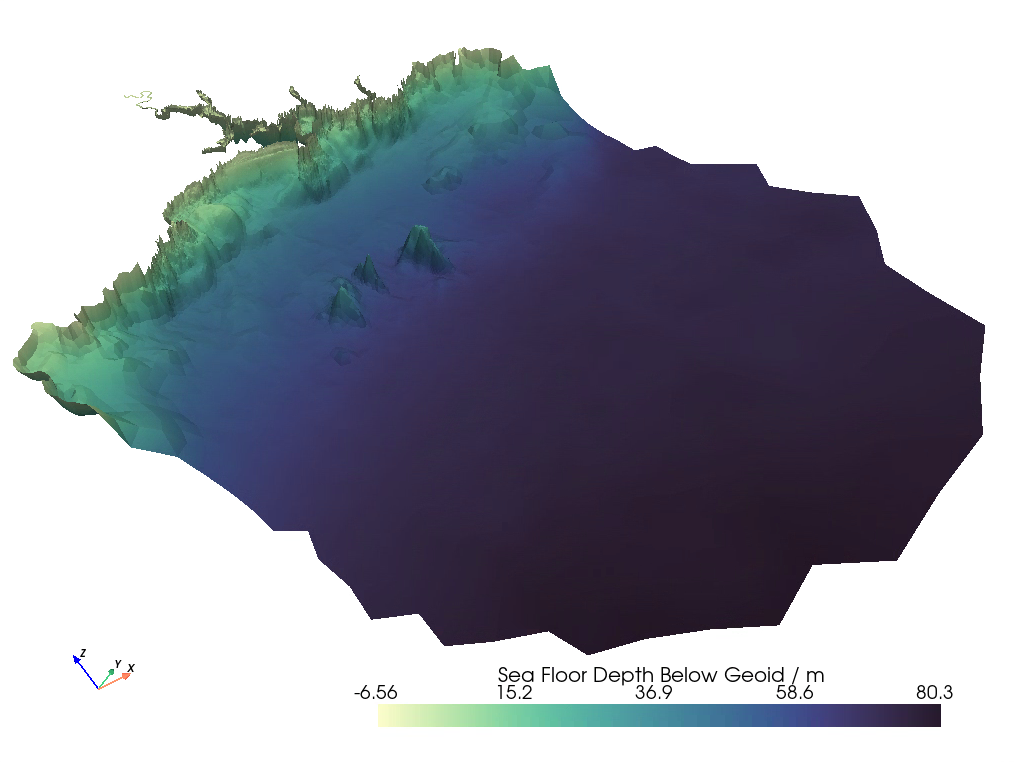
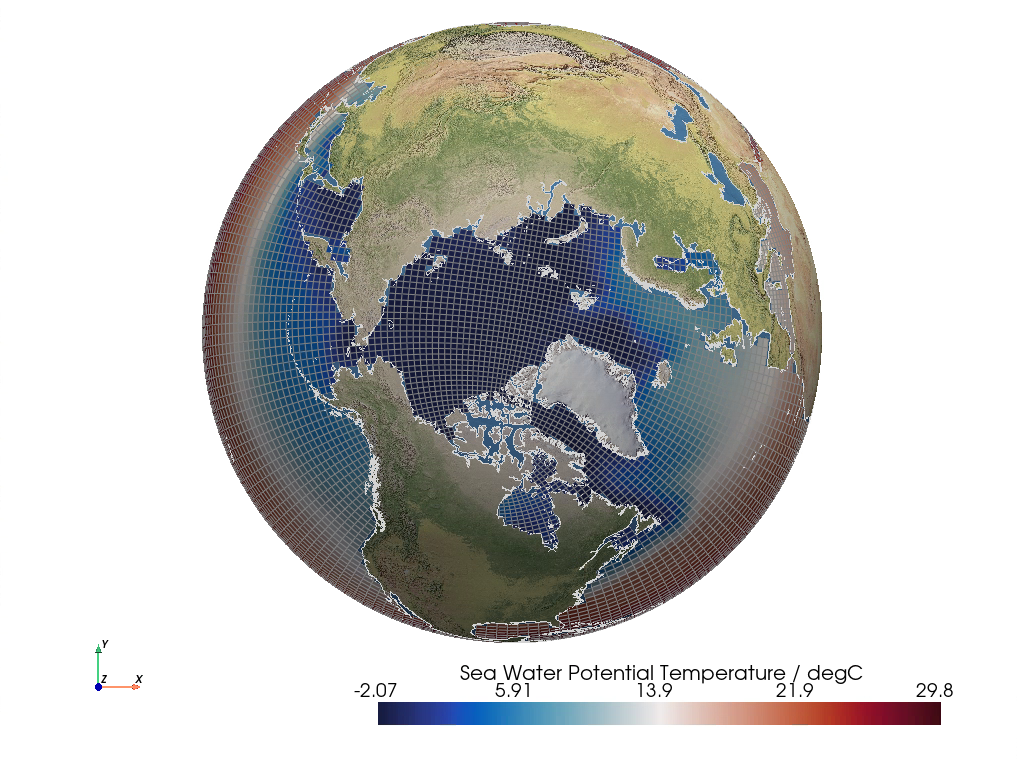
import geovista as gv
from geovista.pantry.data import fvcom_tamar
import geovista.theme

# Load the sample data.
sample = fvcom_tamar()

# Create the mesh from the sample data.
mesh = gv.Transform.from_unstructured(
    sample.lons,
    sample.lats,
    connectivity=sample.connectivity,
    data=sample.face,
    name="face",
)

# Warp the mesh nodes by the bathymetry.
mesh.point_data["node"] = sample.node
mesh.compute_normals(cell_normals=False, point_normals=True, inplace=True)
mesh.warp_by_scalar(scalars="node", inplace=True, factor=2e-5)

# Plot the mesh.
plotter = gv.GeoPlotter()
sargs = {"title": f"{sample.name} / {sample.units}"}
plotter.add_mesh(mesh, cmap="deep", scalar_bar_args=sargs)
plotter.add_axes()
plotter.show()
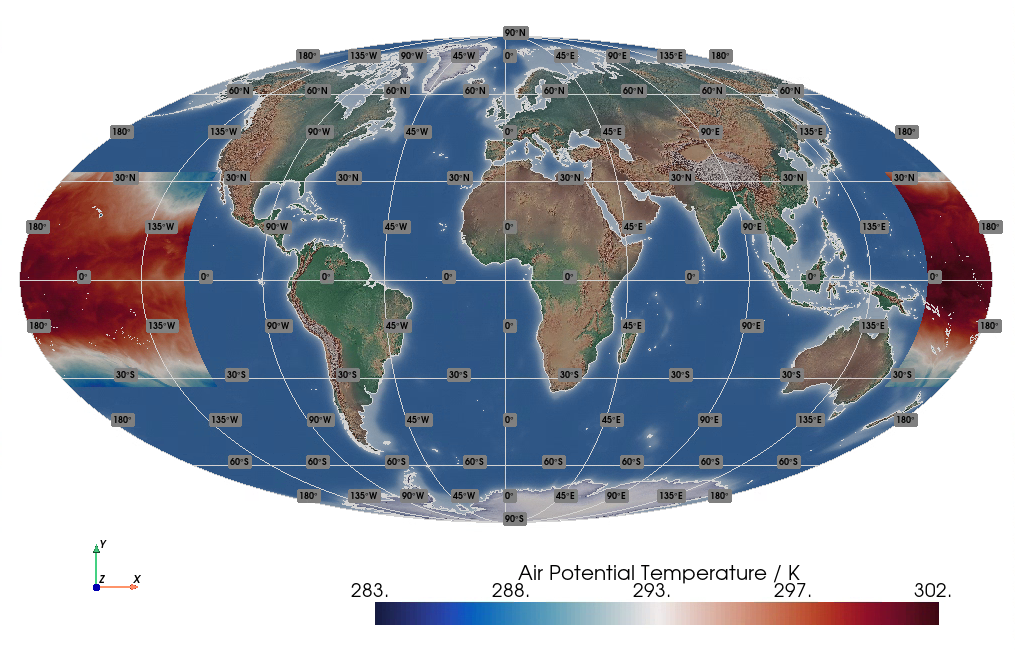
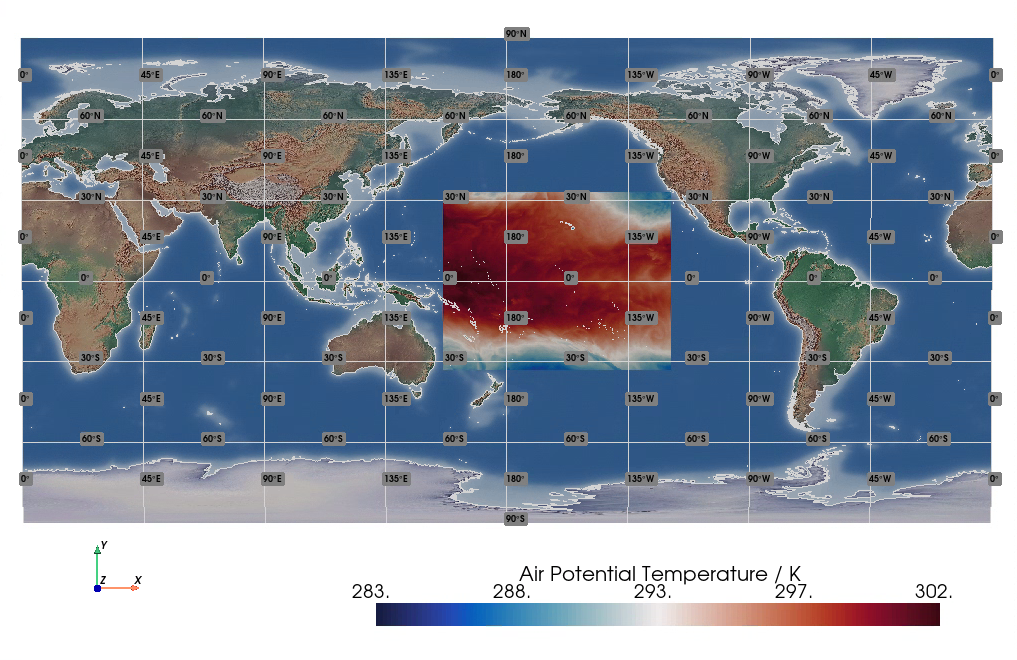
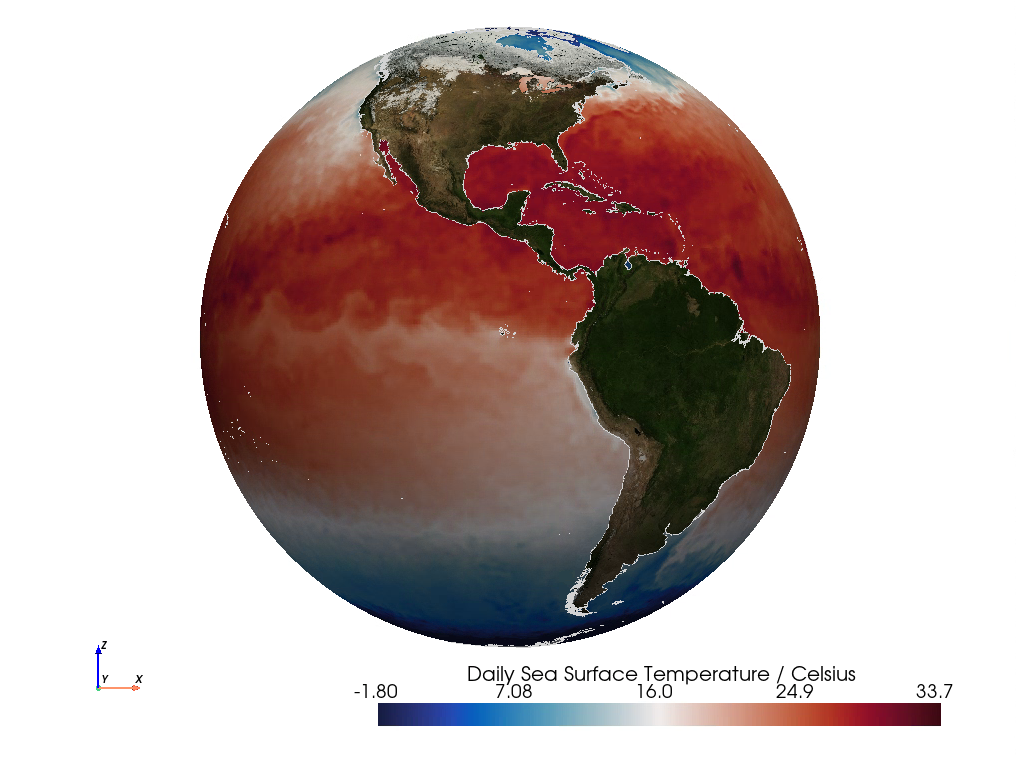
其他可视化案例:
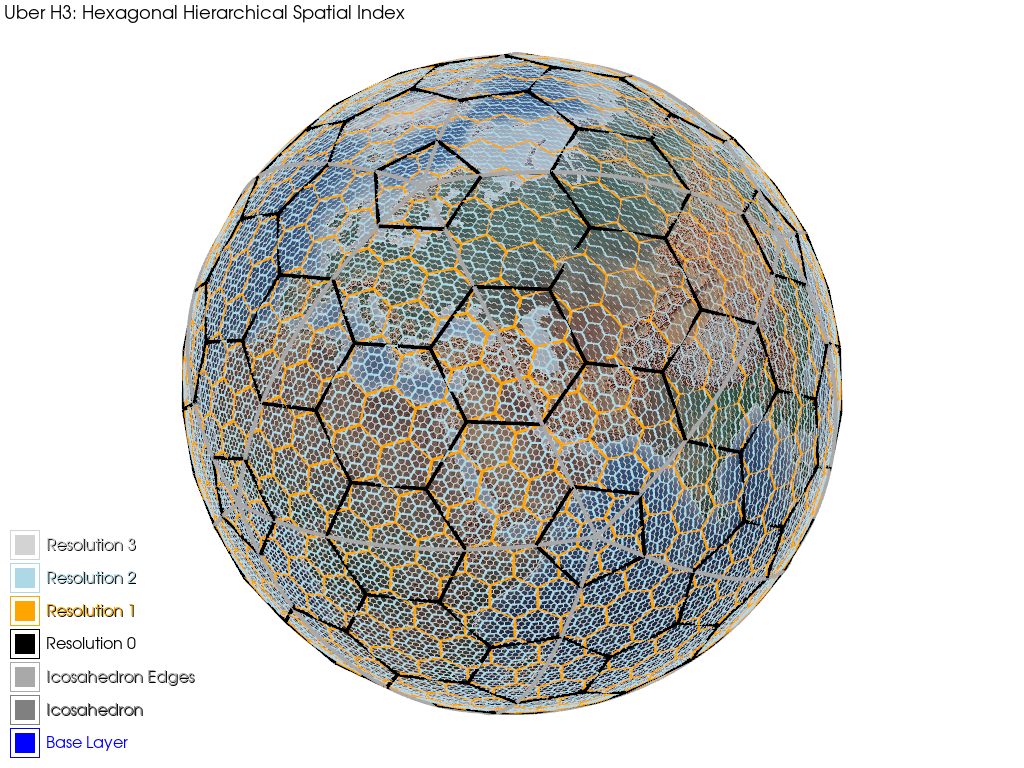
更多关于Geovista的使用语法和可视化案例,可参考:Geovista库官网[1]
参考资料
[1]
Geovista库官网: https://geovista.readthedocs.io/en/latest/index.html。
本文参与 腾讯云自媒体分享计划,分享自微信公众号。
原始发表:2024-03-07,如有侵权请联系 cloudcommunity@tencent.com 删除
评论
登录后参与评论
推荐阅读
目录