GEE代码条带问题——sentinel-1接缝处理的问题
GEE代码条带问题——sentinel-1接缝处理的问题

问题
我有兴趣确定 NDVI 损失最大的年份。我创建了一个函数来收集所有陆地卫星图像并应用预处理。当我导出结果以识别 NDVI 损失最大年份时,生成的数据产品与陆地卫星场景足迹有可怕的接缝线。造成这种情况的原因是什么以及如何调整代码?
sentinel1数据影像拼接产生的条带问题的主要原因有以下几点:
1. 数据采集模式:sentinel1卫星采用合成孔径雷达(SAR)技术进行数据采集,其数据采集模式包括Stripmap、Interferometric Wide Swath(IW)和Extra Wide Swath(EW)等,这些不同的模式下数据的采集方式和分辨率不同,可能导致拼接后出现条带问题。
2. 不同轨道数据拼接:sentinel1卫星的数据采集是通过不同的轨道进行的,不同轨道之间可能存在位置偏差和分辨率差异,当将这些数据拼接在一起时,由于数据之间的差异会导致条带问题的出现。
3. 数据预处理:在数据拼接之前,需要进行预处理操作,如辐射校正、大气校正、地形校正等,但不同数据之间预处理时所采用的方法和参数可能不同,这也会导致拼接后的数据出现条带问题。
4. 大气湿度和地形的影响:sentinel1卫星的雷达信号受大气湿度和地形的影响较大,不同区域和不同时间的大气湿度和地形情况可能存在差异,当将这些数据拼接在一起时,可能会导致条带问题的出现。
综上所述,sentinel1数据影像拼接产生的条带问题的主要原因包括数据采集模式、不同轨道数据拼接、数据预处理和大气湿度、地形等因素的影响。
代码:
var countries = ee.FeatureCollection("USDOS/LSIB_SIMPLE/2017"),
    studyArea = ee.FeatureCollection("projects/mangrovescience/SDG_Ghana/Gold_Mining/StudyAreaSubset"),
    minesYear = ee.Image("projects/mangrovescience/SDG_Ghana/Gold_Mining/Ghana_MinesRF_30m_MaxYear3YrAvg2019Full");
//=====================================================================================================================
//                                        MIT - NASA - University of Maryland (ESSIC)
// Remote Sensing of Land Cover and Ecosystems: Country-level Ecosystem Extent and Change Mapping in Sub-Saharan Africa
//
// Project: Small-scale Gold Mining in Ghana
// Code: Ghana NDVI Anomaly Timeline
// Written by: Amanda Payton, NASA Goddard
// Edited by: Abigail Barenblitt NASA Goddard and University of Maryland
// Co-authors: Daniel Wood, MIT; Lola Fatoyinbo, NASA Goddard; David Lagomasino, East Carolina University
// Objective: This code identifies the year of highest NDVI decrease per pixel,
//            creates an image to display the year, exports the image, and calculates the area per year.

//=====================================================================================================================


//=======================================================================================
//STEP 1: Create a collection of Landsat Images
//=======================================================================================

//import the random forest classification of mines from script one
var rf_classification = ee.Image('projects/ee-pbaltezar91/assets/GHA2023_ASSETS/5_Ghana_classRF_30m2VarSplit_30Trees2010-01-01_2023-12-30')
var maxYrDeriv = ee.Image('projects/ee-pbaltezar91/assets/GHA2023_ASSETS/7_GHA_MinesRF_30m_Max3YrAvg_2000_2023')
Map.addLayer(maxYrDeriv)
Map.addLayer(rf_classification)

//=======================================================================================
//STEP 1: Create a collection of Landsat Images
//=======================================================================================
//This will assemble Landsat imagery from 2002-2023 and harmonize imagery from
//Landsat 5,7, & 8

//Define region of interest
//--------------------------
//var assetId = 'projects/ee-pbaltezar91/assets/GHA2023_ASSETS/'//Edit to your local folder
var region = ee.FeatureCollection("USDOS/LSIB_SIMPLE/2017").filterMetadata("country_na","equals","Ghana"); //country border of Ghana
var countryCode = 'GHA'
var bounds = region.geometry().bounds()
Map.addLayer(bounds,null, 'Study Area Bounds')
Map.centerObject(bounds,10)
// Define years and dates to include in landsat image collection
//---------------------------------------------------------------
var startYear = 2002;         //what year do you want to start the time series
var endYear   = 2023;         //what year do you want to end the time series
var startJulian  = 0;      //what is the beginning of date filter | DOY
var endJulian    = 153;      //what is the end of date filter | DOY

var crs = 'EPSG:4326'//WGS 84 UTM zone 30 N, between 6°W and 0°W, northern hemisphere between equator and 84°N, onshore and offshore.
var cloud = 50

// Visualize Landsat Observation Image
var obsstart = '2010-01-01'; //date to start observation period
var obsend = '2023-12-30'; //date to end observation period

//#####################################
// Function to mask clouds
// Assumes the image is a Landsat C2 image
function maskClouds(image) {
  // Bits 3 and 4 are cloud and cloud shadow, respectively.
  var cloudsBitMask = (1 << 3);
  var cloudShadowBitMask = (1 << 4);
  // Get the pixel QA band.
  var qa = image.select('QA_PIXEL');
  // Both flags should be set to zero, indicating clear conditions.
  var mask = qa.bitwiseAnd(cloudShadowBitMask).eq(0)
                 .and(qa.bitwiseAnd(cloudsBitMask).eq(0));
  return image.updateMask(mask);
}
//#####################################
// Functions to apply scaling factors for C2 imagery
function applyScaleFactors_L8(image) {
  var opticalBands = image.select('SR_B.*').multiply(0.0000275).add(-0.2);
  var thermalBands = image.select('ST_B.*').multiply(0.00341802).add(149.0).float();
  return image.addBands(opticalBands, null, true)
              .addBands(thermalBands, null, true);}
function applyScaleFactors_L7L5(image) {
  var opticalBands = image.select('SR_B.*').multiply(0.0000275).add(-0.2);
  var thermalBand = image.select('^ST_B.*').multiply(0.00341802).add(149.0).float();
  return image.addBands(opticalBands, null, true)
              .addBands(thermalBand, null, true);}
//#####################################
//Function for acquiring Landsat SR image collection
function getLandsatImageCollection(studyArea,startDate,endDate,startJulian,endJulian,cloud){
  var ls;var l5SR;var l7SR;var l8SR;var l9SR;var out;

  var sensorBandDictLandsatSR =ee.Dictionary({L9: ee.List([1,2,3,4,5,6,8,17,18]),
                        L8 : ee.List([1,2,3,4,5,6,8,17,18]),
                        L7 : ee.List([0,1,2,3,4,5,8,17,18]),
                        L5 : ee.List([0,1,2,3,4,5,8,17,18])
  });
  var bandNamesLandsatSR = ee.List(['SR_B1','SR_B2','SR_B3','SR_B4','SR_B5','SR_B6','ST_B10','QA_PIXEL', 'QA_RADSAT']);

  l5SR = ee.ImageCollection("LANDSAT/LT05/C02/T1_L2")
      .filterDate(startDate,endDate)
      .filter(ee.Filter.calendarRange(startJulian,endJulian))
      .filterBounds(studyArea)
      .filter(ee.Filter.lte('CLOUD_COVER_LAND',cloud))
      .select(sensorBandDictLandsatSR.get('L5'),bandNamesLandsatSR)
      .map(maskClouds)
      .map(applyScaleFactors_L7L5);

  l7SR = ee.ImageCollection("LANDSAT/LE07/C02/T1_L2")
      .filterDate(startDate,endDate)
      .filter(ee.Filter.calendarRange(startJulian,endJulian))
      .filterBounds(studyArea)
      .filter(ee.Filter.lte('CLOUD_COVER_LAND',cloud))
      .select(sensorBandDictLandsatSR.get('L7'),bandNamesLandsatSR)
      .map(maskClouds)
      .map(applyScaleFactors_L7L5);

  l8SR = ee.ImageCollection("LANDSAT/LC08/C02/T1_L2")
      .filterDate(startDate,endDate)
      .filter(ee.Filter.calendarRange(startJulian,endJulian))
      .filterBounds(studyArea)
      .filter(ee.Filter.lte('CLOUD_COVER_LAND',cloud))
      .select(sensorBandDictLandsatSR.get('L8'),bandNamesLandsatSR)
      .map(maskClouds)
      .map(applyScaleFactors_L8);

  l9SR = ee.ImageCollection("LANDSAT/LC09/C02/T1_L2")
      .filterDate(startDate,endDate)
      .filter(ee.Filter.calendarRange(startJulian,endJulian))
      .filterBounds(studyArea)
      .filter(ee.Filter.lte('CLOUD_COVER_LAND',cloud))
      .select(sensorBandDictLandsatSR.get('L9'),bandNamesLandsatSR)
      .map(maskClouds)
      .map(applyScaleFactors_L8);

  ls = ee.ImageCollection(l5SR.merge(l7SR).merge(l8SR).merge(l9SR));

  out = ls.set('system:time_start', ls.get('system:time_start')) ;
  return out.select('^SR_B.*');
}
//#####################################
// Create a function that adds a year band to the collection
var addYear = function(image){
  var date = ee.Date(image.get('system:time_start')).get('year');
  var year = ee.Image(date).subtract(2000).rename('Year').byte(); //get Year of Image (after 2000)
  return image.addBands(year);}; //add as band
//############# End of Functions ########################

Create the dates for temporal filtering
if(startJulian > endJulian){endJulian = endJulian + 365}

var startDate = ee.Date.fromYMD(startYear,1,1).advance(startJulian,'day');
var endDate = ee.Date.fromYMD(endYear,1,1).advance(endJulian,'day');
print(startDate, endDate, 'Study Time Period');


//Apply functions
//---------------
var collectionSR = getLandsatImageCollection(region,startDate,endDate,startJulian,endJulian,cloud)
var collectionSR_wIndex = collectionSR.map(function(i){
  var ndvi = i.normalizedDifference(['SR_B4', 'SR_B3']).rename('NDVI')
  return i.addBands(ndvi)
}); //add vegetation indices
var collection_IndexYear = collectionSR_wIndex.map(addYear); //add year band

Map.centerObject(region,7)
Map.setOptions('SATELLITE')
Map.addLayer(ee.Image().byte().paint(region,3,3),{palette:'yellow'},'Study Area Region: '+countryCode,false)
Map.addLayer(collectionSR_wIndex,{bands:['SR_B5','SR_B4','SR_B3'],gamma:1.00,'min': 0.05,'max': [0.30,0.40,0.40]},'Landsat Composite',false)

//=======================================================================================
//STEP 2: Create Image of Greatest NDVI Decrease Per Year
//=======================================================================================

//loop through image collection and get a maximum image for each year
var maxCollection = ee.ImageCollection(ee.List.sequence(startYear,endYear).map(function(year){
  return collection_IndexYear.filter(ee.Filter.calendarRange(year,year,'year')).max().set('Year', year);
}));


var maxList = ee.List(maxCollection.toList(maxCollection.size())); //convert image collection to list
//print('Max List of Annual Images',maxList);


//function to get 3-year moving average
var myFunction = function(i){
    var nextYear = ee.Number(i).add(1);
    var previousYear = ee.Number(i).add(-1)

    var nextY = ee.Image(maxList.get(nextYear)); // next image in collection
    var thisYear = ee.Image(maxList.get(i)); //current image in collection
    var previousY =  ee.Image(maxList.get(previousYear));//previous year in collection


    var avg = thisYear.select('NDVI').add(nextY.select('NDVI')).add(previousY.select('NDVI')).divide(3) // Calculate average of this image and next image in collection
    .multiply(-1).rename('NDVI_avg'); //multiply by -1 to flip average (we want loss not gain)
  return ee.Image(maxList.get(i)).addBands(avg);    // Add Moving average band
  };

var listSequence = ee.List.sequence(1,maxList.size().subtract(2));
var avgCollection = ee.ImageCollection(listSequence.map(myFunction));// AS IMAGE COLLECTION


var avgList = ee.List(avgCollection.toList(avgCollection.size()));// AS LIST


//function to get derivative of NDVI curve (max change between years)
var myFunction2 = function(i){
    var aaa = ee.Number(i).add(1);
    var bbb = ee.Image(avgList.get(aaa)); // next image in collection
    var ccc = ee.Image(avgList.get(i)); //current image in collection
    var avg = bbb.select('NDVI_avg').subtract(ccc.select('NDVI_avg')).rename('NDVI_deriv');
  return  ee.Image(avgList.get(i)).addBands(avg);
};

var listSequence2 = ee.List.sequence(0,avgList.size().subtract(2));
var derivCollection = ee.ImageCollection(listSequence2.map(myFunction2)); // AS IMAGE COLLECTION

//Reduce collection to get year of maximum derivative
var derivMosaic = derivCollection.qualityMosaic('NDVI_deriv') ; // Quality Mosaic based on max derivative

var derivativeMaxYear = derivMosaic.select('Year'); // select the Year of max derivative
// ----------------------Ghana_MinesRF_30m_MaxYear3YrAvg
// Export.image.toAsset({
//     image: derivativeMaxYear,
//     description: '7_'+countryCode+'_'+'MinesRF_30m_Max3YrAvg_'+startYear+'_'+endYear,
//     assetId: assetId+'7_'+countryCode+'_'+'MinesRF_30m_Max3YrAvg_'+startYear+'_'+endYear,
//     region: region,
//     crs:crs,
//     scale: 30,
//     maxPixels: 1e13
//   });
// //=======================================================================================
// //STEP 3: Get Area Per Year 2007-2017 and Chart
// //=======================================================================================

var years = ee.List.sequence(1,23,1);

var getArea = ee.FeatureCollection(years.map(function(i){
    var year = ee.Number(i);              //is this where we update?
    var def = maxYrDeriv.eq(year);//add derivative Max Year get new output to export later
    var defArea = def.multiply(ee.Image.pixelArea()).divide(10000).reduceRegion({
      reducer:ee.Reducer.sum(),
      geometry:region,
      scale: 100,
      maxPixels:1e13,
      tileScale: 16
      }).get('Year');
  return ee.Feature(null).set('Area', defArea).set('Year',year);
}));
print(getArea)
//Construct Bar Chart

var options = {
  title: 'Mining Area by Year',
  vAxis: {title: 'Area in Hectares'},
  legend: {position: 'none'},
  hAxis: {
    title: 'Year',
    logScale: false
  }
};

var areaChart = getArea.select(['Year','Area'])

print(areaChart.getInfo())

var chart = ui.Chart.feature.byFeature(areaChart,'Year');
var chart = chart.setChartType('ColumnChart')
var chart = chart.setOptions(options)
print(chart)


//=======================================================================================
//STEP 4: Map results
//=======================================================================================
//Set up visualization
var palette = ['#4B0082', '#9400D3',  '#0000FF', '#00FF00', '#FFFF00', '#FF7F00', '#FF0000'];
var yodVizParms = {
  min: 7,
  max: 17,
  palette: palette
};

// Map of Loss Year based on Maximum NDVI Derivative

//Get mines and clean
var final_mines = rf_classification.select(0).eq(1).selfMask();

//Set Variables
var mines = final_mines;
var scale = 30;

var minesMaxYear = derivativeMaxYear.updateMask(mines).clip(studyArea);

// Map of Loss Year based on Maximum NDVI Derivative
Map.addLayer(minesMaxYear,yodVizParms,'Max Derivative Year',true);


//Observation Period Landsat Imagery
Map.addLayer(collection_IndexYear.filterDate(obsstart,obsend).median().clip(region), {bands: ['B3', 'B2', 'B1'], min:200, max:1500}, 'Landsat Image', false);

//NDVI Average Collection
Map.addLayer(avgCollection.select("NDVI_avg"), {}, 'Average Collection', false);

//Derivative NDVI Collection
Map.addLayer(derivCollection.select('NDVI_deriv'), {}, 'Derivative Collection', false)


// =======================================================================================
// STEP 5: Export layers
// =======================================================================================

//Export Area Table
print('Area Collection',getArea);
Export.table.toDrive({
  collection:getArea,
  description: "Ghana_Area_RF"
  });

//Export mines classification image
Export.image.toDrive({
  image: minesMaxYear.clip(studyArea),
  description: 'Ghana_MinesRF_30m_MaxYear3YrAvg2019Full',
  region: region,
  scale: scale,
  maxPixels: 1e13
});

//****************************************************************************************************************************

//END CODE///
真正代码
var roiId = 'projects/mangrovescience/SDG_Ghana/Gold_Mining/StudyAreaSubset';
var roi = ee.FeatureCollection(roiId);
var ic = ee.ImageCollection('LANDSAT/LC08/C02/T1_L2')
.filterBounds(roi)
.select(['SR_B4', 'SR_B5'], ['red', 'nir']);
// Simplifies the dates used in the original script.
var startYear = 2013;
var endYear = 2023;
var years = ee.List.sequence(startYear, endYear, 1); // [2013, ..., 2023]
ic = ic.filter(ee.Filter.calendarRange(startYear, endYear, 'year'));
function scaleImages(image) {
var scale = 0.0000275;
var offset = -0.2;
return image
.multiply(scale)
.add(offset)
.copyProperties(image, ['system:time_start']);
}
function computeNDVI(image) {
var ndvi = image.normalizedDifference(['nir', 'red']).rename('ndvi');
return ndvi.copyProperties(image, ['system:time_start']);
}
// Scales images and calculates the NDVI
var ndviCol = ic
.map(scaleImages)
.map(computeNDVI);
// For each year in "years", obtain an image representing the max NDVI value.
function getAnnualMaxImages(years) {
var images = years.map(function(y) {
y = ee.Number(y);
var imagesYearY = ndviCol.filter(ee.Filter.calendarRange(y, y, 'year'));
var date = ee.Date.fromYMD(y, 1, 1).millis();
var maxImage = imagesYearY.max().set('system:time_start', date, 'year', y);
return maxImage;
});
return ee.ImageCollection.fromImages(images);
}
var maxImages = getAnnualMaxImages(years);
// Get 3-year moving average and adds the year band.
var maxImagesList = maxImages.toList(maxImages.size());
var n = ee.Number(endYear - startYear);
var indices = ee.List.sequence(0, n.subtract(1), 1);
var avgImages = indices.map(function(index) {
index = ee.Number(index);
var prev = index.subtract(1);
var curr = index;
var next = index.add(1);
var prevImg = ee.Image(maxImagesList.get(prev));
var currImg = ee.Image(maxImagesList.get(curr));
var nextImg = ee.Image(maxImagesList.get(next));
var date = currImg.date().millis();
var year = currImg.date().get('year');
var avgImg = ee.ImageCollection([prevImg, currImg, nextImg]).mean();
var yearBand = ee.Image(year)
.subtract(2000)
.toUint8()
.rename('year')
.updateMask(avgImg.mask());
return avgImg
.addBands(yearBand)
.set('system:time_start', date, 'index', index);
});
avgImages = ee.ImageCollection.fromImages(avgImages);
// Remove the first and last year from the analysis - due to the 3-years moving
// average.
var minMaxIndices = ee.List(indices).reduce(ee.Reducer.minMax());
minMaxIndices = ee.Dictionary(minMaxIndices).values();
avgImages = avgImages
.filter(ee.Filter.inList('index', minMaxIndices).not());
// It applies the reducer to obtain the lowest average for each pixel and the
// year in which this lowest average was detected.
var result = avgImages
.reduce(
ee.Reducer.min(2).setOutputs(['ndvi_avg_min', 'year_of_ndvi_avg_min'])
);
// Uncomment to check the results.
Map.addLayer(result.select(0), { min: 0, max: 0.8 });
Map.addLayer(result.select(1), { min: 13, max: 22 });
// Calculates the area, in square meters, for each year within the study area.
var pixelArea = ee.Image.pixelArea()
.addBands(result.select('year_of_ndvi_avg_min'));
var areaByYear = result.reduceRegion({
reducer: ee.Reducer.sum().group({
groupField: 1,
groupName: 'year'
}),
geometry: roi,
scale: 30,
maxPixels: 1e13
});
areaByYear = ee.List(areaByYear.get('groups'));
var areaByYearList = areaByYear.map(function(item) {
var dict = ee.Dictionary(item); // { sum: ..., year: ... }
var year = ee.Number(dict.get('year')).format(); // "13"
var area = ee.Number(dict.get('sum')); // 123.456
return ee.List([year, area]); // ["13", 123.456]
});
// { year: area } dictionary.
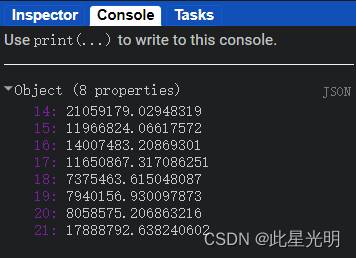
var theEnd = ee.Dictionary(areaByYearList.flatten());
print(theEnd)函数
qualityMosaic(qualityBand)
Composites all the images in a collection, using a quality band as a per-pixel ordering function.
使用质量带作为每个像素的排序函数,合成图像集中的所有图像。
Arguments:
this:collection (ImageCollection):
The collection to mosaic.
qualityBand (String):
The name of the quality band in the collection.
Returns: Image
问题图

接缝图

github
如果想处理条带的结果