PyAlgoTrade 0.20 中文文档(一)
PyAlgoTrade 0.20 中文文档(一)

介绍
PyAlgoTrade 是一个支持事件驱动的算法交易 Python 库,支持:
- 使用来自 CSV 文件的历史数据进行回测。
- 使用 Bitstamp 实时数据进行模拟交易。
- 在 Bitstamp 上进行真实交易。
它还应该使得使用多台计算机优化策略变得容易。
PyAlgoTrade 是使用 Python 2.7/3.7 开发和测试的,依赖于:
- NumPy 和 SciPy (
numpy.scipy.org/)。 - pytz (
pytz.sourceforge.net/)。 - matplotlib (
matplotlib.sourceforge.net/) 用于绘图支持。 - ws4py (
github.com/Lawouach/WebSocket-for-Python) 支持 Bitstamp。 - tornado (
www.tornadoweb.org/en/stable/) 支持 Bitstamp。 - tweepy (
github.com/tweepy/tweepy) 支持 Twitter。
因此,您需要安装这些才能使用此库。
您可以像这样使用 pip 安装 PyAlgoTrade:
pip install pyalgotrade教程
原文:
gbeced.github.io/pyalgotrade/docs/v0.20/html/tutorial.html
本教程的目标是为您快速介绍 PyAlgoTrade。如介绍所述,PyAlgoTrade 的目标是帮助您回测股票交易策略。假设你有一个交易策略的想法,并且想用历史数据评估它的表现,PyAlgoTrade 应该能够让你以最少的努力实现这一点。
在我继续之前,我想感谢 Pablo Jorge,他帮助审查了最初的设计和文档。
本教程是在 UNIX 环境下开发的,但是将其调整到 Windows 环境应该很简单。
PyAlgoTrade 有 6 个主要组件:
- 策略
- 数据源
- 经纪人
- 数据系列
- 技术指标
- 优化器
策略
这些是你定义的类,实现了交易逻辑。什么时候买,什么时候卖,等等。
数据源
这些是提供数据的抽象。例如,你将使用一个 CSV 数据源,从 CSV(逗号分隔值)格式的文件中加载柱状图,以向策略提供数据。数据源不限于柱状图。例如,有一个 Twitter 数据源,允许将 Twitter 事件纳入交易决策中。
经纪人
经纪人负责执行订单。
数据系列
数据系列是用于管理时间序列数据的抽象。
技术指标
这些是一组过滤器,你用它们对 DataSeries 进行计算。例如 SMA(简单移动平均)、RSI(相对强弱指标)等。这些过滤器被建模为 DataSeries 装饰器。
优化器
这些是一组允许您在不同计算机之间分发回测的类,或者在同一计算机上运行的不同进程之间分发回测的类,或者两者兼而有之。它们使水平扩展变得容易。
说了这么多,我们测试策略所需的第一件事是一些数据。让我们使用 2000 年 Oracle 的股价,我们将使用以下命令下载:
python -m "pyalgotrade.tools.quandl" --source-code="WIKI" --table-code="ORCL" --from-year=2000 --to-year=2000 --storage=. --force-download --frequency=dailypyalgotrade.tools.quandl 工具从Quandl下载 CSV 格式的数据。WIKI-ORCL-2000-quandl.csv的前几行应该是这样的:
Date,Open,High,Low,Close,Volume,Ex-Dividend,Split Ratio,Adj. Open,Adj. High,Adj. Low,Adj. Close,Adj. Volume
2000-12-29,30.88,31.31,28.69,29.06,31702200.0,0.0,1.0,28.121945213877797,28.513539658242028,26.127545601883227,26.46449896098733,31702200.0
2000-12-28,30.56,31.63,30.38,31.06,25053600.0,0.0,1.0,27.830526092490462,28.804958779629363,27.666602836710087,28.285868469658173,25053600.0
2000-12-27,30.38,31.06,29.38,30.69,26437500.0,0.0,1.0,27.666602836710087,28.285868469658173,26.755918082374667,27.94891511055407,26437500.0
2000-12-26,31.5,32.19,30.0,30.94,20589500.0,0.0,1.0,28.68656976156576,29.3149422420572,27.32054263006263,28.176586299137927,20589500.0
2000-12-22,30.38,31.98,30.0,31.88,35568200.0,0.0,1.0,27.666602836710087,29.123698443646763,27.32054263006263,29.032629968213218,35568200.0
2000-12-21,27.81,30.25,27.31,29.5,46719700.0,0.0,1.0,25.326143018068056,27.548213818646484,24.870800640900345,26.86520025289492,46719700.0
2000-12-20,28.06,29.81,27.5,28.5,54440500.0,0.0,1.0,25.55381420665191,27.147512526738897,25.043830744224078,25.9545154985595,54440500.0
2000-12-19,31.81,33.13,30.13,30.63,58653700.0,0.0,1.0,28.968882035409738,30.170985911132497,27.438931648126232,27.894274025293942,58653700.0
2000-12-18,30.0,32.44,29.94,32.0,61640100.0,0.0,1.0,27.32054263006263,29.542613430641055,27.265901544802503,29.14191213873347,61640100.0
让我们从一个简单的策略开始,即一个只是打印处理的收盘价的策略:
from pyalgotrade import strategy
from pyalgotrade.barfeed import quandlfeed

class MyStrategy(strategy.BacktestingStrategy):
    def __init__(self, feed, instrument):
        super(MyStrategy, self).__init__(feed)
        self.__instrument = instrument

    def onBars(self, bars):
        bar = bars[self.__instrument]
        self.info(bar.getClose())

# Load the bar feed from the CSV file
feed = quandlfeed.Feed()
feed.addBarsFromCSV("orcl", "WIKI-ORCL-2000-quandl.csv")

# Evaluate the strategy with the feed's bars.
myStrategy = MyStrategy(feed, "orcl")
myStrategy.run()
代码正在做三件主要的事情:
- 声明一个新策略。只需定义一个方法,onBars,它会在每个数据源的柱状图上调用。
- 从 CSV 文件加载数据源。
- 用数据源提供的柱状图运行策略。
如果你运行这个脚本,你应该按顺序看到收盘价:
2000-01-03 00:00:00 strategy [INFO] 118.1
2000-01-04 00:00:00 strategy [INFO] 107.7
2000-01-05 00:00:00 strategy [INFO] 103.5
.
.
.
2000-12-27 00:00:00 strategy [INFO] 30.69
2000-12-28 00:00:00 strategy [INFO] 31.06
2000-12-29 00:00:00 strategy [INFO] 29.06
让我们继续使用一个打印收盘 SMA 价格的策略,以说明技术指标的使用方法:
from pyalgotrade import strategy
from pyalgotrade.barfeed import quandlfeed
from pyalgotrade.technical import ma

def safe_round(value, digits):
    if value is not None:
        value = round(value, digits)
    return value

class MyStrategy(strategy.BacktestingStrategy):
    def __init__(self, feed, instrument):
        super(MyStrategy, self).__init__(feed)
        # We want a 15 period SMA over the closing prices.
        self.__sma = ma.SMA(feed[instrument].getCloseDataSeries(), 15)
        self.__instrument = instrument

    def onBars(self, bars):
        bar = bars[self.__instrument]
        self.info("%s  %s" % (bar.getClose(), safe_round(self.__sma[-1], 2)))

# Load the bar feed from the CSV file
feed = quandlfeed.Feed()
feed.addBarsFromCSV("orcl", "WIKI-ORCL-2000-quandl.csv")

# Evaluate the strategy with the feed's bars.
myStrategy = MyStrategy(feed, "orcl")
myStrategy.run()
这与前面的示例非常相似,只是
- 我们正在对收盘价数据系列初始化 SMA 过滤器。
- 我们打印当前 SMA 值以及收盘价。
如果你运行脚本,你应该会看到收盘价和相应的 SMA 值,但在这种情况下,前 14 个 SMA 值为 None。这是因为我们需要至少 15 个值才能从 SMA 中得到结果:
2000-01-03 00:00:00 strategy [INFO] 118.1 None
2000-01-04 00:00:00 strategy [INFO] 107.7 None
2000-01-05 00:00:00 strategy [INFO] 103.5 None
2000-01-06 00:00:00 strategy [INFO] 96.0 None
2000-01-07 00:00:00 strategy [INFO] 103.4 None
2000-01-10 00:00:00 strategy [INFO] 115.8 None
2000-01-11 00:00:00 strategy [INFO] 112.4 None
2000-01-12 00:00:00 strategy [INFO] 105.6 None
2000-01-13 00:00:00 strategy [INFO] 105.1 None
2000-01-14 00:00:00 strategy [INFO] 106.8 None
2000-01-18 00:00:00 strategy [INFO] 111.3 None
2000-01-19 00:00:00 strategy [INFO] 57.13 None
2000-01-20 00:00:00 strategy [INFO] 59.25 None
2000-01-21 00:00:00 strategy [INFO] 59.69 None
2000-01-24 00:00:00 strategy [INFO] 54.19 94.4
2000-01-25 00:00:00 strategy [INFO] 56.44 90.29
.
.
.
2000-12-27 00:00:00 strategy [INFO] 30.69 29.99
2000-12-28 00:00:00 strategy [INFO] 31.06 30.05
2000-12-29 00:00:00 strategy [INFO] 29.06 30.1
当值无法在给定时间计算时,所有的技术指标都将返回 None。
有关技术指标的一个重要事项是它们可以组合使用。这是因为它们也被建模为 DataSeries。例如,获取收盘价上的 RSI 上的 SMA 就像这样简单:
from pyalgotrade import strategy
from pyalgotrade.barfeed import quandlfeed
from pyalgotrade.technical import ma
from pyalgotrade.technical import rsi

def safe_round(value, digits):
    if value is not None:
        value = round(value, digits)
    return value

class MyStrategy(strategy.BacktestingStrategy):
    def __init__(self, feed, instrument):
        super(MyStrategy, self).__init__(feed)
        self.__rsi = rsi.RSI(feed[instrument].getCloseDataSeries(), 14)
        self.__sma = ma.SMA(self.__rsi, 15)
        self.__instrument = instrument

    def onBars(self, bars):
        bar = bars[self.__instrument]
        self.info("%s  %s  %s" % (
            bar.getClose(), safe_round(self.__rsi[-1], 2), safe_round(self.__sma[-1], 2)
        ))

# Load the bar feed from the CSV file
feed = quandlfeed.Feed()
feed.addBarsFromCSV("orcl", "WIKI-ORCL-2000-quandl.csv")

# Evaluate the strategy with the feed's bars.
myStrategy = MyStrategy(feed, "orcl")
myStrategy.run()
如果你运行脚本,你应该会在屏幕上看到一堆值,其中
- 前 14 个 RSI 值为 None。这是因为我们需要至少 15 个值才能得到一个 RSI 值。
- 前 28 个 SMA 值为 None。这是因为前 14 个 RSI 值为 None,而第 15 个是 SMA 过滤器收到的第一个非 None 值。只有当我们有 15 个非 None 值时,才能计算 SMA(15)。
2000-01-03 00:00:00 strategy [INFO] 118.1 None None
2000-01-04 00:00:00 strategy [INFO] 107.7 None None
2000-01-05 00:00:00 strategy [INFO] 103.5 None None
2000-01-06 00:00:00 strategy [INFO] 96.0 None None
2000-01-07 00:00:00 strategy [INFO] 103.4 None None
2000-01-10 00:00:00 strategy [INFO] 115.8 None None
2000-01-11 00:00:00 strategy [INFO] 112.4 None None
2000-01-12 00:00:00 strategy [INFO] 105.6 None None
2000-01-13 00:00:00 strategy [INFO] 105.1 None None
2000-01-14 00:00:00 strategy [INFO] 106.8 None None
2000-01-18 00:00:00 strategy [INFO] 111.3 None None
2000-01-19 00:00:00 strategy [INFO] 57.13 None None
2000-01-20 00:00:00 strategy [INFO] 59.25 None None
2000-01-21 00:00:00 strategy [INFO] 59.69 None None
2000-01-24 00:00:00 strategy [INFO] 54.19 23.6 None
2000-01-25 00:00:00 strategy [INFO] 56.44 25.1 None
2000-01-26 00:00:00 strategy [INFO] 55.06 24.78 None
2000-01-27 00:00:00 strategy [INFO] 51.81 24.0 None
2000-01-28 00:00:00 strategy [INFO] 47.38 22.94 None
2000-01-31 00:00:00 strategy [INFO] 49.95 25.01 None
2000-02-01 00:00:00 strategy [INFO] 54.0 28.27 None
2000-02-02 00:00:00 strategy [INFO] 54.31 28.53 None
2000-02-03 00:00:00 strategy [INFO] 56.69 30.58 None
2000-02-04 00:00:00 strategy [INFO] 57.81 31.58 None
2000-02-07 00:00:00 strategy [INFO] 59.94 33.53 None
2000-02-08 00:00:00 strategy [INFO] 59.56 33.35 None
2000-02-09 00:00:00 strategy [INFO] 59.94 33.73 None
2000-02-10 00:00:00 strategy [INFO] 62.31 36.23 None
2000-02-11 00:00:00 strategy [INFO] 59.69 34.68 29.06
2000-02-14 00:00:00 strategy [INFO] 62.19 37.44 29.98
.
.
.
2000-12-27 00:00:00 strategy [INFO] 30.69 51.31 49.85
2000-12-28 00:00:00 strategy [INFO] 31.06 52.16 50.0
2000-12-29 00:00:00 strategy [INFO] 29.06 47.37 50.08
交易
让我们用一个简单的策略继续,这次模拟实际交易。这个想法非常简单:
- 如果调整后的收盘价高于 SMA(15),我们就进入多头头寸(我们放置一个市价买单)。
- 如果已经存在多头头寸,并且调整后的收盘价低于 SMA(15),我们就退出多头头寸(我们放置一个卖市价单)。
from __future__ import print_function

from pyalgotrade import strategy
from pyalgotrade.barfeed import quandlfeed
from pyalgotrade.technical import ma

class MyStrategy(strategy.BacktestingStrategy):
    def __init__(self, feed, instrument, smaPeriod):
        super(MyStrategy, self).__init__(feed, 1000)
        self.__position = None
        self.__instrument = instrument
        # We'll use adjusted close values instead of regular close values.
        self.setUseAdjustedValues(True)
        self.__sma = ma.SMA(feed[instrument].getPriceDataSeries(), smaPeriod)

    def onEnterOk(self, position):
        execInfo = position.getEntryOrder().getExecutionInfo()
        self.info("BUY at $%.2f" % (execInfo.getPrice()))

    def onEnterCanceled(self, position):
        self.__position = None

    def onExitOk(self, position):
        execInfo = position.getExitOrder().getExecutionInfo()
        self.info("SELL at $%.2f" % (execInfo.getPrice()))
        self.__position = None

    def onExitCanceled(self, position):
        # If the exit was canceled, re-submit it.
        self.__position.exitMarket()

    def onBars(self, bars):
        # Wait for enough bars to be available to calculate a SMA.
        if self.__sma[-1] is None:
            return

        bar = bars[self.__instrument]
        # If a position was not opened, check if we should enter a long position.
        if self.__position is None:
            if bar.getPrice() > self.__sma[-1]:
                # Enter a buy market order for 10 shares. The order is good till canceled.
                self.__position = self.enterLong(self.__instrument, 10, True)
        # Check if we have to exit the position.
        elif bar.getPrice() < self.__sma[-1] and not self.__position.exitActive():
            self.__position.exitMarket()

def run_strategy(smaPeriod):
    # Load the bar feed from the CSV file
    feed = quandlfeed.Feed()
    feed.addBarsFromCSV("orcl", "WIKI-ORCL-2000-quandl.csv")

    # Evaluate the strategy with the feed.
    myStrategy = MyStrategy(feed, "orcl", smaPeriod)
    myStrategy.run()
    print("Final portfolio value: $%.2f" % myStrategy.getBroker().getEquity())

run_strategy(15)
如果你运行脚本,你应该会看到类似于这样的东西:
2000-01-26 00:00:00 strategy [INFO] BUY at $25.84
2000-01-28 00:00:00 strategy [INFO] SELL at $23.45
2000-02-03 00:00:00 strategy [INFO] BUY at $25.22
2000-02-22 00:00:00 strategy [INFO] SELL at $26.92
2000-02-23 00:00:00 strategy [INFO] BUY at $27.41
2000-03-31 00:00:00 strategy [INFO] SELL at $36.51
2000-04-07 00:00:00 strategy [INFO] BUY at $38.11
2000-04-12 00:00:00 strategy [INFO] SELL at $35.49
2000-04-19 00:00:00 strategy [INFO] BUY at $35.80
2000-04-20 00:00:00 strategy [INFO] SELL at $33.61
2000-04-28 00:00:00 strategy [INFO] BUY at $35.74
2000-05-05 00:00:00 strategy [INFO] SELL at $33.70
2000-05-08 00:00:00 strategy [INFO] BUY at $34.29
2000-05-09 00:00:00 strategy [INFO] SELL at $33.55
2000-05-16 00:00:00 strategy [INFO] BUY at $35.35
2000-05-19 00:00:00 strategy [INFO] SELL at $32.78
2000-05-31 00:00:00 strategy [INFO] BUY at $33.35
2000-06-23 00:00:00 strategy [INFO] SELL at $36.80
2000-06-27 00:00:00 strategy [INFO] BUY at $37.51
2000-06-28 00:00:00 strategy [INFO] SELL at $37.37
2000-06-29 00:00:00 strategy [INFO] BUY at $37.37
2000-06-30 00:00:00 strategy [INFO] SELL at $36.60
2000-07-03 00:00:00 strategy [INFO] BUY at $36.94
2000-07-05 00:00:00 strategy [INFO] SELL at $34.97
2000-07-21 00:00:00 strategy [INFO] BUY at $35.26
2000-07-24 00:00:00 strategy [INFO] SELL at $35.12
2000-07-26 00:00:00 strategy [INFO] BUY at $34.06
2000-07-28 00:00:00 strategy [INFO] SELL at $34.21
2000-08-01 00:00:00 strategy [INFO] BUY at $34.24
2000-08-02 00:00:00 strategy [INFO] SELL at $33.24
2000-08-04 00:00:00 strategy [INFO] BUY at $35.66
2000-09-11 00:00:00 strategy [INFO] SELL at $39.19
2000-09-29 00:00:00 strategy [INFO] BUY at $37.05
2000-10-02 00:00:00 strategy [INFO] SELL at $36.31
2000-10-20 00:00:00 strategy [INFO] BUY at $32.90
2000-10-31 00:00:00 strategy [INFO] SELL at $29.72
2000-11-20 00:00:00 strategy [INFO] BUY at $22.14
2000-11-21 00:00:00 strategy [INFO] SELL at $22.59
2000-12-01 00:00:00 strategy [INFO] BUY at $24.02
2000-12-15 00:00:00 strategy [INFO] SELL at $26.81
2000-12-18 00:00:00 strategy [INFO] BUY at $27.32
2000-12-21 00:00:00 strategy [INFO] SELL at $25.33
2000-12-22 00:00:00 strategy [INFO] BUY at $27.67
Final portfolio value: $974.87
但是,如果我们使用 30 作为 SMA 周期,而不是 15?那会产生更好的结果还是更差的结果?我们当然可以做这样的事情:
for i in range(10, 30):
    run_strategy(i)
我们会发现,使用 SMA(20)可以获得更好的结果:
Final portfolio value: $1071.03如果我们只需要尝试有限的参数值集合,那么这是可以的。但是如果我们必须测试一个具有多个参数的策略,那么串行方法肯定不会随着策略变得更加复杂而扩展。
优化
满足优化器组件。这个想法非常简单:
- 有一个负责的服务器:
-
- 提供运行策略的条形图。
- 提供运行策略的参数。
- 记录每个工作人员的策略结果。
- 有多个负责的工作人员:
-
- 使用服务器提供的条形图和参数运行策略。
为了说明这一点,我们将使用一个称为RSI2的策略,它需要以下参数
- 用于趋势识别的 SMA 周期。我们将其称为 entrySMA,范围在 150 到 250 之间。
- 退出点使用较小的 SMA 周期。我们将其称为 exitSMA,范围在 5 到 15 之间。
- 用于进入短头寸/多头头寸的 RSI 周期。我们将其称为 rsiPeriod,范围在 2 到 10 之间。
- 用于多头头寸进入的 RSI 超卖阈值。我们将其称为 overSoldThreshold,范围在 5 到 25 之间。
- 用于短头寸进入的 RSI 超买阈值。我们将其称为 overBoughtThreshold,范围在 75 到 95 之间。
如果我的数学没错的话,这些是 4409559 个不同的组合。
对于一个参数集测试该策略大约需要 0.16 秒。如果我串行执行所有组合,那么评估它们并找到最佳参数组合将需要大约 8.5 天的时间。那是一个很长的时间,但如果我可以让十台 8 核计算机来做这个工作,那么总时间将缩短到约 2.5 小时。
长话短说,我们需要并行化。
让我们从下载“IBM”的 3 年每日柱开始:
python -m "pyalgotrade.tools.quandl" --source-code="WIKI" --table-code="IBM" --from-year=2009 --to-year=2011 --storage=. --force-download --frequency=daily将此代码保存为 rsi2.py:
from pyalgotrade import strategy
from pyalgotrade.technical import ma
from pyalgotrade.technical import rsi
from pyalgotrade.technical import cross

class RSI2(strategy.BacktestingStrategy):
    def __init__(self, feed, instrument, entrySMA, exitSMA, rsiPeriod, overBoughtThreshold, overSoldThreshold):
        super(RSI2, self).__init__(feed)
        self.__instrument = instrument
        # We'll use adjusted close values, if available, instead of regular close values.
        if feed.barsHaveAdjClose():
            self.setUseAdjustedValues(True)
        self.__priceDS = feed[instrument].getPriceDataSeries()
        self.__entrySMA = ma.SMA(self.__priceDS, entrySMA)
        self.__exitSMA = ma.SMA(self.__priceDS, exitSMA)
        self.__rsi = rsi.RSI(self.__priceDS, rsiPeriod)
        self.__overBoughtThreshold = overBoughtThreshold
        self.__overSoldThreshold = overSoldThreshold
        self.__longPos = None
        self.__shortPos = None

    def getEntrySMA(self):
        return self.__entrySMA

    def getExitSMA(self):
        return self.__exitSMA

    def getRSI(self):
        return self.__rsi

    def onEnterCanceled(self, position):
        if self.__longPos == position:
            self.__longPos = None
        elif self.__shortPos == position:
            self.__shortPos = None
        else:
            assert(False)

    def onExitOk(self, position):
        if self.__longPos == position:
            self.__longPos = None
        elif self.__shortPos == position:
            self.__shortPos = None
        else:
            assert(False)

    def onExitCanceled(self, position):
        # If the exit was canceled, re-submit it.
        position.exitMarket()

    def onBars(self, bars):
        # Wait for enough bars to be available to calculate SMA and RSI.
        if self.__exitSMA[-1] is None or self.__entrySMA[-1] is None or self.__rsi[-1] is None:
            return

        bar = bars[self.__instrument]
        if self.__longPos is not None:
            if self.exitLongSignal():
                self.__longPos.exitMarket()
        elif self.__shortPos is not None:
            if self.exitShortSignal():
                self.__shortPos.exitMarket()
        else:
            if self.enterLongSignal(bar):
                shares = int(self.getBroker().getCash() * 0.9 / bars[self.__instrument].getPrice())
                self.__longPos = self.enterLong(self.__instrument, shares, True)
            elif self.enterShortSignal(bar):
                shares = int(self.getBroker().getCash() * 0.9 / bars[self.__instrument].getPrice())
                self.__shortPos = self.enterShort(self.__instrument, shares, True)

    def enterLongSignal(self, bar):
        return bar.getPrice() > self.__entrySMA[-1] and self.__rsi[-1] <= self.__overSoldThreshold

    def exitLongSignal(self):
        return cross.cross_above(self.__priceDS, self.__exitSMA) and not self.__longPos.exitActive()

    def enterShortSignal(self, bar):
        return bar.getPrice() < self.__entrySMA[-1] and self.__rsi[-1] >= self.__overBoughtThreshold

    def exitShortSignal(self):
        return cross.cross_below(self.__priceDS, self.__exitSMA) and not self.__shortPos.exitActive()
这是服务器脚本:
import itertools
from pyalgotrade.optimizer import server
from pyalgotrade.barfeed import quandlfeed

def parameters_generator():
    instrument = ["ibm"]
    entrySMA = range(150, 251)
    exitSMA = range(5, 16)
    rsiPeriod = range(2, 11)
    overBoughtThreshold = range(75, 96)
    overSoldThreshold = range(5, 26)
    return itertools.product(instrument, entrySMA, exitSMA, rsiPeriod, overBoughtThreshold, overSoldThreshold)

# The if __name__ == '__main__' part is necessary if running on Windows.
if __name__ == '__main__':
    # Load the bar feed from the CSV files.
    feed = quandlfeed.Feed()
    feed.addBarsFromCSV("ibm", "WIKI-IBM-2009-quandl.csv")
    feed.addBarsFromCSV("ibm", "WIKI-IBM-2010-quandl.csv")
    feed.addBarsFromCSV("ibm", "WIKI-IBM-2011-quandl.csv")

    # Run the server.
    server.serve(feed, parameters_generator(), "localhost", 5000)
服务器代码正在做 3 件事:
- 声明一个生成器函数,产生策略的不同参数组合。
- 使用我们下载的 CSV 文件加载源数据。
- 运行服务器,它将在端口 5000 上等待传入连接。
这是工作脚本,使用 pyalgotrade.optimizer.worker 模块并行运行由服务器提供数据的策略:
from pyalgotrade.optimizer import worker
import rsi2

# The if __name__ == '__main__' part is necessary if running on Windows.
if __name__ == '__main__':
    worker.run(rsi2.RSI2, "localhost", 5000, workerName="localworker")
当你运行服务器和客户端时,你会在服务器控制台上看到类似这样的东西:
2017-07-21 22:56:51,944 pyalgotrade.optimizer.server [INFO] Starting server
2017-07-21 22:56:51,944 pyalgotrade.optimizer.xmlrpcserver [INFO] Loading bars
2017-07-21 22:56:52,609 pyalgotrade.optimizer.xmlrpcserver [INFO] Started serving
2017-07-21 22:58:50,073 pyalgotrade.optimizer.xmlrpcserver [INFO] Best result so far 1261295.07089 with parameters ('ibm', 150, 5, 2, 83, 24)
.
.
以及在工作节点控制台上看到类似这样的东西:
2017-07-21 22:56:57,884 localworker [INFO] Started running
2017-07-21 22:56:57,884 localworker [INFO] Started running
2017-07-21 22:56:58,439 localworker [INFO] Running strategy with parameters ('ibm', 150, 5, 2, 84, 15)
2017-07-21 22:56:58,498 localworker [INFO] Running strategy with parameters ('ibm', 150, 5, 2, 94, 5)
2017-07-21 22:56:58,918 localworker [INFO] Result 1137855.88871
2017-07-21 22:56:58,918 localworker [INFO] Running strategy with parameters ('ibm', 150, 5, 2, 84, 14)
2017-07-21 22:56:58,996 localworker [INFO] Result 1027761.85581
2017-07-21 22:56:58,997 localworker [INFO] Running strategy with parameters ('ibm', 150, 5, 2, 93, 25)
2017-07-21 22:56:59,427 localworker [INFO] Result 1092194.67448
2017-07-21 22:57:00,016 localworker [INFO] Result 1260766.64479
.
.
请注意,你应该运行 只有一个服务器和一个或多个工作节点。
如果你只想在自己的桌面上并行运行策略,你可以像这样利用 pyalgotrade.optimizer.local 模块:
import itertools
from pyalgotrade.optimizer import local
from pyalgotrade.barfeed import quandlfeed
import rsi2

def parameters_generator():
    instrument = ["ibm"]
    entrySMA = range(150, 251)
    exitSMA = range(5, 16)
    rsiPeriod = range(2, 11)
    overBoughtThreshold = range(75, 96)
    overSoldThreshold = range(5, 26)
    return itertools.product(instrument, entrySMA, exitSMA, rsiPeriod, overBoughtThreshold, overSoldThreshold)

# The if __name__ == '__main__' part is necessary if running on Windows.
if __name__ == '__main__':
    # Load the bar feed from the CSV files.
    feed = quandlfeed.Feed()
    feed.addBarsFromCSV("ibm", "WIKI-IBM-2009-quandl.csv")
    feed.addBarsFromCSV("ibm", "WIKI-IBM-2010-quandl.csv")
    feed.addBarsFromCSV("ibm", "WIKI-IBM-2011-quandl.csv")

    local.run(rsi2.RSI2, feed, parameters_generator())
该代码正在做 3 件事
- 声明一个生成器函数,产生不同的参数组合。
- 使用我们下载的 CSV 文件加载源数据。
- 使用 pyalgotrade.optimizer.local 模块并行运行策略,找到最佳结果。
当你运行此代码时,你应该看到类似这样的东西:
2017-07-21 22:59:26,921 pyalgotrade.optimizer.local [INFO] Starting server
2017-07-21 22:59:26,922 pyalgotrade.optimizer.xmlrpcserver [INFO] Loading bars
2017-07-21 22:59:26,922 pyalgotrade.optimizer.local [INFO] Starting workers
2017-07-21 22:59:27,642 pyalgotrade.optimizer.xmlrpcserver [INFO] Started serving
2017-07-21 23:01:14,306 pyalgotrade.optimizer.xmlrpcserver [INFO] Best result so far 1261295.07089 with parameters ('ibm', 150, 5, 2, 83, 24)
.
.
绘图
PyAlgoTrade 可以很容易地绘制策略执行。
将此保存为 sma_crossover.py:
from pyalgotrade import strategy
from pyalgotrade.technical import ma
from pyalgotrade.technical import cross

class SMACrossOver(strategy.BacktestingStrategy):
    def __init__(self, feed, instrument, smaPeriod):
        super(SMACrossOver, self).__init__(feed)
        self.__instrument = instrument
        self.__position = None
        # We'll use adjusted close values instead of regular close values.
        self.setUseAdjustedValues(True)
        self.__prices = feed[instrument].getPriceDataSeries()
        self.__sma = ma.SMA(self.__prices, smaPeriod)

    def getSMA(self):
        return self.__sma

    def onEnterCanceled(self, position):
        self.__position = None

    def onExitOk(self, position):
        self.__position = None

    def onExitCanceled(self, position):
        # If the exit was canceled, re-submit it.
        self.__position.exitMarket()

    def onBars(self, bars):
        # If a position was not opened, check if we should enter a long position.
        if self.__position is None:
            if cross.cross_above(self.__prices, self.__sma) > 0:
                shares = int(self.getBroker().getCash() * 0.9 / bars[self.__instrument].getPrice())
                # Enter a buy market order. The order is good till canceled.
                self.__position = self.enterLong(self.__instrument, shares, True)
        # Check if we have to exit the position.
        elif not self.__position.exitActive() and cross.cross_below(self.__prices, self.__sma) > 0:
            self.__position.exitMarket()
并将此代码保存到不同的文件中:
from pyalgotrade import plotter
from pyalgotrade.barfeed import quandlfeed
from pyalgotrade.stratanalyzer import returns
import sma_crossover
# Load the bar feed from the CSV file
feed = quandlfeed.Feed()
feed.addBarsFromCSV("orcl", "WIKI-ORCL-2000-quandl.csv")
# Evaluate the strategy with the feed's bars.
myStrategy = sma_crossover.SMACrossOver(feed, "orcl", 20)
# Attach a returns analyzers to the strategy.
returnsAnalyzer = returns.Returns()
myStrategy.attachAnalyzer(returnsAnalyzer)
# Attach the plotter to the strategy.
plt = plotter.StrategyPlotter(myStrategy)
# Include the SMA in the instrument's subplot to get it displayed along with the closing prices.
plt.getInstrumentSubplot("orcl").addDataSeries("SMA", myStrategy.getSMA())
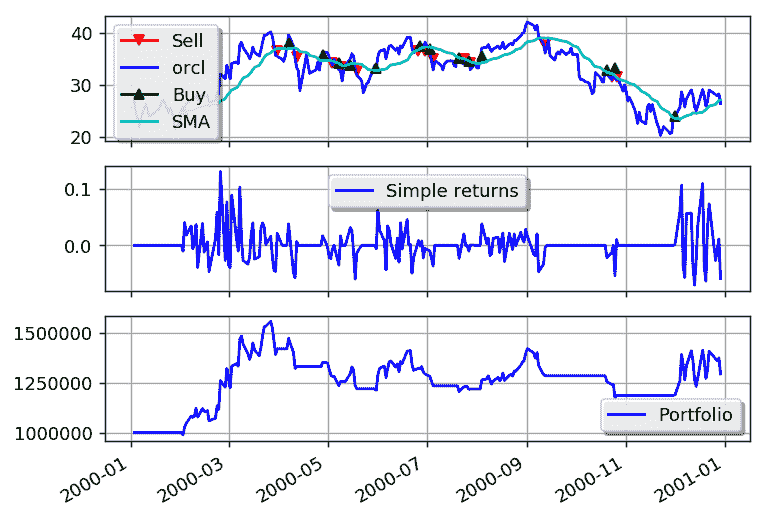
# Plot the simple returns on each bar.
plt.getOrCreateSubplot("returns").addDataSeries("Simple returns", returnsAnalyzer.getReturns())
# Run the strategy.
myStrategy.run()
myStrategy.info("Final portfolio value: $%.2f" % myStrategy.getResult())
# Plot the strategy.
plt.plot() 该代码正在做 3 件事
- 从 CSV 文件加载源数据。
- 使用由 feed 提供的柱和附加了 StrategyPlotter 的策略运行。
- 绘制策略。
这就是绘图的样子:
希望您喜欢这个快速介绍。我建议您在这里下载 PyAlgoTrade:gbeced.github.io/pyalgotrade/downloads/index.html,并开始编写您自己的策略。
您也可以在示例策略 部分找到更多示例。
目录
- 教程
- 交易
- 优化
- 绘图
代码文档
目录:
- K 线 – 工具价格
- 数据序列 – 基本数据序列类
- 数据源 – 基本数据源
- CSV 支持
- CSV 支持示例
- K 线数据源 – K 线提供者
- CSV
- Yahoo! Finance
- Google Finance
- Quandl
- Ninja Trader
- 技术指标 – 技术指标
- 示例
- 移动平均线
- 动量指标
- 其他指标
- 经纪人 – 订单管理类
- 基础模块和类
- 回测模块和类
- 策略 – 基本策略类
- 策略
- 持仓
- 策略分析器 – 策略分析器
- 收益率
- 夏普比率
- 回撤
- 交易
- 示例
- 绘图器 – 策略绘图器
- 优化器 – 并行优化器
- 市场交易时段
条形 – 工具价格
class pyalgotrade.bar.``Frequency
基类: object
枚举类似于条形频率。有效值为:
- Frequency.TRADE: 每个条形代表一次交易。
- Frequency.SECOND: 每个条形总结了一秒的交易活动。
- Frequency.MINUTE: 每个条形总结了一分钟的交易活动。
- Frequency.HOUR: 每个条形总结了一小时的交易活动。
- Frequency.DAY: 每个条形总结了一天的交易活动。
- Frequency.WEEK: 每个条形总结了一周的交易活动。
- Frequency.MONTH: 每个条形总结了一月的交易活动。
class pyalgotrade.bar.``Bar
基类: object
条形是给定期间内安全性交易活动的摘要。
注意
这是一个基类,不应直接使用。
getDateTime()
返回datetime.datetime。
getOpen(adjusted=False)
返回开盘价。
getHigh(adjusted=False)
返回最高价格。
getLow(adjusted=False)
返回最低价格。
getClose(adjusted=False)
返回收盘价。
getVolume()
返回成交量。
getAdjClose()
返回调整后的收盘价。
getFrequency()
条形的周期。
getTypicalPrice()
返回典型价格。
getPrice()
返回收盘或调整后的收盘价。
class pyalgotrade.bar.``Bars(barDict)
基类: object
一组Bar对象。
参数: | barDict (map.) – 工具到Bar对象的映射。 |
|---|
注意
所有条形必须具有相同的日期时间。
__getitem__(instrument)
返回给定工具的pyalgotrade.bar.Bar。如果未找到该工具,则会引发异常。
__contains__(instrument)
如果给定工具的pyalgotrade.bar.Bar可用,则返回 True。
getInstruments()
返回工具符号。
getDateTime()
返回此条形的datetime.datetime。
getBar(instrument)
返回给定工具的pyalgotrade.bar.Bar或者如果未找到该工具则返回 None。
dataseries – 基本数据系列类
原文:
gbeced.github.io/pyalgotrade/docs/v0.20/html/dataseries.html
数据系列是用于管理时间序列数据的抽象。
class pyalgotrade.dataseries.``DataSeries
基类:object
数据系列的基类。
注意
这是一个基类,不应直接使用。
__getitem__(key)
返回给定位置/切片的值。如果位置无效,则引发 IndexError,如果键类型无效,则引发 TypeError。
__len__()
返回数据系列中的元素数量。
getDateTimes()
返回与每个值关联的 datetime.datetime 列表。
class pyalgotrade.dataseries.``SequenceDataSeries(maxLen=None)
基类:pyalgotrade.dataseries.DataSeries
一个在内存中按顺序保存值的 DataSeries。
参数: | maxLen (int.) – 要保存的最大值数量。一旦有界长度已满,当添加新项时,将从相反端丢弃相应数量的项。如果为 None,则使用 dataseries.DEFAULT_MAX_LEN。 |
|---|
append(value)
追加一个值。
appendWithDateTime(dateTime, value)
追加一个带有关联日期时间的值。
注意
如果 dateTime 不为 None,则必须大于最后一个。
getMaxLen()
返回要保存的最大值数量。
setMaxLen(maxLen)
设置要保存的最大值数量,并在必要时调整大小。
pyalgotrade.dataseries.aligned.``datetime_aligned(ds1, ds2, maxLen=None)
返回两个 DataSeries,其中仅包含两个 DataSeries 中都存在的日期时间的值。
参数: |
|---|
- ds1 (
DataSeries.) – 一个 DataSeries 实例。 - ds2 (
DataSeries.) – 一个 DataSeries 实例。 - maxLen (int.) – 返回的
DataSeries可以容纳的最大值数量。一旦有界长度已满,当添加新项时,将从相反端丢弃相应数量的项。如果为 None,则使用 dataseries.DEFAULT_MAX_LEN。
|
class pyalgotrade.dataseries.bards.``BarDataSeries(maxLen=None)
基类:pyalgotrade.dataseries.SequenceDataSeries
一个由 pyalgotrade.bar.Bar 实例组成的 DataSeries。
参数: | maxLen (int.) – 要保存的最大值数量。一旦有界长度已满,当添加新项时,将从相反端丢弃相应数量的项。如果为 None,则使用 dataseries.DEFAULT_MAX_LEN。 |
|---|
getAdjCloseDataSeries()
返回一个具有调整后的收盘价格的 pyalgotrade.dataseries.DataSeries。
getCloseDataSeries()
返回一个pyalgotrade.dataseries.DataSeries,其中包含收盘价格。
getExtraDataSeries(name)
返回一个pyalgotrade.dataseries.DataSeries,用于额外的列。
getHighDataSeries()
返回一个pyalgotrade.dataseries.DataSeries,其中包含最高价格。
getLowDataSeries()
返回一个pyalgotrade.dataseries.DataSeries,其中包含最低价格。
getOpenDataSeries()
返回一个pyalgotrade.dataseries.DataSeries,其中包含开盘价格。
getPriceDataSeries()
返回一个pyalgotrade.dataseries.DataSeries,其中包含收盘或调整后的收盘价格。
getVolumeDataSeries()
返回一个pyalgotrade.dataseries.DataSeries,其中包含交易量。
class pyalgotrade.dataseries.resampled. ResampledBarDataSeries(dataSeries,frequency,maxLen=None)
基础:pyalgotrade.dataseries.bards.BarDataSeries,pyalgotrade.dataseries.resampled.DSResampler
一个 BarDataSeries,将建立在另一个更高频率的 BarDataSeries 之上。随着新值被推送到被重新采样的数据系列中,重新采样将会发生。
参数: |
|---|
- dataSeries(
pyalgotrade.dataseries.bards.BarDataSeries) - 正在重新采样的 DataSeries 实例。 - frequency - 以秒为单位的分组频率。必须大于 0。
- maxLen(int.) - 最大保存值的数量。一旦有限长度已满,当添加新项目时,将从另一端丢弃相应数量的项目。
|
注:
- 支持的重新采样频率包括:
- 小于 bar.Frequency.DAY
- bar.Frequency.DAY
- bar.Frequency.MONTH
checkNow(dateTime)
强制进行重新采样检查。根据重新采样频率和当前日期时间,可能会生成一个新值。
参数: | dateTime(datetime.datetime) - 当前日期时间。 |
|---|
数据源 - 基本数据源
数据源是提供抽象的时间序列数据。当这些数据源包含在事件分派循环中时,它们会在新数据可用时发出事件。数据源还负责更新与数据源提供的每个数据相关联的pyalgotrade.dataseries.DataSeries。
该软件包具有基本数据源。有关 K 线数据源,请参阅 barfeed – K 线数据源 部分。
class pyalgotrade.feed.``BaseFeed(maxLen)
基类:pyalgotrade.observer.Subject
数据源的基类。
参数: | maxLen (int.) – 每个pyalgotrade.dataseries.DataSeries将保留的最大值数量。一旦有界长度已满,当添加新项目时,相应数量的项目将从另一端丢弃。 |
|---|
注
这是一个基类,不应直接使用。
__contains__(key)
如果给定键的pyalgotrade.dataseries.DataSeries可用,则返回 True。
__getitem__(key)
返回给定键的pyalgotrade.dataseries.DataSeries。
getNewValuesEvent()
返回在新值可用时将发出的事件。要订阅,您需要传入一个可调用对象,该对象接收两个参数:
- 一个
datetime.datetime实例。 - 新值。
CSV 支持
class pyalgotrade.feed.csvfeed.``Feed(dateTimeColumn, dateTimeFormat, converter=None, delimiter=', ', timezone=None, maxLen=None)
基类:pyalgotrade.feed.csvfeed.BaseFeed
一个从 CSV 格式文件加载值的数据源。
参数: |
|---|
- dateTimeColumn (string.) – 具有日期时间信息的列的名称。
- dateTimeFormat (string.) – 日期时间格式。将使用 datetime.datetime.strptime 来解析列。
- converter (function.) – 具有两个参数(列名和值)的函数,用于将字符串值转换为其他值。默认转换器将尝试将值转换为浮点数。如果失败,则返回原始字符串。
- delimiter (string.) – 用于分隔值的字符串。
- timezone (一个 pytz 时区.) – 用于本地化日期时间的时区。检查
pyalgotrade.marketsession。 - maxLen (int.) – 每个
pyalgotrade.dataseries.DataSeries将保存的值的最大数量。一旦有界长度已满,当添加新项时,相应数量的项将从另一端丢弃。如果为 None,则使用 dataseries.DEFAULT_MAX_LEN。
addValuesFromCSV(path)
从文件中加载值。
参数: | path (string.) – CSV 文件的路径。 |
|---|
CSV 支持示例
以下是格式如下的文件
Date,USD,GBP,EUR
2013-09-29,1333.0,831.203,986.75
2013-09-22,1349.25,842.755,997.671
2013-09-15,1318.5,831.546,993.969
2013-09-08,1387.0,886.885,1052.911
.
.
.
可以这样加载:
from __future__ import print_function

from pyalgotrade.feed import csvfeed

feed = csvfeed.Feed("Date", "%Y-%m-%d")
feed.addValuesFromCSV("quandl_gold_2.csv")
for dateTime, value in feed:
    print(dateTime, value)
输出应该是这样的:
1968-04-07 00:00:00 {'USD': 37.0, 'GBP': 15.3875, 'EUR': ''}
1968-04-14 00:00:00 {'USD': 38.0, 'GBP': 15.8208, 'EUR': ''}
1968-04-21 00:00:00 {'USD': 37.65, 'GBP': 15.6833, 'EUR': ''}
1968-04-28 00:00:00 {'USD': 38.65, 'GBP': 16.1271, 'EUR': ''}
1968-05-05 00:00:00 {'USD': 39.1, 'GBP': 16.3188, 'EUR': ''}
1968-05-12 00:00:00 {'USD': 39.6, 'GBP': 16.5625, 'EUR': ''}
1968-05-19 00:00:00 {'USD': 41.5, 'GBP': 17.3958, 'EUR': ''}
1968-05-26 00:00:00 {'USD': 41.75, 'GBP': 17.5104, 'EUR': ''}
1968-06-02 00:00:00 {'USD': 41.95, 'GBP': 17.6, 'EUR': ''}
1968-06-09 00:00:00 {'USD': 41.25, 'GBP': 17.3042, 'EUR': ''}
.
.
.
2013-07-28 00:00:00 {'USD': 1331.0, 'GBP': 864.23, 'EUR': 1001.505}
2013-08-04 00:00:00 {'USD': 1309.25, 'GBP': 858.637, 'EUR': 986.921}
2013-08-11 00:00:00 {'USD': 1309.0, 'GBP': 843.156, 'EUR': 979.79}
2013-08-18 00:00:00 {'USD': 1369.25, 'GBP': 875.424, 'EUR': 1024.964}
2013-08-25 00:00:00 {'USD': 1377.5, 'GBP': 885.738, 'EUR': 1030.6}
2013-09-01 00:00:00 {'USD': 1394.75, 'GBP': 901.292, 'EUR': 1055.749}
2013-09-08 00:00:00 {'USD': 1387.0, 'GBP': 886.885, 'EUR': 1052.911}
2013-09-15 00:00:00 {'USD': 1318.5, 'GBP': 831.546, 'EUR': 993.969}
2013-09-22 00:00:00 {'USD': 1349.25, 'GBP': 842.755, 'EUR': 997.671}
2013-09-29 00:00:00 {'USD': 1333.0, 'GBP': 831.203, 'EUR': 986.75}
目录
- feed – 基本 feeds
- CSV 支持
- CSV 支持示例
barfeed – 条形提供者
原文:
gbeced.github.io/pyalgotrade/docs/v0.20/html/barfeed.html
class pyalgotrade.barfeed. BaseBarFeed(frequency, maxLen=None)
基类:pyalgotrade.feed.BaseFeed
提供源的 pyalgotrade.bar.Bar 的基类。
参数: |
|---|
- frequency – 条的频率。在
pyalgotrade.bar.Frequency中定义的有效值。 - maxLen (int.) –
pyalgotrade.dataseries.bards.BarDataSeries将保存的值的最大数量。一旦有限长度满了,当添加新项目时,相应数量的项目将从对立端丢弃。如果为 None,则使用 dataseries.DEFAULT_MAX_LEN。
注
这是一个基类,不应直接使用。
getNextBars()
重写以返回源中的下一个 pyalgotrade.bar.Bars ,如果没有条则返回 None。
注
这是给 BaseBarFeed 子类的,不应直接调用。
getCurrentBars()
返回当前的pyalgotrade.bar.Bars。
getLastBar(instrument)
返回给定仪器的最后一个 pyalgotrade.bar.Bar ,或 None。
getDefaultInstrument()
返回最后一个注册的仪器。
getRegisteredInstruments()
返回注册的仪器名称列表。
getDataSeries(instrument=None)
返回给定仪器的 pyalgotrade.dataseries.bards.BarDataSeries。
参数: | instrument (string.) – 仪器标识符。如果为 None,则返回默认仪器。 |
|---|---|
返回类型: | pyalgotrade.dataseries.bards.BarDataSeries。 |
CSV
class pyalgotrade.barfeed.csvfeed. BarFeed(frequency, maxLen=None)
基类:pyalgotrade.barfeed.membf.BarFeed
基类为基于 CSV 文件的 pyalgotrade.barfeed.BarFeed。
注
这是一个基类,不应直接使用。
class pyalgotrade.barfeed.csvfeed. GenericBarFeed(frequency, timezone=None, maxLen=None)
基类:pyalgotrade.barfeed.csvfeed.BarFeed
一个从 CSV 文件加载条的 BarFeed,格式如下:
Date Time,Open,High,Low,Close,Volume,Adj Close
2013-01-01 13:59:00,13.51001,13.56,13.51,13.56,273.88014126,13.51001
参数: |
|---|
- frequency – 条的频率。检查
pyalgotrade.bar.Frequency。 - timezone (A pytz timezone.) – 用于本地化条形图的默认时区。请检查
pyalgotrade.marketsession。 - maxLen (int.) –
pyalgotrade.dataseries.bards.BarDataSeries将保存的值的最大数量。一旦有界长度满了,当添加新项时,相应数量的项将从另一端丢弃。如果为 None,则使用 dataseries.DEFAULT_MAX_LEN。
注意
- CSV 文件必须在第一行中具有列名。
- 如果Adj Close列为空,也没关系。
- 当使用多个工具时:
- 如果加载的所有工具都位于相同的时区,则可能不需要指定时区参数。
- 如果加载的任何工具位于不同的时区,则应设置时区参数。
addBarsFromCSV(instrument, path, timezone=None, skipMalformedBars=False)
从 CSV 格式文件中加载给定工具的条形图。该工具将在条形图数据源中注册。
参数: |
|---|
- instrument (string.) – 工具标识符。
- path (string.) – CSV 文件的路径。
- timezone (A pytz timezone.) – 用于本地化条形图的时区。请检查
pyalgotrade.marketsession。 - skipMalformedBars (boolean.) – 设置为 True 以跳过解析条形图时的错误。
|
setDateTimeFormat(dateTimeFormat)
设置要与 strptime 一起使用的格式字符串以解析日期时间列。## 雅虎财经
class pyalgotrade.barfeed.yahoofeed.``Feed(frequency=86400, timezone=None, maxLen=None)
基类:pyalgotrade.barfeed.csvfeed.BarFeed
从从雅虎财经下载的 CSV 文件中加载条形图的pyalgotrade.barfeed.csvfeed.BarFeed。
参数: |
|---|
- frequency – 条形图的频率。仅支持 pyalgotrade.bar.Frequency.DAY 或 pyalgotrade.bar.Frequency.WEEK。
- timezone (A pytz timezone.) – 用于本地化条形图的默认时区。请检查
pyalgotrade.marketsession。 - maxLen (int.) –
pyalgotrade.dataseries.bards.BarDataSeries将保存的值的最大数量。一旦有界长度满了,当添加新项时,相应数量的项将从另一端丢弃。如果为 None,则使用 dataseries.DEFAULT_MAX_LEN。
|
注意
雅虎财经 CSV 文件缺乏时区信息。当使用多个工具时:
- 如果加载的所有仪器都在同一个时区,则可能不需要指定时区参数。
- 如果加载的任何仪器处于不同的时区,则必须设置时区参数。
addBarsFromCSV(instrument, path, timezone=None)
从 CSV 格式文件中加载给定仪器的条形图。该仪器将在条形图 feed 中注册。
参数: |
|---|
- instrument (string.) – 仪器标识符。
- path (string.) – CSV 文件的路径。
- timezone (一个 pytz 时区.) – 用于本地化条形图的时区。查看
pyalgotrade.marketsession。
| ## Google Finance
class pyalgotrade.barfeed.googlefeed.``Feed(frequency=86400, timezone=None, maxLen=None)
Bases: pyalgotrade.barfeed.csvfeed.BarFeed
从 Google Finance 下载的 CSV 文件加载条形图的pyalgotrade.barfeed.csvfeed.BarFeed。
参数: |
|---|
- frequency – 条形图的频率。目前仅支持pyalgotrade.bar.Frequency.DAY。
- timezone (一个 pytz 时区.) – 用于本地化条形图的默认时区。查看
pyalgotrade.marketsession。 - maxLen (int.) –
pyalgotrade.dataseries.bards.BarDataSeries将保存的值的最大数量。一旦达到有界长度,当添加新项时,相应数量的项将从另一端丢弃。如果为 None,则使用 dataseries.DEFAULT_MAX_LEN。
|
注意
Google Finance csv 文件缺少时区信息。在处理多个仪器时
- 如果加载的所有仪器都在同一个时区,则可能不需要指定时区参数。
- 如果加载的任何仪器处于不同的时区,则必须设置时区参数。
addBarsFromCSV(instrument, path, timezone=None, skipMalformedBars=False)
从 CSV 格式文件中加载给定仪器的条形图。该仪器将在条形图 feed 中注册。
参数: |
|---|
- instrument (string.) – 仪器标识符。
- path (string.) – CSV 文件的路径。
- timezone (一个 pytz 时区.) – 用于本地化条形图的时区。查看
pyalgotrade.marketsession。 - skipMalformedBars (boolean.) – 如果在解析条形图时跳过错误,则为 True。
| ## Quandl
class pyalgotrade.barfeed.quandlfeed.``Feed(frequency=86400, timezone=None, maxLen=None)
Bases: pyalgotrade.barfeed.csvfeed.GenericBarFeed
从 Quandl 下载的 CSV 文件加载 bars 的 pyalgotrade.barfeed.csvfeed.BarFeed。
参数: |
|---|
- frequency – bars 的频率。仅支持 pyalgotrade.bar.Frequency.DAY 或 pyalgotrade.bar.Frequency.WEEK。
- timezone(一个 pytz 时区。)– 用于本地化 bars 的默认时区。请查看
pyalgotrade.marketsession。 - maxLen(整数。)–
pyalgotrade.dataseries.bards.BarDataSeries将保存的值的最大数量。一旦有限长度满了,当添加新项时,将从另一端丢弃相应数量的项。如果为 None,则使用 dataseries.DEFAULT_MAX_LEN。
注意
在处理多个仪器时:
- 如果加载的所有仪器都位于同一时区,则可能不需要指定时区参数。
- 如果加载的任何仪器位于不同的时区,则必须设置时区参数。 ## Ninja Trader
类 pyalgotrade.barfeed.ninjatraderfeed. Feed(frequency,timezone=None,maxLen=None)
基类:pyalgotrade.barfeed.csvfeed.BarFeed
一个从 NinjaTrader 导出的 CSV 文件加载 bars 的 pyalgotrade.barfeed.csvfeed.BarFeed。
参数: |
|---|
- frequency – bars 的频率。仅支持 pyalgotrade.bar.Frequency.MINUTE 或 pyalgotrade.bar.Frequency.DAY。
- timezone(一个 pytz 时区。)– 用于本地化 bars 的默认时区。请查看
pyalgotrade.marketsession。 - maxLen(整数。)–
pyalgotrade.dataseries.bards.BarDataSeries将保存的值的最大数量。一旦有限长度满了,当添加新项时,将从另一端丢弃相应数量的项。如果为 None,则使用 dataseries.DEFAULT_MAX_LEN。
addBarsFromCSV(instrument,path,timezone=None)
从 CSV 格式文件加载给定仪器的 bars。该仪器将在 bar feed 中注册。
参数: |
|---|
- instrument(字符串。)– 仪器标识符。
- path(字符串。)– 文件的路径。
- timezone(一个 pytz 时区。)– 用于本地化 bars 的时区。请查看
pyalgotrade.marketsession。
目录
- barfeed – Bar providers
- CSV
- Yahoo! Finance
- 谷歌财经
- Quandl
- 忍者交易员
技术 - 技术指标
原文:
gbeced.github.io/pyalgotrade/docs/v0.20/html/technical.html
class pyalgotrade.technical.``EventWindow(windowSize, dtype=<type ‘float’>, skipNone=True)
基类:object
一个 EventWindow 类负责在一系列值的移动窗口上进行计算。
参数: |
|---|
- windowSize(int.) - 窗口的大小。必须大于 0。
- dtype(数据类型.) - 数组的期望数据类型。
- skipNone(布尔.) - 如果 None 值不应包含在窗口中,则为 True。
注意
这是一个基类,不应直接使用。
getValue()
重写以使用窗口中的值计算值。
getValues()
返回一个具有窗口中值的 numpy.array。
getWindowSize()
返回窗口大小。
class pyalgotrade.technical.``EventBasedFilter(dataSeries, eventWindow, maxLen=None)
基类:pyalgotrade.dataseries.SequenceDataSeries
EventBasedFilter 类负责捕获 pyalgotrade.dataseries.DataSeries 中的新值,并使用 EventWindow 计算新值。
参数: |
|---|
- dataSeries(
pyalgotrade.dataseries.DataSeries.) - 正在过滤的 DataSeries 实例。 - eventWindow(
EventWindow.) - 用于计算新值的 EventWindow 实例。 - maxLen(int.) - 要保持的最大值数。一旦有限长度已满,添加新项时,将从对端丢弃相应数量的项。如果为 None,则使用 dataseries.DEFAULT_MAX_LEN。
示例
以下示例显示如何组合 EventWindow 和 EventBasedFilter 来构建自定义过滤器:
from __future__ import print_function

from pyalgotrade import dataseries
from pyalgotrade import technical

# An EventWindow is responsible for making calculations using a window of values.
class Accumulator(technical.EventWindow):
    def getValue(self):
        ret = None
        if self.windowFull():
            ret = self.getValues().sum()
        return ret

# Build a sequence based DataSeries.
seqDS = dataseries.SequenceDataSeries()
# Wrap it with a filter that will get fed as new values get added to the underlying DataSeries.
accum = technical.EventBasedFilter(seqDS, Accumulator(3))

# Put in some values.
for i in range(0, 50):
    seqDS.append(i)

# Get some values.
print(accum[0])  # Not enough values yet.
print(accum[1])  # Not enough values yet.
print(accum[2])  # Ok, now we should have at least 3 values.
print(accum[3])

# Get the last value, which should be equal to 49 + 48 + 47.
print(accum[-1])
输出应为:
None
None
3.0
6.0
144.0
移动平均
class pyalgotrade.technical.ma.``SMA(dataSeries, period, maxLen=None)
基类:pyalgotrade.technical.EventBasedFilter
简单移动平均滤波器。
参数: |
|---|
- dataSeries(
pyalgotrade.dataseries.DataSeries.) - 正在过滤的 DataSeries 实例。 - period(int.) - 用于计算 SMA 的值数。
- maxLen (int.) – 持有的值的最大数量。一旦有限长度满了,当添加新项时,相应数量的项将从相反端丢弃。如果为 None,则使用 dataseries.DEFAULT_MAX_LEN。
类 pyalgotrade.technical.ma.``EMA(dataSeries, period, maxLen=None)
基类: pyalgotrade.technical.EventBasedFilter
指数移动平均过滤器。
参数: |
|---|
- dataSeries (
pyalgotrade.dataseries.DataSeries.) – 正在被过滤的 DataSeries 实例。 - period (int.) – 用于计算 EMA 的值的数量。必须是大于 1 的整数。
- maxLen (int.) – 持有的值的最大数量。一旦有限长度满了,当添加新项时,相应数量的项将从相反端丢弃。如果为 None,则使用 dataseries.DEFAULT_MAX_LEN。
类 pyalgotrade.technical.ma.``WMA(dataSeries, weights, maxLen=None)
基类: pyalgotrade.technical.EventBasedFilter
加权移动平均过滤器。
参数: |
|---|
- dataSeries (
pyalgotrade.dataseries.DataSeries.) – 正在被过滤的 DataSeries 实例。 - weights (list.) – 一个具有权重的 int/float 列表。
- maxLen (int.) – 持有的值的最大数量。一旦有限长度满了,当添加新项时,相应数量的项将从相反端丢弃。如果为 None,则使用 dataseries.DEFAULT_MAX_LEN。
类 pyalgotrade.technical.vwap.``VWAP(dataSeries, period, useTypicalPrice=False, maxLen=None)
基类: pyalgotrade.technical.EventBasedFilter
成交量加权平均价格过滤器。
参数: |
|---|
- dataSeries (
pyalgotrade.dataseries.bards.BarDataSeries.) – 正在被过滤的 DataSeries 实例。 - period (int.) – 用于计算 VWAP 的值的数量。
- useTypicalPrice (boolean.) – 如果应该使用典型价格而不是收盘价格,则为 True。
- maxLen (int.) – 持有的值的最大数量。一旦有限长度满了,当添加新项时,相应数量的项将从相反端丢弃。如果为 None,则使用 dataseries.DEFAULT_MAX_LEN。
| ## 动量指标
类 pyalgotrade.technical.macd.``MACD(dataSeries, fastEMA, slowEMA, signalEMA, maxLen=None)
基类: pyalgotrade.dataseries.SequenceDataSeries
按照stockcharts.com/school/doku.php?id=chart_school:technical_indicators:moving_average_convergence_divergence_macd中描述的移动平均收敛-背离指标。
参数: |
|---|
- dataSeries(
pyalgotrade.dataseries.DataSeries) - 正在被过滤的 DataSeries 实例。 - fastEMA(整数) - 用于计算快速 EMA 的数值数量。
- slowEMA(整数) - 用于计算慢速 EMA 的数值数量。
- signalEMA(整数) - 用于计算信号 EMA 的数值数量。
- maxLen(整数) - 要保留的最大数值数量。一旦有界长度已满,当添加新项目时,将从相反端丢弃相应数量的项目。如果为 None,则使用 dataseries.DEFAULT_MAX_LEN。
|
getHistogram()
返回一个带有直方图(MACD 和信号之间的差异)的pyalgotrade.dataseries.DataSeries。
getSignal()
返回一个带有 MACD 上的 EMA 的pyalgotrade.dataseries.DataSeries。
类 pyalgotrade.technical.rsi.``RSI(dataSeries, 周期, maxLen=None)
基类:pyalgotrade.technical.EventBasedFilter
按照stockcharts.com/school/doku.php?id=chart_school:technical_indicators:relative_strength_index_rsi中描述的相对强度指数过滤器。
参数: |
|---|
- dataSeries(
pyalgotrade.dataseries.DataSeries) - 正在被过滤的 DataSeries 实例。 - period(整数) - 周期。请注意,如果周期是n,则使用n+1个值。必须大于 1。
- maxLen(整数) - 要保留的最大数值数量。一旦有界长度已满,当添加新项目时,将从相反端丢弃相应数量的项目。如果为 None,则使用 dataseries.DEFAULT_MAX_LEN。
|
类 pyalgotrade.technical.stoch.``StochasticOscillator(barDataSeries, 周期, dSMAPeriod=3, useAdjustedValues=False, maxLen=None)
基类:pyalgotrade.technical.EventBasedFilter
根据 stockcharts.com/school/doku.php?st=stochastic+oscillator&id=chart_school:technical_indicators:stochastic_oscillator_fast_slow_and_full 描述的快速随机振荡器过滤器。注意,此过滤器返回的值是 %K。要访问 %D,请使用 getD()。
参数: |
|---|
- barDataSeries (
pyalgotrade.dataseries.bards.BarDataSeries.) – 正在过滤的 BarDataSeries 实例。 - period (int.) – 期间。必须 > 1。
- dSMAPeriod (int.) – %D 的 SMA 周期。必须 > 1。
- useAdjustedValues (boolean.) – True 表示使用调整后的 Low/High/Close 值。
- maxLen (int.) – 持有的最大值数量。一旦有界长度满了,当添加新项时,相应数量的项将从另一端丢弃。如果为 None,则使用 dataseries.DEFAULT_MAX_LEN。
|
getD()
返回一个 pyalgotrade.dataseries.DataSeries,其中包含 %D 值。
class pyalgotrade.technical.roc.``RateOfChange(dataSeries, valuesAgo, maxLen=None)
基础: pyalgotrade.technical.EventBasedFilter
根据 stockcharts.com/school/doku.php?id=chart_school:technical_indicators:rate_of_change_roc_and_momentum 描述的变化率过滤器。
参数: |
|---|
- dataSeries (
pyalgotrade.dataseries.DataSeries.) – 正在过滤的 DataSeries 实例。 - valuesAgo (int.) – 给定值与之比较的值的数量。必须 > 0。
- maxLen (int.) – 持有的最大值数量。一旦有界长度满了,当添加新项时,相应数量的项将从另一端丢弃。如果为 None,则使用 dataseries.DEFAULT_MAX_LEN。
| ## 其他指
class pyalgotrade.technical.atr.``ATR(barDataSeries, period, useAdjustedValues=False, maxLen=None)
基础: pyalgotrade.technical.EventBasedFilter
基于 stockcharts.com/school/doku.php?id=chart_school:technical_indicators:average_true_range_atr 描述的平均真实范围过滤器
参数: |
|---|
- barDataSeries (
pyalgotrade.dataseries.bards.BarDataSeries.) – 正在过滤的 BarDataSeries 实例。 - period (整数.) – 平均周期。必须 > 1。
- useAdjustedValues (布尔值.) – True 表示使用调整后的低/高/收盘价值。
- maxLen (整数.) – 持有的最大值数。一旦有界长度已满,当添加新项目时,相应数量的项目将从另一端丢弃。如果为 None,则使用 dataseries.DEFAULT_MAX_LEN。
|
类 pyalgotrade.technical.bollinger.``BollingerBands(dataSeries, period, numStdDev, maxLen=None)
基类: object
Bollinger Bands 过滤器如 stockcharts.com/school/doku.php?id=chart_school:technical_indicators:bollinger_bands 描述的那样。
参数: |
|---|
- dataSeries (
pyalgotrade.dataseries.DataSeries.) – 正在过滤的 DataSeries 实例。 - period (整数.) – 用于计算的值的数量。必须 > 1。
- numStdDev (整数.) – 用于上部和下部带的标准偏差数量。
- maxLen (整数.) – 持有的最大值数。一旦有界长度已满,当添加新项目时,相应数量的项目将从另一端丢弃。如果为 None,则使用 dataseries.DEFAULT_MAX_LEN。
|
getLowerBand()
返回下部带作为pyalgotrade.dataseries.DataSeries。
getMiddleBand()
返回中间带作为pyalgotrade.dataseries.DataSeries。
getUpperBand()
返回上部带作为pyalgotrade.dataseries.DataSeries。
pyalgotrade.technical.cross.``cross_above(values1, values2, start=-2, end=None)
在两个 DataSeries 对象之间的指定周期内检查交叉条件。
它返回在给定周期内 values1 跨过 values2 的次数。
参数: |
|---|
- values1 (
pyalgotrade.dataseries.DataSeries.) – 跨过的 DataSeries。 - values2 (
pyalgotrade.dataseries.DataSeries.) – 被跨越的 DataSeries。 - start (整数.) – 范围的开始。
- end (整数.) – 范围的结束。
|
注意
默认的开始和结束值检查最后 2 个值的交叉条件。
pyalgotrade.technical.cross.``cross_below(values1, values2, start=-2, end=None)
检查两个 DataSeries 对象之间指定期间内的交叉下方条件。
它返回给定期间内 values1 下方交叉 values2 的次数。
参数: |
|---|
- values1(
pyalgotrade.dataseries.DataSeries.)- 进行交叉的 DataSeries。 - values2(
pyalgotrade.dataseries.DataSeries.)- 被交叉的 DataSeries。 - start(int.)- 范围的开始。
- end(int.)- 范围的结束。
|
注意
默认的开始和结束值检查最近 2 个值的交叉下方条件。
类 pyalgotrade.technical.cumret.``CumulativeReturn(dataSeries,maxLen=None)
基类:pyalgotrade.technical.EventBasedFilter
此过滤器计算另一个数据序列上的累积收益。
参数: |
|---|
- dataSeries(
pyalgotrade.dataseries.DataSeries.)- 被过滤的 DataSeries 实例。 - maxLen(int.)- 最多要保留的值数。一旦有限长度已满,当添加新项时,相应数量的项将从另一端丢弃。如果为 None,则使用 dataseries.DEFAULT_MAX_LEN。
|
类 pyalgotrade.technical.highlow.``High(dataSeries,period,maxLen=None)
基类:pyalgotrade.technical.EventBasedFilter
此过滤器计算最高值。
参数: |
|---|
- dataSeries(
pyalgotrade.dataseries.DataSeries.)- 被过滤的 DataSeries 实例。 - period(int.)- 用于计算最高值的数值数量。
- maxLen(int.)- 最多要保留的值数。一旦有限长度已满,当添加新项时,相应数量的项将从另一端丢弃。如果为 None,则使用 dataseries.DEFAULT_MAX_LEN。
|
类 pyalgotrade.technical.highlow.``Low(dataSeries,period,maxLen=None)
基类:pyalgotrade.technical.EventBasedFilter
此过滤器计算最低值。
参数: |
|---|
- dataSeries(
pyalgotrade.dataseries.DataSeries.)- 被过滤的 DataSeries 实例。 - period(int.)- 用于计算最低值的数值数量。
- maxLen(int.)- 最多要保留的值数。一旦有限长度已满,当添加新项时,相应数量的项将从另一端丢弃。如果为 None,则使用 dataseries.DEFAULT_MAX_LEN。
|
类 pyalgotrade.technical.hurst.``HurstExponent(dataSeries, period, minLags=2, maxLags=20, logValues=True, maxLen=None)
基类:pyalgotrade.technical.EventBasedFilter
赫斯特指数过滤器。
参数: |
|---|
- dataSeries (
pyalgotrade.dataseries.DataSeries.) – 正在过滤的 DataSeries 实例。 - period (int.) – 用于计算赫斯特指数的值数量。
- minLags (int.) – 要使用的最小滞后数。必须 >= 2。
- maxLags (int.) – 要使用的最大滞后数。必须 > minLags。
- maxLen (int.) – 保持的最大值数量。一旦有界长度已满,当添加新项目时,相应数量的项目将从对端丢弃。如果为 None,则使用 dataseries.DEFAULT_MAX_LEN。
|
类 pyalgotrade.technical.linebreak.``Line(low, high, dateTime, white)
基类:object
线性断裂图表中的一条线。
getDateTime()
日期时间。
getHigh()
高值。
getLow()
低值。
isBlack()
如果线是黑色的(价格下跌),则为 True。
isWhite()
如果线是白色的(价格上涨),则为 True。
类 pyalgotrade.technical.linebreak.``LineBreak(barDataSeries, reversalLines, useAdjustedValues=False, maxLen=None)
基类:pyalgotrade.dataseries.SequenceDataSeries
描述了线性断裂过滤器。这是一个Line实例的 DataSeries。
参数: |
|---|
- barDataSeries (
pyalgotrade.dataseries.bards.BarDataSeries.) – 正在过滤的 DataSeries 实例。 - reversalLines (int.) – 要检查以计算反转的线数。必须大于 1。
- useAdjustedValues (boolean.) – True 表示使用调整后的高/低/收盘价值。
- maxLen (int.) – 保持的最大值数量。一旦有界长度已满,当添加新项目时,相应数量的项目将从对端丢弃。如果为 None,则使用 dataseries.DEFAULT_MAX_LEN。此值不能小于 reversalLines。
|
类 pyalgotrade.technical.linreg.``LeastSquaresRegression(dataSeries, windowSize, maxLen=None)
基类:pyalgotrade.technical.EventBasedFilter
根据最小二乘法回归计算值。
参数: |
|---|
- dataSeries(
pyalgotrade.dataseries.DataSeries.)– 要过滤的 DataSeries 实例。 - windowSize(int.)– 用于计算回归的值的数量。
- maxLen(int.)– 要保持的最大值数量。一旦有限长度已满,当添加新项时,相应数量的项将从相反端丢弃。如果为 None,则使用 dataseries.DEFAULT_MAX_LEN。
|
getValueAt(dateTime)
根据回归线在给定时间计算值。
参数: | dateTime(datetime.datetime.)– 要计算值的日期时间。如果基础 DataSeries 中的值不足,则返回 None。 |
|---|
class pyalgotrade.technical.linreg.``Slope(dataSeries, period, maxLen=None)
基类:pyalgotrade.technical.EventBasedFilter
斜率过滤器计算最小二乘回归线的斜率。
参数: |
|---|
- dataSeries(
pyalgotrade.dataseries.DataSeries.)– 要过滤的 DataSeries 实例。 - period(int.)– 用于计算斜率的值数量。
- maxLen(int.)– 要保持的最大值数量。一旦有限长度已满,当添加新项时,相应数量的项将从相反端丢弃。如果为 None,则使用 dataseries.DEFAULT_MAX_LEN。
|
注意
此过滤器忽略了不同值之间经过的时间。
class pyalgotrade.technical.stats.``StdDev(dataSeries, period, ddof=0, maxLen=None)
基类:pyalgotrade.technical.EventBasedFilter
标准差过滤器。
参数: |
|---|
- dataSeries(
pyalgotrade.dataseries.DataSeries.)– 要过滤的 DataSeries 实例。 - period(int.)– 用于计算标准差的值数量。
- ddof(int.)– Delta 自由度。
- maxLen(int.)– 要保持的最大值数量。一旦有限长度已满,当添加新项时,相应数量的项将从相反端丢弃。如果为 None,则使用 dataseries.DEFAULT_MAX_LEN。
class pyalgotrade.technical.stats.``ZScore(dataSeries, period, ddof=0, maxLen=None)
基类:pyalgotrade.technical.EventBasedFilter
Z-Score 过滤器。
参数: |
|---|
- dataSeries(
pyalgotrade.dataseries.DataSeries.)– 要过滤的 DataSeries 实例。 - period(int.)– 用于计算 Z-Score 的值数量。
- ddof (int.) – 用于标准差的 delta 自由度。
- maxLen (int.) – 保持的最大值数量。一旦有限长度已满,当添加新项时,相应数量的项将从另一端丢弃。如果为 None,则使用 dataseries.DEFAULT_MAX_LEN。
目录
- 技术指标 – Technical indicators
- 示例
- 移动平均线
- 动量指标
- 其他指标