Golang性能优化工具pprof使用入门
原创

1 介绍
在Golang中,可以通过pprof工具对应于程序的运行时进行性能分析,包括CPU、内存、Goroutine等实时信息。
Golang内置了获取程序运行数据的工具,包括以下两个标准库:
- runtime/pprof: 采集工具型应用运行数据进行分析
- net/http/pprof: 采集服务型应用运行时数据进行分析
pprof开启后,每隔一段时间(10ms)就会收集当前的堆栈信息,获取各个函数占用的CPU以及内存资源,然后通过对这些采样数据进行分析,形成一个性能分析报告。性能优化主要有以下几个方面:
- CPU Profile:报告程序的CPU使用情况,按照100 Hz频率去采集应用程序在CPU和寄存器上面的数据。
- Memory Profile(Heap Profile):报告程序的内存使用情况,其实就是程序运行过程中堆内存的分配情况,默认每分配512K字节时取样一次。
- Block Profiling: 报告goroutines不在运行状态的情况,保存用户程序中的Goroutine阻塞事件的记录,可以用来分析和查找死锁等性能瓶颈。
- Goroutine Profiling: 报告goroutines的使用情况,有哪些roroutines,它们的调用关系是怎样的。
默认情况下是不追踪block和mutex的信息的,如果想要看这两个信息,需要在代码中加上两行:
runtime.SetBlockProfileRate(1) // 开启对阻塞操作的跟踪,block
runtime.SetMutexProfileFraction(1) // 开启对锁调用的跟踪,mutex
引入pprof
import _ "net/http/pprof"
go func() {
http.ListenAndServe("0.0.0.0:6060", nil)
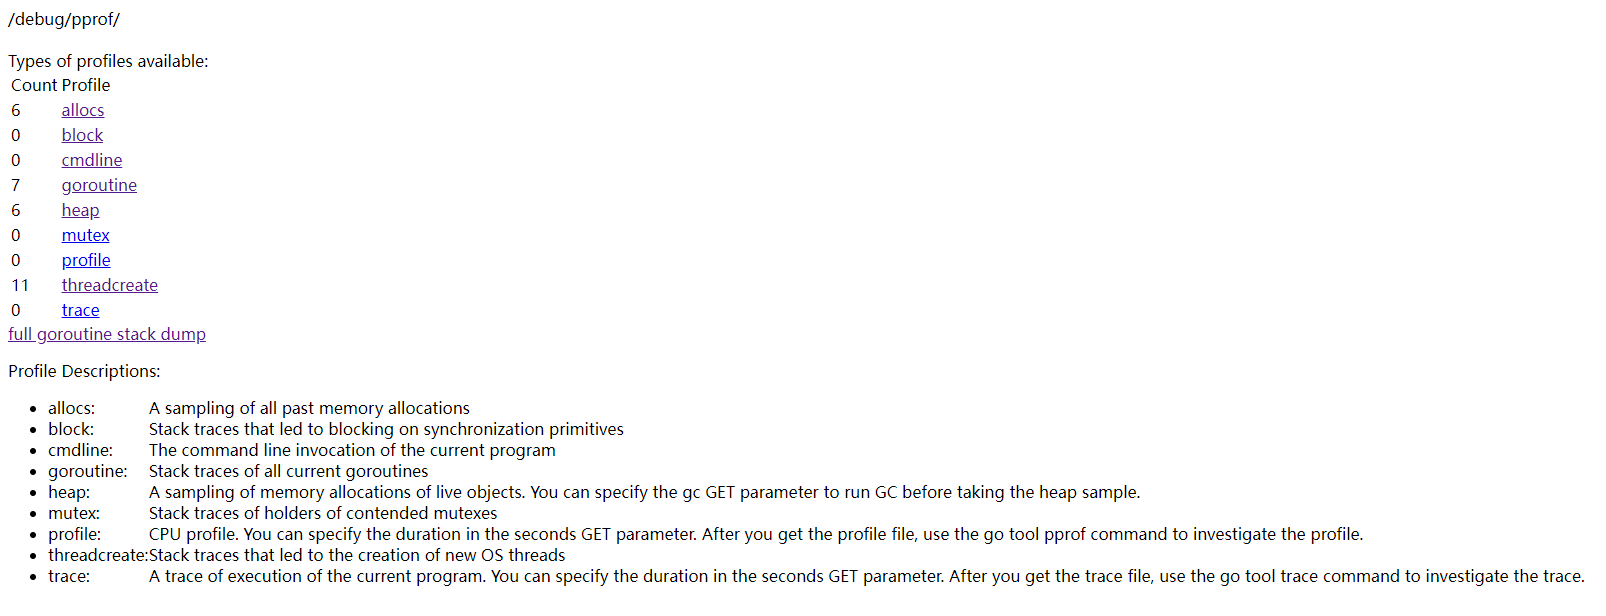
}()在浏览器中输入地址:http://127.0.0.1:6060/debug/pprof/,即可看到监控的数据。
image
profiles解释如下:
- allocs:查看过去所有内存分配的样本。
- block:查看导致阻塞同步的堆栈跟踪。
- cmdline: 当前程序的命令行的完整调用路径。
- goroutine:查看当前所有运行的 goroutines 堆栈跟踪。
- heap:查看活动对象的内存分配情况。
- mutex:查看导致互斥锁的竞争持有者的堆栈跟踪。
- profile: 默认进行 30s 的 CPU Profiling,得到一个分析用的 profile 文件。
- threadcreate:查看创建新 OS 线程的堆栈跟踪。
- trace:能够辅助我们跟踪程序的执行情况。
2 分析
线上分析用的更多的是go tool pprof,因为本地浏览器不能直接访问线上服务地址,而是通过线上服务生成分析文件,下载文件到本地进行分析,需要在本地安装graphviz工具(https://graphviz.org/download/)。
线上使用go tool pprof采集的时候可以通过加入?seconds=30参数来指定采集时间。
2.1 查看CPU使用情况
查看CPU使用率排行命令如下:
go tool pprof http://9.9.9.9:8080/debug/pprof/profile默认30秒后会进入交互模式,常见命令如下
- help可以查看使用说明
- top 可以查看前10个的CPU使用情况
- tree 以树状显示
- png 以图片格式输出
- svg 生成浏览器可以识别的svg文件
可使用top命令查看CPU使用率排行,top N显示前N个函数,默认显示10个。
go tool pprof http://9.9.9.9:8080/debug/pprof/profile
Fetching profile over HTTP from http://9.9.9.9:8080/debug/pprof/profile
Saved profile in /root/pprof/pprof.featureservice.samples.cpu.001.pb.gz
File: featureservice
Type: cpu
Time: Jul 1, 2022 at 10:29am (CST)
Duration: 30.19s, Total samples = 1.17mins (231.79%)
Entering interactive mode (type "help" for commands, "o" for options)
(pprof) top 30
Showing nodes accounting for 0.73mins, 62.18% of 1.17mins total
Dropped 661 nodes (cum <= 0.01mins)
Showing top 30 nodes out of 190
      flat  flat%   sum%        cum   cum%
  0.06mins  5.25%  5.25%   0.11mins  9.66%  github.com/valyala/bytebufferpool.(*Pool).Put
  0.05mins  4.54%  9.79%   0.06mins  4.99%  github.com/valyala/bytebufferpool.(*Pool).Get
  0.05mins  4.12% 13.91%   0.05mins  4.12%  github.com/valyala/bytebufferpool.index (inline)
  0.04mins  3.77% 17.68%   0.08mins  7.02%  runtime.mapaccess2_faststr
  0.04mins  3.49% 21.17%   0.06mins  5.26%  runtime.mapaccess2_fast64
  0.04mins  3.13% 24.30%   0.13mins 10.88%  runtime.mallocgc
  0.04mins  3.12% 27.41%   0.04mins  3.24%  syscall.Syscall
  0.04mins  3.00% 30.41%   0.17mins 14.26%  git.woa.com/judezhang/yky-feature-service/internal/featureservice/service.processModelTensorFeature
  0.03mins  2.47% 32.89%   0.03mins  2.47%  memeqbody
  0.03mins  2.22% 35.10%   0.03mins  2.22%  runtime.memhash64
  0.02mins  1.87% 36.97%   0.03mins  2.72%  runtime.mapaccess1_fast64
  0.02mins  1.84% 38.82%   0.03mins  2.32%  runtime.heapBitsSetType
  0.02mins  1.67% 40.49%   0.62mins 53.31%  git.woa.com/judezhang/yky-feature-service/internal/featureservice/service.processItemRelatedTensorFeatureOfCreativeItem
  0.02mins  1.66% 42.15%   0.02mins  1.70%  strconv.readFloat
  0.02mins  1.59% 43.73%   0.06mins  5.13%  git.woa.com/judezhang/yky-feature-service/internal/featureservice/service.ParseFloat32ByInterface
  0.02mins  1.51% 45.25%   0.04mins  3.07%  runtime.mapaccess1_faststr
  0.02mins  1.50% 46.75%   0.02mins  1.50%  runtime.futex
  0.02mins  1.50% 48.25%   0.05mins  4.69%  runtime.scanobject
  0.02mins  1.47% 49.72%   0.02mins  1.47%  runtime.memmove
  0.02mins  1.43% 51.15%   0.02mins  1.43%  runtime.nextFreeFast (inline)
  0.02mins  1.34% 52.49%   0.02mins  1.34%  aeshashbody
  0.02mins  1.33% 53.82%   0.02mins  1.33%  runtime.memclrNoHeapPointers
  0.01mins  1.14% 54.97%   0.02mins  1.31%  runtime.findObject
  0.01mins  1.10% 56.07%   0.02mins  1.37%  runtime.lock2
  0.01mins  1.09% 57.15%   0.11mins  9.70%  git.woa.com/judezhang/yky-feature-service/internal/featureservice/service.getFeatureStorageKey
  0.01mins  1.09% 58.24%   0.01mins  1.09%  strconv.special
  0.01mins  1.03% 59.27%   0.24mins 20.54%  git.woa.com/judezhang/yky-feature-service/internal/featureservice/service.getCrossFeatureFieldKey
  0.01mins  0.99% 60.25%   0.03mins  2.43%  strconv.formatBits
  0.01mins  0.97% 61.23%   0.01mins  0.99%  runtime.unlock2
  0.01mins  0.96% 62.18%   0.01mins  0.96%  strconv.ParseUint
输出内容最后一列为函数名称,其他各项内容意义如下:
- flat:当前函数占用CPU的耗时
- flat%:当前函数占用CPU的耗时百分比
- sum%:函数占用CPU的累积耗时百分比
- cum:当前函数+调用当前函数的占用CPU总耗时
- cum%:当前函数+调用当前函数的占用CPU总耗时百分比 list命令可以查看函数的cpu使用情况,形式为 list 函数名,这种需要调用源码,在线上打包后的一般看不到,本地运行可查看具体耗时情况。
(pprof) list List
Total: 140ms
ROUTINE ======================== controller/btracks.List in /Users/gyw/go/btracks.go
         0       10ms (flat, cum)  7.14% of Total
         .          .     17:   if !xc.GetReqObject(&req) {
         .          .     18:           Logger("unmarshal error")
         .          .     19:           return
         .          .     20:   }
         .          .     21:   id := xc.Request.Header.Get(def.XMidKeyName)
         .       10ms     22:   Logger(xc, "list get mid", "mid", mid)
         .          .     23:
         .          .     24:   resp, err := btrackService.List(xc, &req, mid)
         .          .     25:   if err != nil {
         .          .     26:           Logger("fail list", "err", err, "req", req, "mid", mid)
         .          .     27:           xc.Reply(lib.CodeNotExist)

(pprof)
traces命令可以调出函数的调用栈,形式为traces 函数名。
若没有安装Golang及相关工具,可以直接wget获取profile信息到文件中进行本地分析。
wget -O pprof.featureservice.profile '9.9.9.9:8080/debug/pprof/profile?seconds=30'在上述go tool pprof命令输出内容中可以看到已保存采集的信息到本地文件,/root/pprof/pprof.featureservice.samples.cpu.001.pb.gz,下载该文件到本地,运行如下命令,即可在本地启动一个web服务(监听8080端口),在浏览器可以查看更多信息。
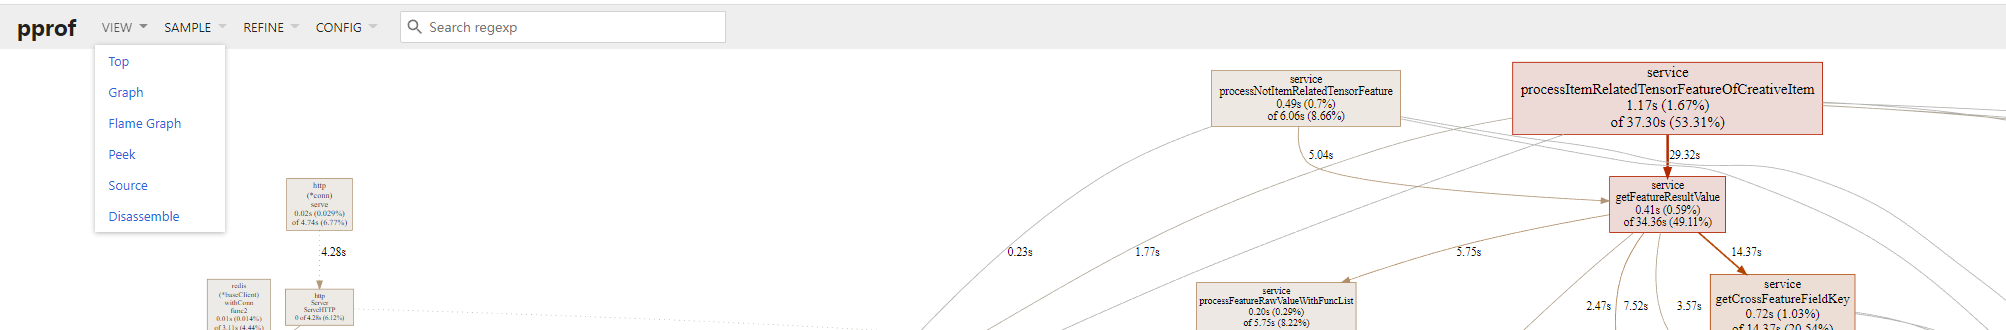
go tool pprof -http=:8080 pprof.featureservice.samples.cpu.001.pb.gz浏览器输入http://127.0.0.1:8080/ui/
image
菜单解释
- Top:类和命令行中的top命令类似
- Graph:函数调用的连线图
- Flame Graph:火焰图
- Peek:文本形式的top函数调用栈
- Source:显示top函数源码文件位置
图中的部分信息解释
- 节点的颜色越红,其cum和cum%越大。其颜色越灰白,则cum和cum%越小。
- 节点越大,其flat和flat%越大;其越小,则flat和flat%越小。
- 线条代表了函数的调用链,线条越粗,代表指向的函数消耗了越多的资源。反之亦然。
- 线条的样式代表了调用关系。实线代表直接调用;虚线代表中间少了几个节点;带有inline字段表示该函数被内联进了调用方。
Source可以列出函数调⽤的源代码,为了让该视图正确的显⽰,我们必须使⽤go tool pprof命令,⽽不能直接使⽤pprof命令,命令⾏的pprof版本有可能⽆法使源码正确的呈现出来。如果要使⽤Source视图,还需要注意将编译好的⼆进制⽂件作为参数传⼊,如:
go tool pprof -http=:8080 featureservice pprof.featureservice.samples.cpu.001.pb.gzDisassemable和Source类似,也是显⽰源代码的,但是Disassemable显⽰的是汇编语⾔。Disassemable的正确展⽰也和Source⼀样的要求。
2.2 查看内存使用情况
查看内存使用排行命令如下:
go tool pprof http://9.9.9.9:8080/debug/pprof/heap会很快进入交互模式,可使用top命令查看内存使用排行,top N显示前N个函数,默认显示10个。
go tool pprof http://9.9.9.9:8080/debug/pprof/heap
Fetching profile over HTTP from http://9.9.9.9:8080/debug/pprof/heap
Saved profile in /root/pprof/pprof.featureservice.alloc_objects.alloc_space.inuse_objects.inuse_space.001.pb.gz
File: featureservice
Type: inuse_space
Time: Jul 1, 2022 at 10:30am (CST)
Entering interactive mode (type "help" for commands, "o" for options)
(pprof) top 30
Showing nodes accounting for 235.14MB, 93.76% of 250.79MB total
Dropped 124 nodes (cum <= 1.25MB)
Showing top 30 nodes out of 203
      flat  flat%   sum%        cum   cum%
      30MB 11.96% 11.96%       30MB 11.96%  reflect.New
   20.48MB  8.17% 20.13%    20.48MB  8.17%  git.woa.com/judezhang/yky-feature-service/internal/featureservice/service.GetTensorProtoFloatSlice.func1
   18.09MB  7.21% 27.34%    18.09MB  7.21%  git.woa.com/judezhang/yky-feature-service/internal/featureservice/service.GetTensorProtoIntSlice.func1
   17.59MB  7.02% 34.36%    17.59MB  7.02%  git.code.oa.com/polaris/polaris-go/pkg/metric.NewResMetricArray (inline)
   17.52MB  6.98% 41.34%    17.52MB  6.98%  runtime.allocm
      14MB  5.58% 46.93%       14MB  5.58%  git.code.oa.com/polaris/polaris-go/pkg/metric.NewSliceWindow (inline)
   13.79MB  5.50% 52.42%    28.03MB 11.18%  git.woa.com/judezhang/yky-feature-service/internal/featureservice/service/config.updateLocalCacheLoadedFeatureCache
      10MB  3.99% 56.41%    17.50MB  6.98%  git.code.oa.com/polaris/polaris-go/pkg/metric.(*SliceWindow).initBucket
    8.63MB  3.44% 59.86%     8.63MB  3.44%  reflect.mapassign
    8.50MB  3.39% 63.24%     8.50MB  3.39%  github.com/go-redis/redis/v8/internal/proto.(*Reader).readStringReply
    7.96MB  3.17% 66.42%     7.96MB  3.17%  git.code.oa.com/polaris/polaris-go/plugin/loadbalancer/maglev.NewTable
    6.75MB  2.69% 69.11%     6.75MB  2.69%  git.woa.com/judezhang/yky-feature-service/internal/featureservice/service/config.updateLocalCacheBatchHmgetLoadedFeatureCache
    6.04MB  2.41% 71.52%     6.04MB  2.41%  bufio.NewReaderSize
    5.52MB  2.20% 73.72%     5.52MB  2.20%  bufio.NewWriterSize
    5.50MB  2.19% 75.91%     5.50MB  2.19%  git.code.oa.com/polaris/polaris-go/pkg/model/local.(*DefaultInstanceLocalValue).SetSliceWindows (inline)
    5.50MB  2.19% 78.11%     5.50MB  2.19%  git.code.oa.com/polaris/polaris-go/pkg/model/pb.NewInstanceInProto
       5MB  2.00% 80.10%    11.51MB  4.59%  git.woa.com/judezhang/yky-feature-service/internal/featureservice/service.processItemRelatedTensorFeatureOfCreativeItem
    4.54MB  1.81% 81.91%    44.12MB 17.59%  git.woa.com/judezhang/yky-feature-service/internal/featureservice/service.processModelTensorFeature
    4.50MB  1.80% 83.71%        6MB  2.39%  sync.(*Map).Store
       4MB  1.60% 85.31%        4MB  1.60%  strings.genSplit
       4MB  1.60% 86.90%        4MB  1.60%  encoding/json.(*decodeState).literalStore
       3MB  1.20% 88.10%        3MB  1.20%  git.code.oa.com/polaris/polaris-go/pkg/model/local.NewInstanceLocalValue
    2.50MB     1% 89.09%     2.50MB     1%  git.code.oa.com/polaris/polaris-go/plugin/statreporter/serviceinfo.newStatusList
    2.16MB  0.86% 89.95%     2.66MB  1.06%  google.golang.org/protobuf/proto.MarshalOptions.marshal
    1.95MB  0.78% 90.73%     2.45MB  0.98%  git.woa.com/judezhang/yky-feature-service/internal/featureservice/service.init
    1.59MB  0.63% 91.37%     1.59MB  0.63%  git.code.oa.com/polaris/polaris-go/plugin/serverconnector/grpc.NewAsyncRateLimitConnector
    1.50MB   0.6% 91.97%     1.50MB   0.6%  runtime.malg
    1.50MB   0.6% 92.56%     1.50MB   0.6%  sync.(*Map).LoadOrStore
    1.50MB   0.6% 93.16%       11MB  4.39%  git.code.oa.com/polaris/polaris-go/plugin/circuitbreaker/errorcount.(*CircuitBreaker).generateSliceWindow
    1.50MB   0.6% 93.76%     1.50MB   0.6%  reflect.cvtBytesString
在上述go tool pprof命令输出内容中可以看到已保存采集的信息到本地文件,/root/pprof/pprof.featureservice.alloc_objects.alloc_space.inuse_objects.inuse_space.001.pb.gz,下载该文件到本地,运行如下命令,即可在本地启动一个web服务(监听8080端口),在浏览器可以查看更多信息。
go tool pprof -http=:8081 pprof.featureservice.alloc_objects.alloc_space.inuse_objects.inuse_space.001.pb.gz浏览器输入http://localhost:8081/ui/
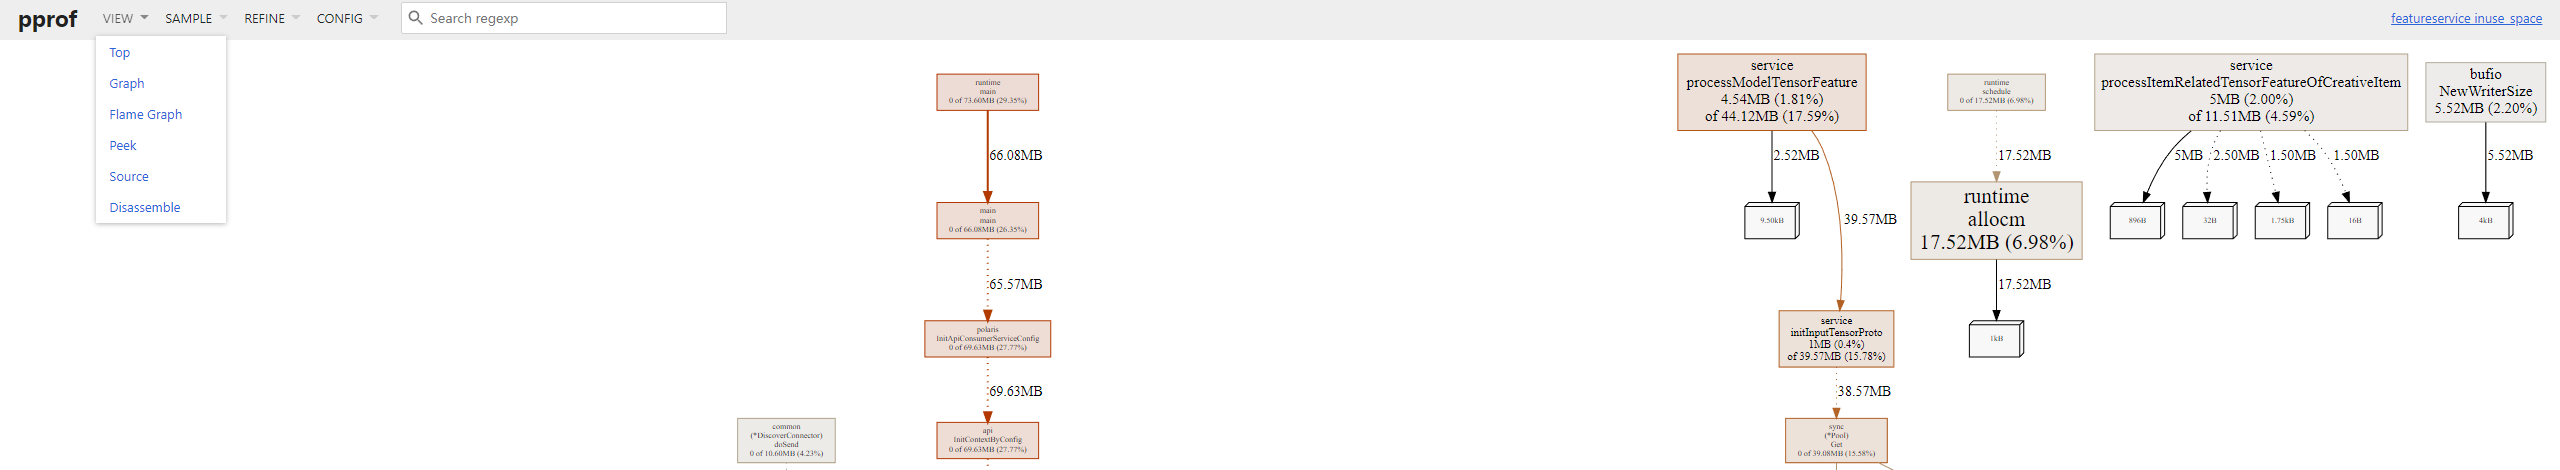
image
2.3 查看trace使用情况
查看trace命令如下:
curl http://9.9.9.9:8080/debug/pprof/trace?seconds=10 > trace.out下载该文件到本地,运行如下命令,即可在本地启动一个web服务(监听8080端口),在浏览器可以查看更多信息。
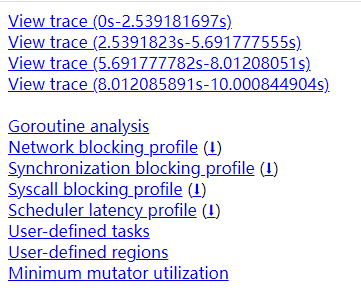
go tool trace -http=127.0.0.1:8082 trace.out打开浏览器输入http://127.0.0.1:8082/,即可看到如下信息
image
链接解释
- View trace:以图形页面的形式渲染和展示tracer的数据,这是最常用的功能。
- Goroutine analysis:以表格形式记录执行同一个函数的多个goroutine的各项trace数据
- Network blocking profile:用pprof profile形式的调用关系图展示网络I/O阻塞的情况
- Synchronization blocking profile:用pprof profile形式的调用关系图展示同步阻塞耗时情况
- Syscall blocking profile:用pprof profile形式的调用关系图展示系统调用阻塞耗时情况
- Scheduler latency profile:用pprof profile形式的调用关系图展示调度器延迟情况
- User-defined tasks和User-defined regions:用户自定义trace的task和region
- Minimum mutator utilization:分析GC对应用延迟和吞吐影响情况的曲线图
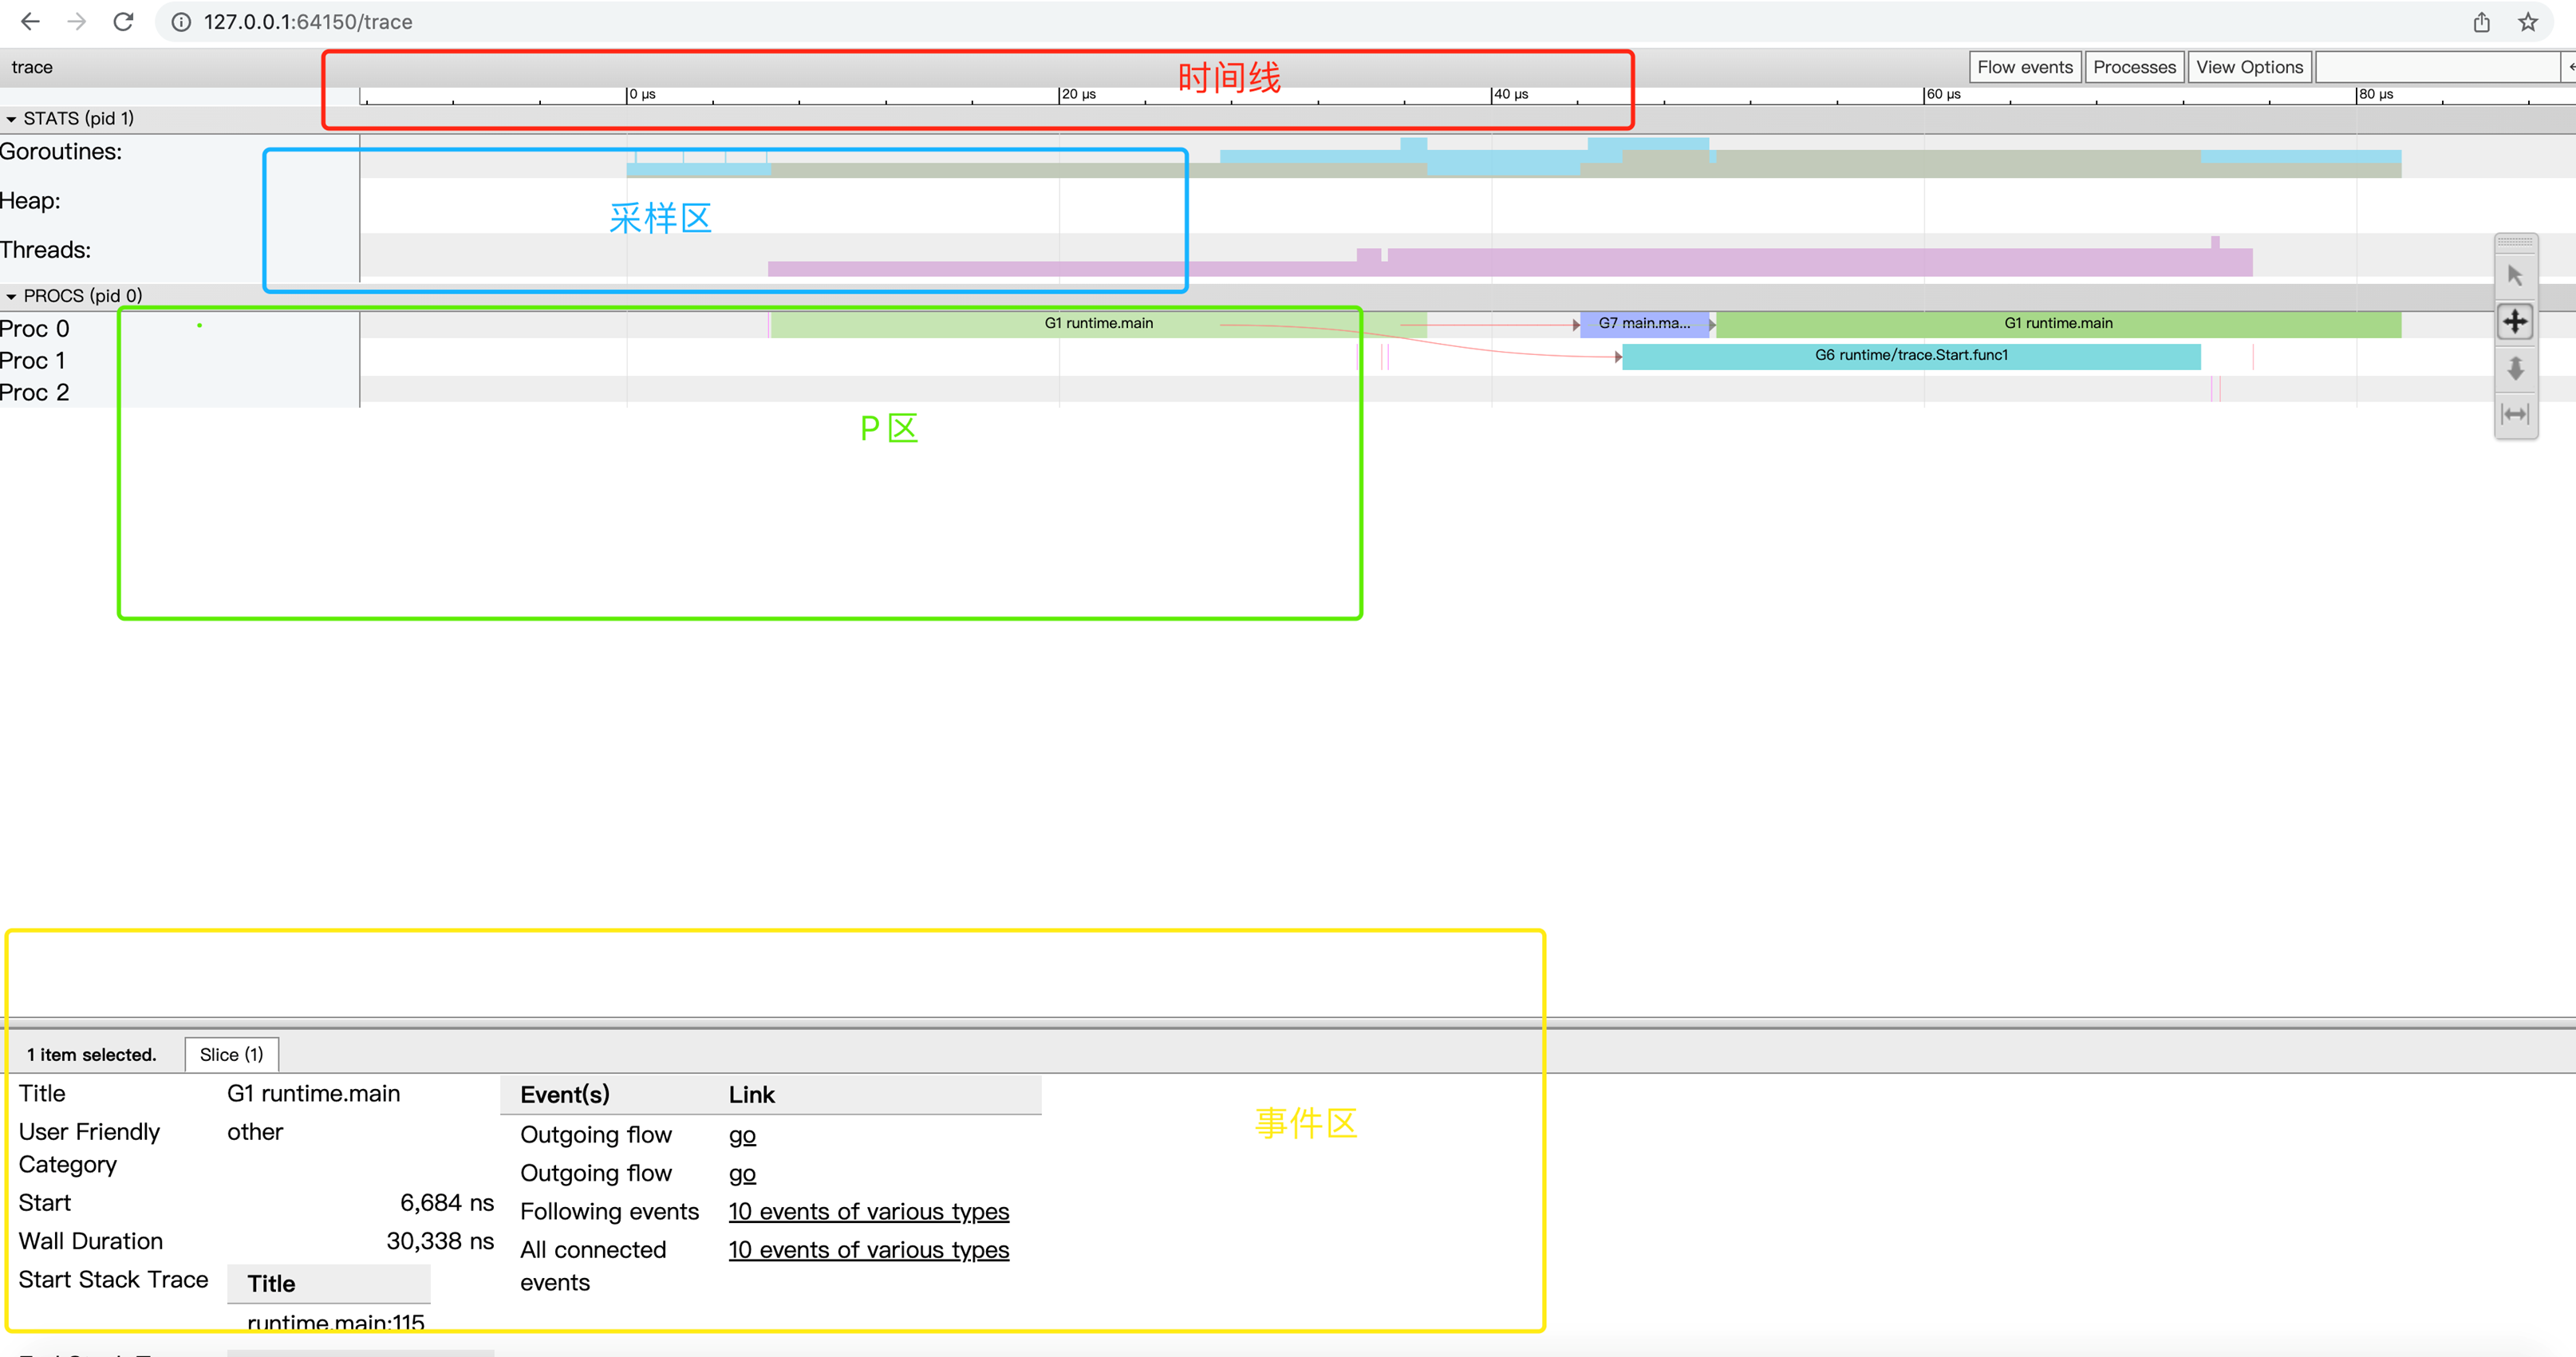
image
时间线
为View trace提供了时间参照系,View trace的时间线始于Tracer开启时,各个区域记录的事件的时间都是基于时间线的起始时间的相对时间。
时间线的时间精度最高为纳秒,但View trace视图支持自由缩放时间线的时间标尺,我们可以在秒、毫秒的“宏观尺度”查看全局,我们亦可以将时间标尺缩放到微秒、纳秒的“微观尺度”来查看某一个极短暂事件的细节。
采样状态区(Stats)
这个区内展示了三个指标:Goroutines、Heap和Threads,某个时间点上的这三个指标的数据是这个时间点上的状态快照采样:
- Goroutines:某一时间点上应用中启动的goroutine的数量,当我们点击某个时间点上的goroutines采样状态区域时(我们可以用快捷键m来准确标记出那个时间点),事件详情区会显示当前的goroutines指标采样状态。
- Heap指标则显示了某个时间点上Go应用heap分配情况(包括已经分配的Allocated和下一次GC的目标值NextGC)。
- Threads指标显示了某个时间点上Go应用启动的线程数量情况,事件详情区将显示处于InSyscall(整阻塞在系统调用上)和Running两个状态的线程数量情况。
P区(PROCS)
我们能看到Go应用中每个P(Goroutine调度概念中的P)上发生的所有事件,包括:EventProcStart、EventProcStop、EventGoStart、EventGoStop、EventGoPreempt、Goroutine辅助GC的各种事件以及Goroutine的GC阻塞(STW)、系统调用阻塞、网络阻塞以及同步原语阻塞(mutex)等事件。除了每个P上发生的事件,我们还可以看到以单独行显示的GC过程中的所有事件。
另外我们看到每个Proc对应的条带都有两行,上面一行表示的是运行在该P上的Goroutine的主事件,而第二行则是一些其他事件,比如系统调用、运行时事件等,或是goroutine代表运行时完成的一些任务,比如代表GC进行并行标记。
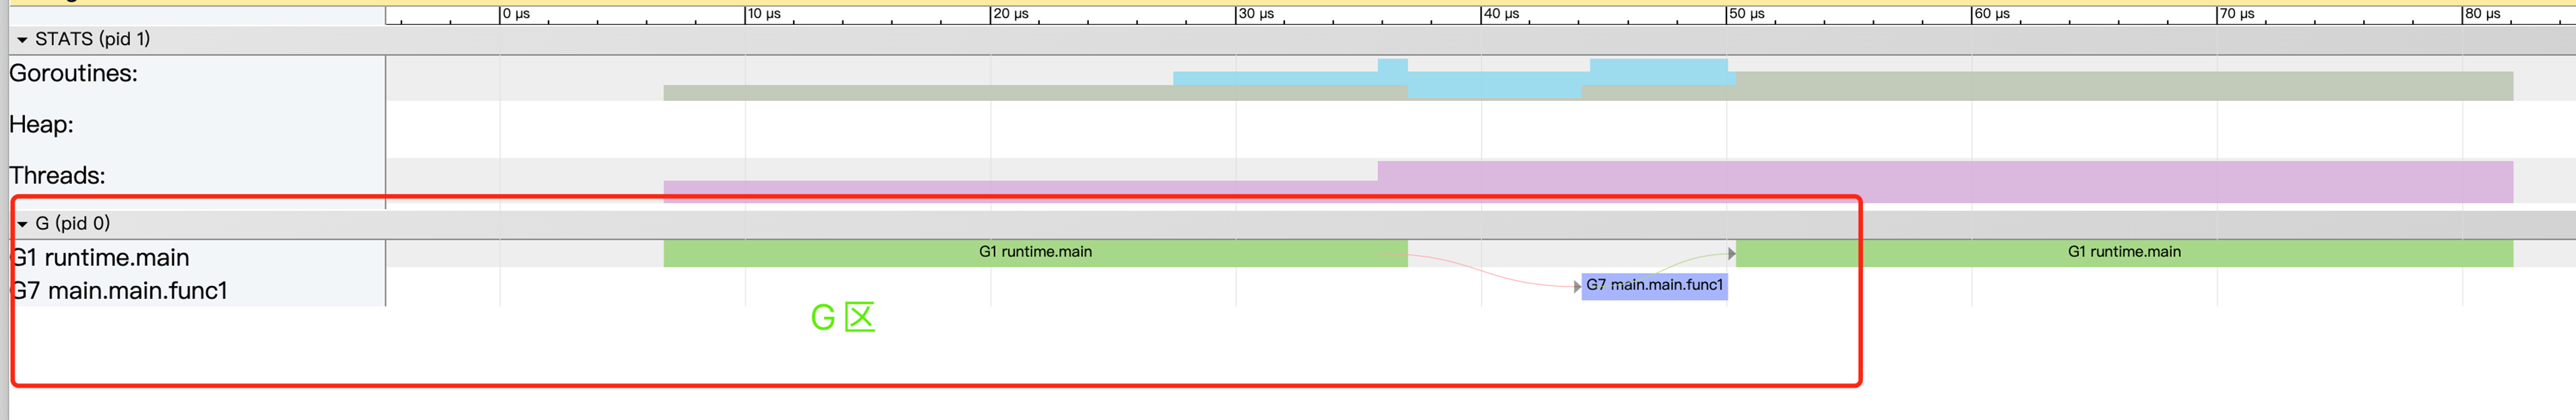
image
在G区,每个G都会对应一个单独的条带(和P区一样,每个条带都有两行),通过这一条带我们可以按时间线看到这个G的全部执行情况。通常我们仅需在goroutine analysis的表格页面找出执行最快和最慢的两个goroutine,在Go视角视图中沿着时间线对它们进行对比,以试图找出执行慢的goroutine究竟出了什么问题。
2.4 Go test 使用pprof
Golang在运行测试用例或压测时也可以通过添加参加输出测试过程中的CPU、内存和trace情况,分析过程同上,参数如下:
-bench=. // 进行性能测试,“.”是正则匹配,匹配了所有的测试函数
-benchmem // 打印出申请内存的次数。一般用于简单的性能测试,不会导出数据文件
-blockprofile block.out // 将协程的阻塞数据写入特定的文件(block.out),如果-c,则写成二进制文件
-cpuprofile cpu.out // 将协程的CPU使用数据写入特定的文件(cpu.out),如果-c,则写成二进制文件
-memprofile mem.out // 将协程的内存申请数据写入特定的文件(mem.out),如果-c,则写成二进制文件
-mutexprofile mutex.out // 将协程的互斥数据写入特定的文件(mutex.out),如果-c,则写成二进制文件
-trace trace.out // 将执行调用链写入特定文件(trace.out)
3 参考
3.1 top输出列解释
通过一个简单示例函数来解释flat、cum、sum等参数含义。
func foo(){
    a()                                        // step1
    largeArray := [math.MaxInt64]int64{}       // step2
    for i := 0; i < math.MaxInt64; i++ {       // step3
            c()                                // step4
    }
}
flat flat%
flat只会记录step2和step3的时间;flat%即是flat/总运行时间。内存等参数同理。所有的flat相加即是总采样时间,所有的flat%相加应该等于100%。
flat一般是我们最关注的。其代表一个函数可能非常耗时,或者调用了非常多次,或者两者兼而有之,从而导致这个函数消耗了最多的时间。
如果是我们自己编写的代码,则很可能有一些无脑for循环、复杂的计算、字符串操作、频繁申请内存等等。
如果是第三方库的代码,则很可能我们过于频繁地调用了这些第三方库,或者以不正确的方式使用了这些第三方库。
cum cum%
相比flat,cum则是这个函数内所有操作的物理耗时,比如包括了上述的step1、2、3、4。
cum%即是cum的时间/总运行时间。内存等参数同理。
一般cum是我们次关注的,且需要结合flat来看。flat可以让我们知道哪个函数耗时多,而cum可以帮助我们找到是哪些函数调用了这些耗时的(flat值大的)函数。
sum%
其上所有行的flat%的累加。可以视为,这一行及其以上行,其所有的directly操作一共占了多少物理时间。
3.2 内存字段解释
在Golang内存分析的过程中经常会出现很多内部相关内存字段,具体解释如下:
Alloc uint64 //golang语言框架堆空间分配的字节数
TotalAlloc uint64 //从服务开始运行至今分配器为分配的堆空间总 和,只有增加,释放的时候不减少
Sys uint64 //服务现在系统使用的内存
Lookups uint64 //被runtime监视的指针数
Mallocs uint64 //服务malloc heap objects的次数
Frees uint64 //服务回收的heap objects的次数
HeapAlloc uint64 //服务分配的堆内存字节数
HeapSys uint64 //系统分配的作为运行栈的内存
HeapIdle uint64 //申请但是未分配的堆内存或者回收了的堆内存(空闲)字节数
HeapInuse uint64 //正在使用的堆内存字节数
HeapReleased uint64 //返回给OS的堆内存,类似C/C++中的free。
HeapObjects uint64 //堆内存块申请的量
StackInuse uint64 //正在使用的栈字节数
StackSys uint64 //系统分配的作为运行栈的内存
MSpanInuse uint64 //用于测试用的结构体使用的字节数
MSpanSys uint64 //系统为测试用的结构体分配的字节数
MCacheInuse uint64 //mcache结构体申请的字节数(不会被视为垃圾回收)
MCacheSys uint64 //操作系统申请的堆空间用于mcache的字节数
BuckHashSys uint64 //用于剖析桶散列表的堆空间
GCSys uint64 //垃圾回收标记元信息使用的内存
OtherSys uint64 //golang系统架构占用的额外空间
NextGC uint64 //垃圾回收器检视的内存大小
LastGC uint64 // 垃圾回收器最后一次执行时间。
PauseTotalNs uint64 // 垃圾回收或者其他信息收集导致服务暂停的次数。
PauseNs [256]uint64 //一个循环队列,记录最近垃圾回收系统中断的时间
PauseEnd [256]uint64 //一个循环队列,记录最近垃圾回收系统中断的时间开始点。
NumForcedGC uint32 //服务调用runtime.GC()强制使用垃圾回收的次数。
GCCPUFraction float64 //垃圾回收占用服务CPU工作的时间总和。如果有100个goroutine,垃圾回收的时间为1S,那么就占用了100S。
BySize //内存分配器使用情况
原创声明:本文系作者授权腾讯云开发者社区发表,未经许可,不得转载。
如有侵权,请联系 cloudcommunity@tencent.com 删除。
原创声明:本文系作者授权腾讯云开发者社区发表,未经许可,不得转载。
如有侵权,请联系 cloudcommunity@tencent.com 删除。
评论
登录后参与评论
推荐阅读
目录
腾讯云开发者

Copyright © 2013 - 2026 Tencent Cloud. All Rights Reserved. 腾讯云 版权所有
深圳市腾讯计算机系统有限公司 ICP备案/许可证号:粤B2-20090059 ![]() 粤公网安备44030502008569号
粤公网安备44030502008569号
腾讯云计算(北京)有限责任公司 京ICP证150476号 | 京ICP备11018762号