TAD calling 之 insulation score 分析

TAD calling 之 insulation score 分析

数据科学工厂
发布于 2023-02-27 11:26:49
发布于 2023-02-27 11:26:49
1. 导读
本文主要对insulation score 的提出与计算方法进行简要的介绍,并展示一个计算insulation score 的过程。
2. 定义
insulation score 是dekker[1]实验室在2015年发表于Nature上的Condensin-driven remodelling of X chromosome topology during dosage compensation[2]文章中提出的,其主要用于TAD相关的分析与表征,目前insulation score主要用于识别TAD
3. 计算方法
3.1. 计算insulation score
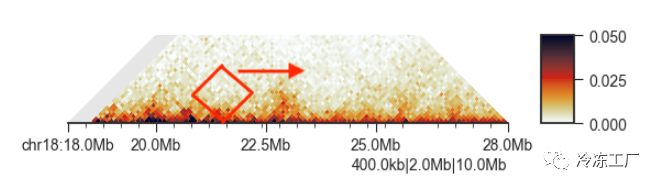
计算过程动画
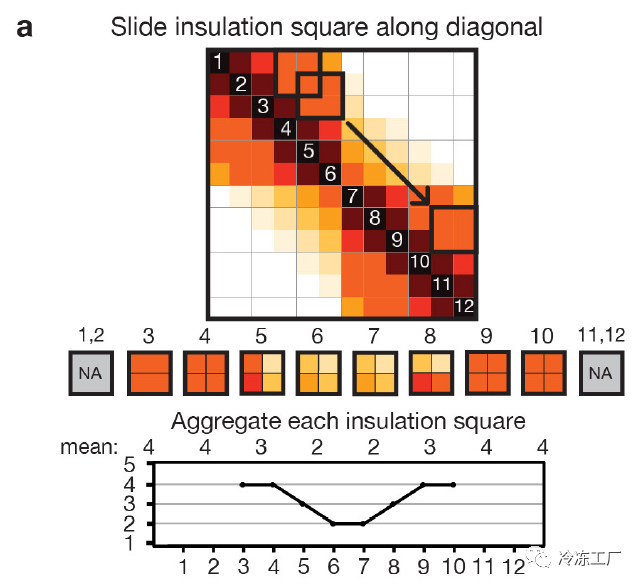
在给定的区域内,沿着互作矩阵的对角线,以一个正方形的滑动窗口,从上至下滑动,计算每个窗口内互作程度值的总和。
这些bin之间存在这很强的insulation现象,例如在TAD的边界,这些区域的insulation score (根据insulation square测定)很低。
那些互作程度较高,比如TAD内部的区域,它们的insulation score 很高。
这些insulation score 很低的区域,可能就是潜在的TAD边界。
3.2. insulation score标准化
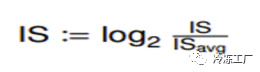
标准化公式
ISavg: 是所有
IS值的平均值
3.3. 计算每个bin的delta值
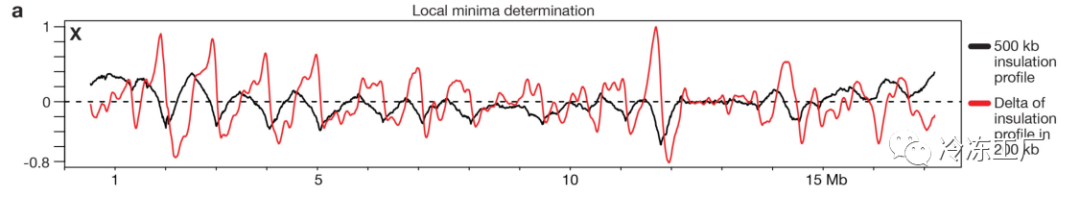
insulation score 曲线
将每个bin的互作强度值作为value,画出其在染色体上的波动曲线,波谷处就是需要识别的边界。为了识别出黑色曲线中的波谷,方法中又定义了一个window,对每个bin内的insulation值计算delta值,最终红色曲线中经过X轴的坐标即为insulation score值曲线的波谷,也就是TAD边界的位置(从上图可以看到,红色曲线穿过0刻度线的点,对应的就是黑色波动曲线的波谷)。
3.4. 计算TAD边界
由于该方法计算的是TAD的边界位置,因此TAD domain的位置区域,需要进一步的转换,才能得到。
4. 公式总结[3]
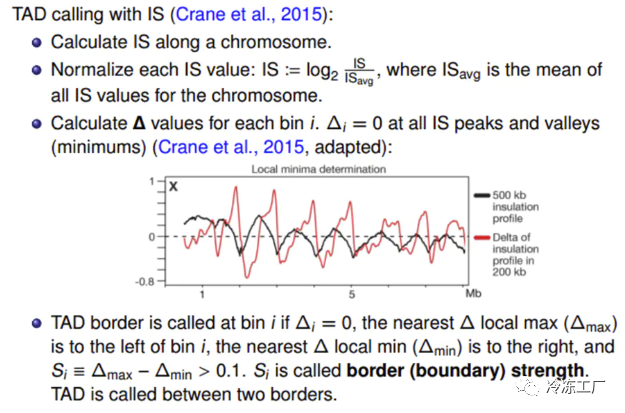
公式总结
5. 实战
下面介绍如何用FAN-C[4]计算insulation score
5.1 install
pip install fanc -i https://pypi.tuna.tsinghua.edu.cn/simple
- 推荐使用
conda进行安装
conda create -n fanc python=3.7
conda activate fanc
conda install fanc
5.2. example
- 计算
利用不同的windows size计算insulation score
fanc insulation ./example.hic ./example.insulation \
-w 1000000 1500000 2000000 2500000 3000000 3500000 4000000 \
-o bed  # 输出bed 格式
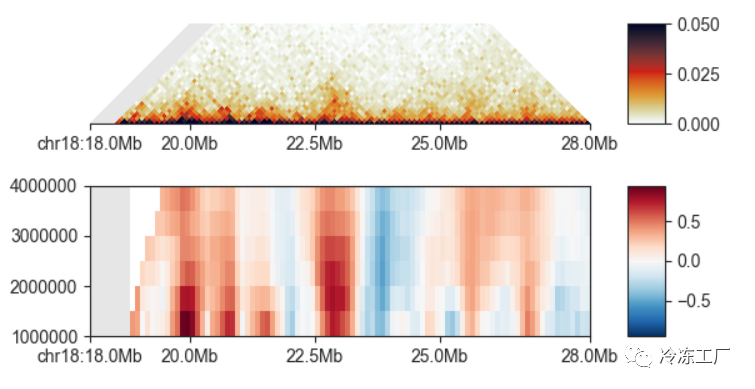
TAD强度变化图
TAD边界强度变化图,大体上可以反映TAD之间隔绝情况,绝缘系数越低,TAD之间交互越弱。
边界强度变化图
- 绘图
fancplot -o ./insulation.png chr18:18mb-28mb \
-p ./example.hic -m 4000000 -vmin 0 -vmax 0.05 \
-p ./example.insulation
- 曲线图
fancplot --width 6 -o ./example.png \
chr18:18mb-28mb -p triangular ./example.hic -m 4000000 \
-vmin 0 -vmax 0.05 -p line ./example.insulation_1mb.bed \
./example.insulation_2mb.bed -l "1mb" "2mb"
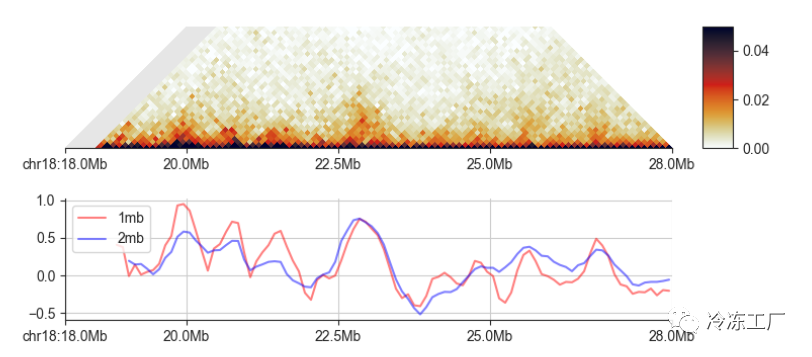
insulation score 曲线
参考资料
[1]
dekker: https://github.com/dekkerlab/crane-nature-2015
[2]
Nature: https://www.nature.com/articles/nature14450#citeas
[3]
公式: https://www.jianshu.com/p/fd39eeaf1e75
[4]
FAN-C: https://fan-c.readthedocs.io/en/latest/index.html
本文参与 腾讯云自媒体同步曝光计划,分享自微信公众号。
原始发表:2022-09-24,如有侵权请联系 cloudcommunity@tencent.com 删除
评论
登录后参与评论
推荐阅读
目录
腾讯云开发者

Copyright © 2013 - 2026 Tencent Cloud. All Rights Reserved. 腾讯云 版权所有
深圳市腾讯计算机系统有限公司 ICP备案/许可证号:粤B2-20090059 ![]() 粤公网安备44030502008569号
粤公网安备44030502008569号
腾讯云计算(北京)有限责任公司 京ICP证150476号 | 京ICP备11018762号