可视化导学-图形基础

可视化导学-图形基础

Cellinlab
发布于 2023-05-17 14:56:36
发布于 2023-05-17 14:56:36
关于 HTML/CSS、SVG、Canvas2D 和 WebGL 这四种图形系统。
# 浏览器中实现可视化的方法
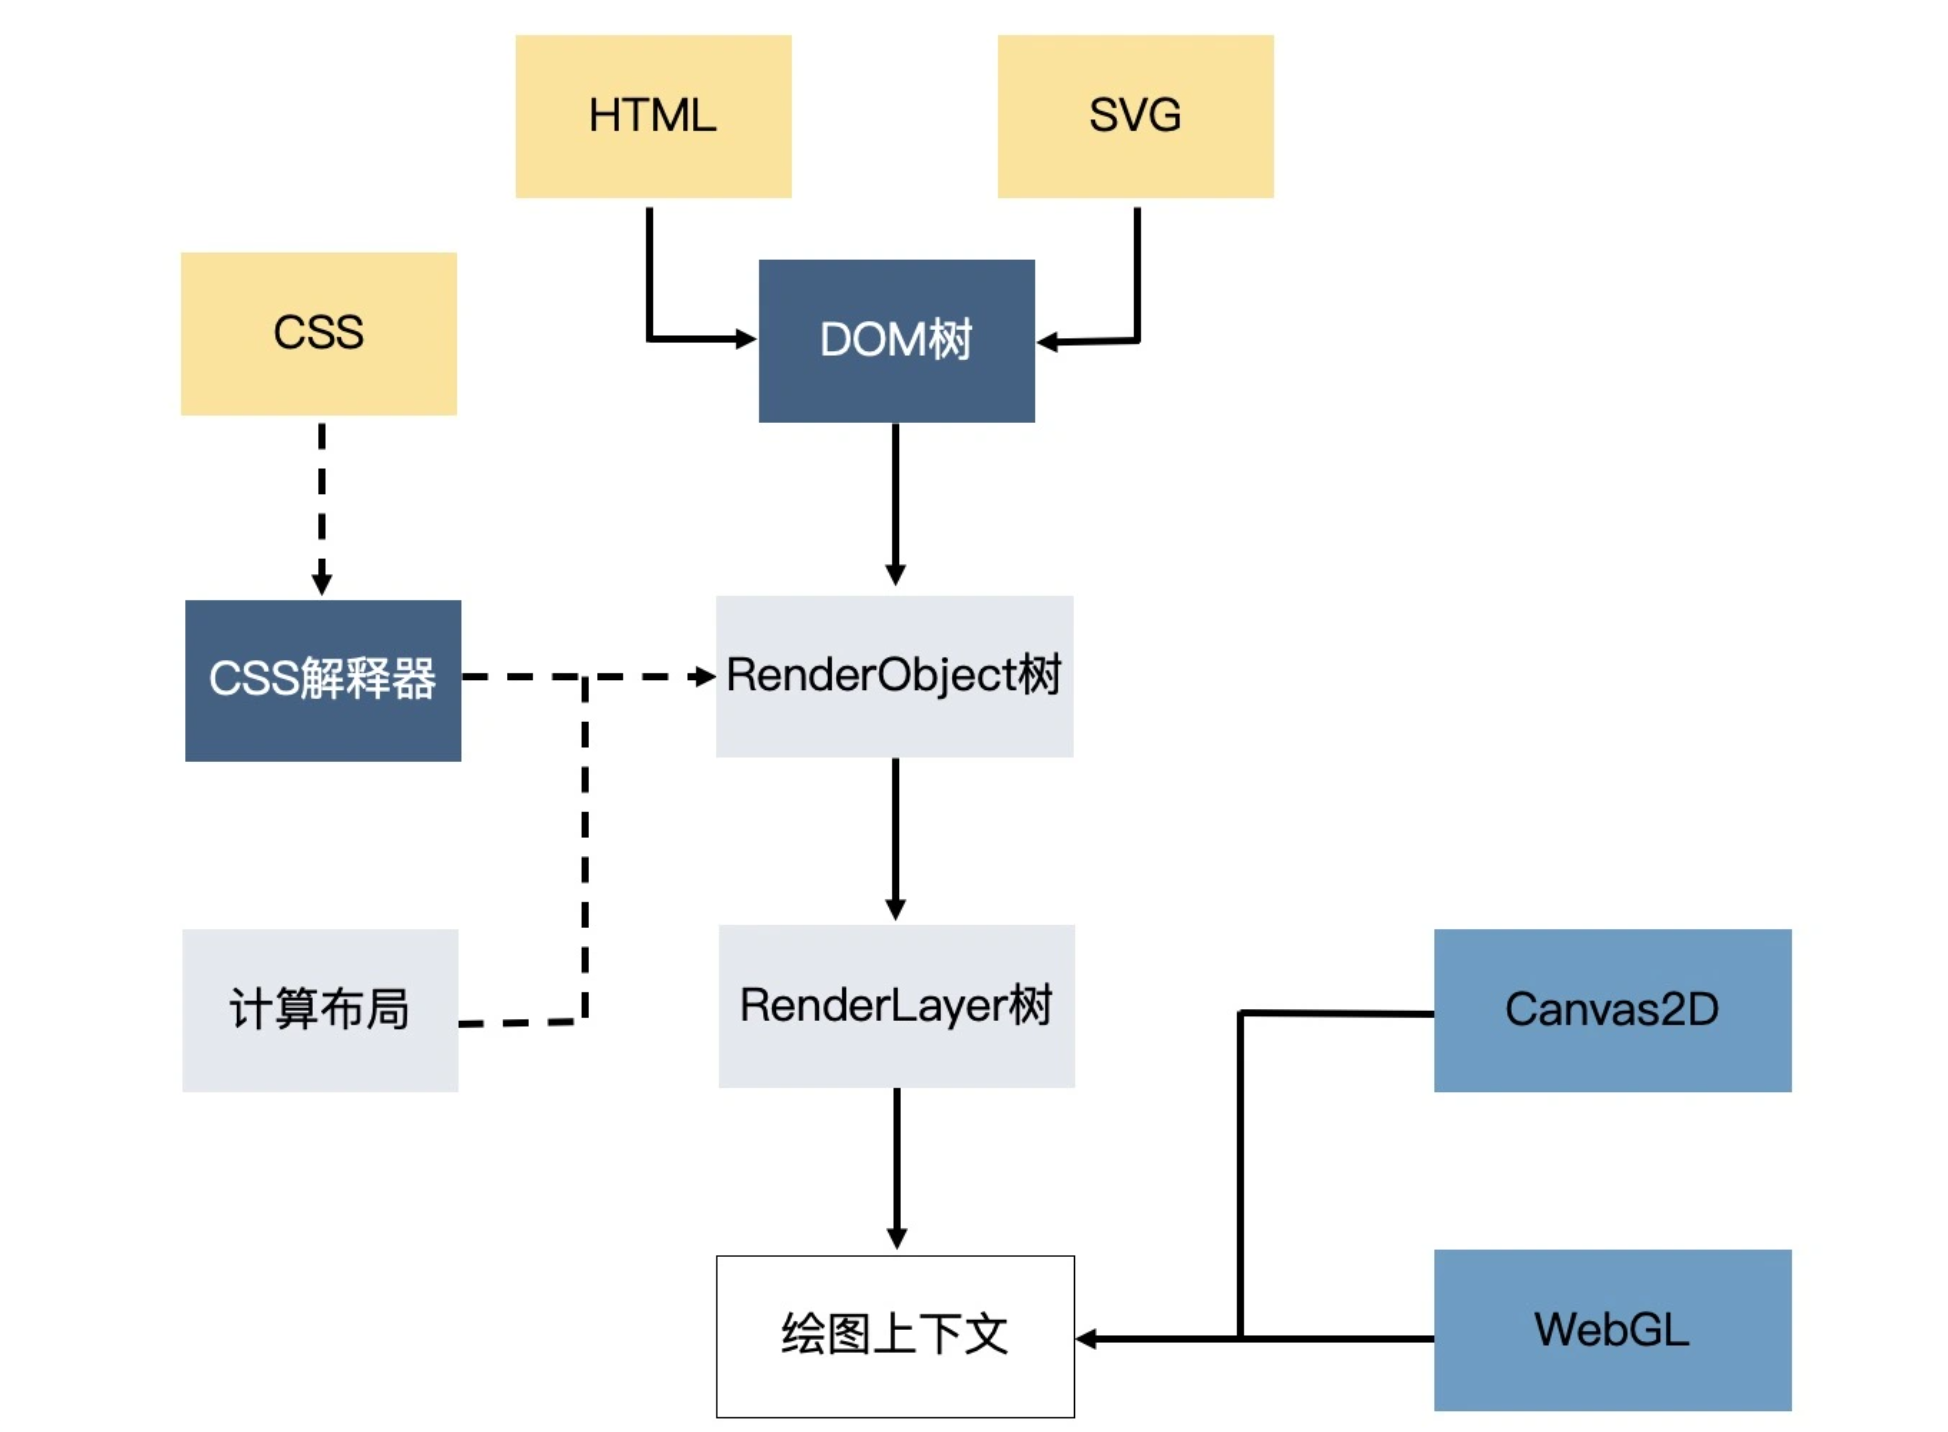
现代浏览器是一个复杂的系统,其中负责绘制图形的部分是渲染引擎。渲染引擎绘制图形的方式,大体上有 4 种:
# HTML/CSS
- 通常用来呈现普通的 Web 网页
- 可以做简单可视化图表
- 优点
- 方便,不需要第三方依赖,甚至不需要 JavaScript 代码
- 缺点
- 虽然能绘制可视化图表,但是绘制的方式并不简洁,很难看出数据与图形的对应关系,有很多换算也需要开发人员做,改动时维护难
- HTML 和 CSS 作为浏览器渲染引擎的一部分,为了完成页面渲染,除了绘制图形外,还要做很多额外的工作,性能开销非常大
- 涉及 UI 构建和内容组织,所以这些额外的解析和构建工作都是必须做的,可视化与传统网页不同,它不太需要复杂的布局,更多的工作是在绘图和数据计算。
CSS 实现柱状图,原理是使用网格布局 (opens new window)(Grid Layout)加上线性渐变 (opens new window)(Linear-gradient)。
<html>
  <body>
    <div class="demo0-bargraph">
      <div></div>
      <div></div>
      <div></div>
      <div></div>
      <div></div>
    </div>
  </body>
</html>
<script>
</script>
<style>
.demo0-bargraph {
  display: grid;
  width: 150px;
  height: 100px;
  padding: 10px;
  transform: scaleY(3);
  grid-template-columns: repeat(5, 20%);
}
.demo0-bargraph div {
  margin: 0 2px;
}
.demo0-bargraph div:nth-child(1) {
  background: linear-gradient(to bottom, transparent 75%, #37c 0, #37c 85%, #3c7 0);
}
.demo0-bargraph div:nth-child(2) {
  background: linear-gradient(to bottom, transparent 74%, #37c 0, #37c 89%, #3c7 0);
}
.demo0-bargraph div:nth-child(3) {
  background: linear-gradient(to bottom, transparent 60%, #37c 0, #37c 83%, #3c7 0);
}
.demo0-bargraph div:nth-child(4) {
  background: linear-gradient(to bottom, transparent 55%, #37c 0, #37c 75%, #3c7 0);
}
.demo0-bargraph div:nth-child(5) {
  background: linear-gradient(to bottom, transparent 32%, #37c 0, #37c 63%, #3c7 0);
}
</style>使用圆锥渐变 (opens new window)(conic-gradient())实现饼图
<html>
  <body>
    <div class="demo1-piegraph">
    </div>
  </body>
</html>
<script>
</script>
<style>
.demo1-piegraph {
  display: inline-block;
  width: 250px;
  height: 250px;
  border-radius: 50%;
  background-image: conic-gradient(
    #37c 30deg,
    #3c7 30deg, #3c7 65deg,
    orange 65deg, orange 110deg,
    #f73 110deg, #f73 200deg,
    #ccc 200deg
  );
}
</style>
# SVG
现代浏览器支持 SVG (opens new window)(Scalable Vector Graphics,可缩放矢量图),SVG 是一种基于 XML 语法的图像格式,可以用图片(img 元素)的 src 属性加载。而且,浏览器更强大的是,它还可以内嵌 SVG 标签,并且像操作普通的 HTML 元素一样,利用 DOM API 操作 SVG 元素。甚至,CSS 也可以作用于内嵌的 SVG 元素。
<html>
  <body>
    <svg xmlns="http://www.w3.org/2000/svg"
      width="120px" height="240px" viewBox="0 0 60 100">
      <g transform="translate(0, 100) scale(1, -1)">
        <g>
          <rect x="1" y="0" width="10" height="25" fill="#37c" />
          <rect x="13" y="0" width="10" height="26" fill="#37c" />
          <rect x="25" y="0" width="10" height="40" fill="#37c" />
          <rect x="37" y="0" width="10" height="45" fill="#37c" />
          <rect x="49" y="0" width="10" height="68" fill="#37c" />
        </g>
        <g>
          <rect x="1" y="0" width="10" height="15" fill="#3c7"/>
          <rect x="13" y="0" width="10" height="11" fill="#3c7"/>
          <rect x="25" y="0" width="10" height="17" fill="#3c7"/>
          <rect x="37" y="0" width="10" height="25" fill="#3c7"/>
          <rect x="49" y="0" width="10" height="37" fill="#3c7"/>
        </g>
      </g>
    </svg>
  </body>
</html>
<script>
</script>
<style>
</style>- SVG 和传统的 HTML+CSS 的绘图方式差别不大
- SVG 只适合应用于元素较少的简单可视化场景
- 优点
- 弥补了 HTML 元素在绘制矢量图形方面有些能力不足的地方
- 通过属性设置图形,可以直观地体现数据,使用起来非常方便
- 缺点
- 在渲染引擎中,SVG 元素和 HTML 元素一样,在输出图形前都需要经过引擎的解析、布局计算和渲染树生成
- 一个 SVG 元素只表示一种基本图形,如果展示的数据很复杂,生成图形的 SVG 元素就会很多。这样一来,大量的 SVG 元素不仅会占用很多内存空间,还会增加引擎、布局计算和渲染树生成的开销,降低性能,减慢渲染速度
# Canvas2D
Canvas2D (opens new window) 是浏览器提供的一种可以直接用代码在一块平面的“画布”上绘制图形的 API,使用它来绘图更像是传统的“编写代码”,简单来说就是调用绘图指令,然后引擎直接在页面上绘制图形,是一种指令式的绘图系统。
- 浏览器提供的 Canvas API 中的其中一种上下文,使用它可以非常方便地绘制出基础的几何图形
- Canvas 能够直接操作绘图上下文,不需要经过 HTML、CSS 解析、构建渲染树、布局等一系列操作,单纯绘图的话,Canvas 比 HTML/CSS 和 SVG 要快得多
- 因为 HTML 和 SVG 一个元素对应一个基本图形,所以我们可以很方便地操作它们,但很难单独对 Canvas 绘图的局部进行控制,不过通过数学计算可以通过定位的方式来获取局部图形
Canvas 和 SVG 的使用也不是非此即彼的,可以结合使用。因为 SVG 作为一种图形格式,也可以作为 image 元素绘制到 Canvas 中。举个例子,可以先使用 SVG 生成某些图形,然后用 Canvas 来渲染。这样,就既可以享受 SVG 的便利性,又可以享受 Canvas 的高性能了。
# WebGL
- 浏览器提供的 Canvas API 中的另一种上下文,它是 OpenGL ES 规范在 Web 端的实现
- 可以用 GPU 渲染各种复杂的 2D 和 3D 图形
- WebGL 利用了 GPU 并行处理的特性,这让它在处理大量数据展现的时候,性能大大优于前 3 种绘图方式
- 适合一些数据量大、视觉效果要求高的特殊场景
- 要绘制的图形数量非常多,就需要使用 GPU 能力
- 对较大图像的细节做像素处理,比如,实现物体的光影、流体效果和一些复杂的像素滤镜
- 绘制 3D 物体,WebGL 内置了对 3D 物体的投影、深度检测等特性
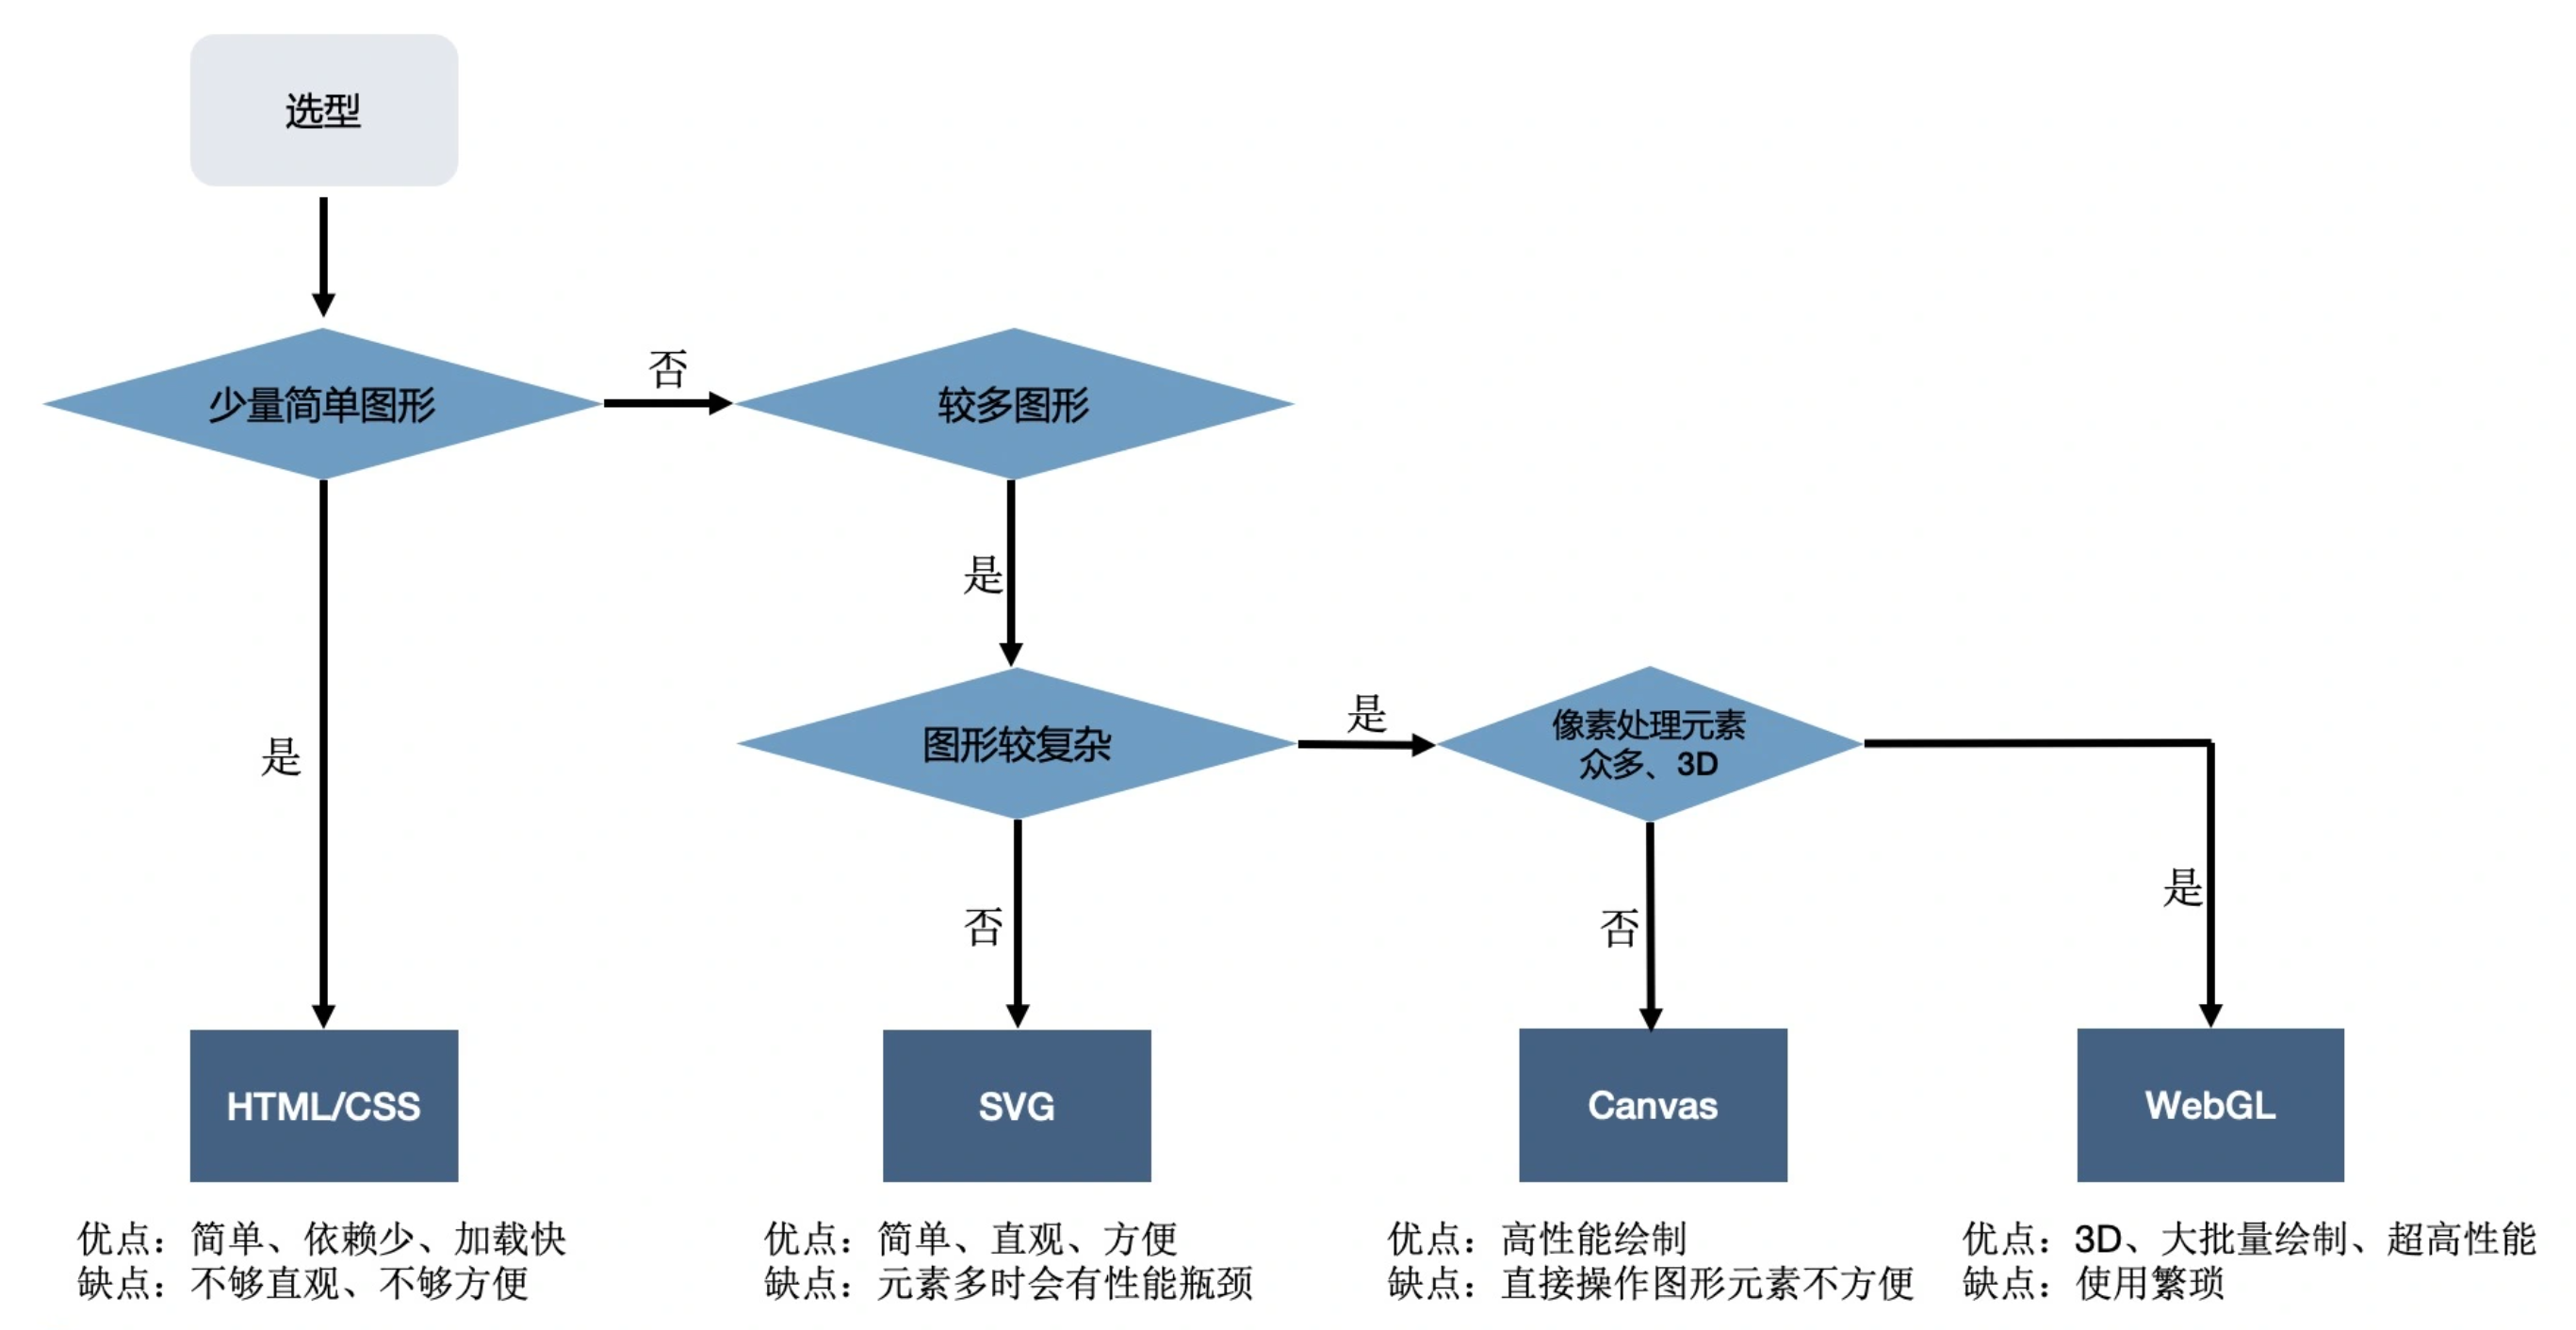
# 技术选型
# Canvas 使用
# 用 Canvas 绘制几何图形
<html>
  <body>
    <div class="demo0">
      <canvas id="canvas-0" width="512" height="512"></canvas>
    </div>
  </body>
</html>
<script>
  const canvas = document.querySelector('#canvas-0');
  const ctx = canvas.getContext('2d');

  const rectSize = [100, 100];
  ctx.fillStyle = 'red';
  ctx.beginPath();
  ctx.rect(0.5 * canvas.width, 0.5 * canvas.height, ...rectSize);
  ctx.fill();
</script>
<style>
.demo0 {
  display: inline-block;
  border: 1px solid #ccc;
}
.demo0 canvas {
  width: 256px;
  height: 256px;
}
</style>
Canvas 的坐标系和浏览器窗口的坐标系类似,它们都默认左上角为坐标原点,x 轴水平向右,y 轴垂直向下。这个坐标系和笛卡尔坐标系不同,它们的 y 轴是相反的。
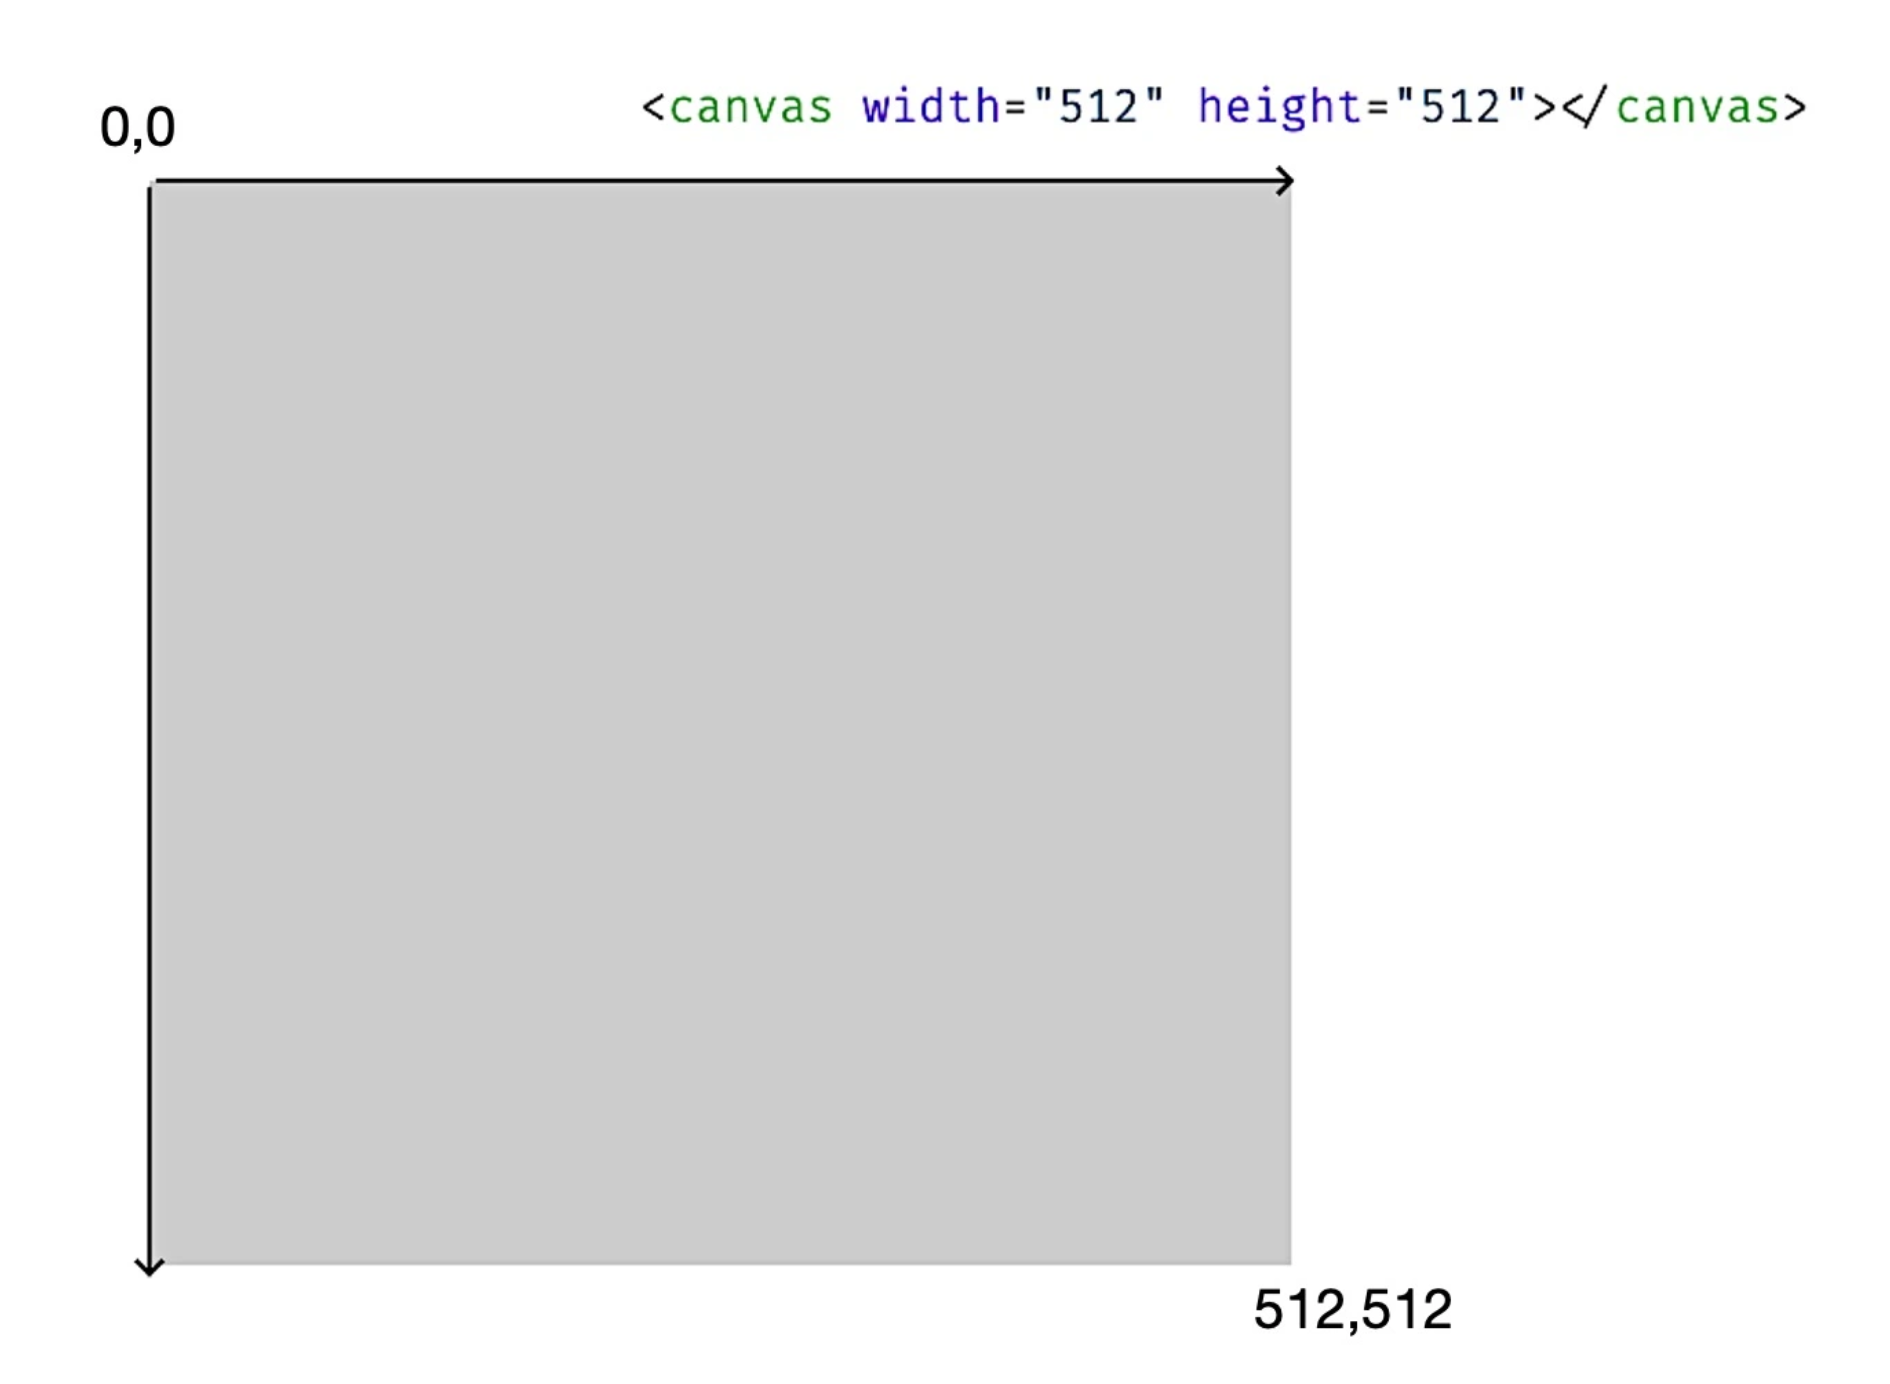
rect 指令的 x、y 的值表示的是,要绘制出的矩形的左上角坐标而不是中心点坐标,所以绘制出来的正方形不在正中心。
可以通过两种方法修正,第一种是可以让 rect 指令的 x、y 参数,等于画布宽高的一半分别减去矩形自身宽高的一半。这样,就把正方形的中心点真正地移动到画布中心了:
<html>
  <body>
    <div class="demo1">
      <canvas id="canvas-1" width="512" height="512"></canvas>
    </div>
  </body>
</html>
<script>
  const canvas = document.querySelector('#canvas-1');
  const ctx = canvas.getContext('2d');

  const rectSize = [100, 100];
  ctx.fillStyle = 'red';
  ctx.beginPath();
  ctx.rect(0.5 * (canvas.width - rectSize[0]), 0.5 * (canvas.height - rectSize[1]), ...rectSize);
  ctx.fill();
</script>
<style>
.demo1 {
  display: inline-block;
  border: 1px solid #ccc;
}
.demo1 canvas {
  width: 256px;
  height: 256px;
}
</style>也可以先给画布设置一个平移变换(Translate) (opens new window),然后再进行绘制:
<html>
  <body>
    <div class="demo2">
      <canvas id="canvas-2" width="512" height="512"></canvas>
    </div>
  </body>
</html>
<script>
  const canvas = document.querySelector('#canvas-2');
  const ctx = canvas.getContext('2d');

  const rectSize = [100, 100];

  ctx.translate(-0.5 * rectSize[0], -0.5 * rectSize[1]);

  ctx.fillStyle = 'red';
  ctx.beginPath();
  ctx.rect(0.5 * canvas.width, 0.5 * canvas.height, ...rectSize);
  ctx.fill();
</script>
<style>
.demo2 {
  display: inline-block;
  border: 1px solid #ccc;
}
.demo2 canvas {
  width: 256px;
  height: 256px;
}
</style>
第一种方法计算麻烦,推荐使用第二种。第二种方式是对 Canvas 画布的整体做一个平移操作,这样只需要获取中心点与左上角的偏移,然后对画布设置 translate 变换就可以了,不需要再去改变图形的顶点位置。不过,这会改变了画布的状态。如果后续还有其他的图形需要绘制,需要画布状态给恢复回来。
可以使用反向平移来恢复画布状态,Canvas 上下文还提供了 save (opens new window) 和 restore (opens new window) 方法,可以暂存和恢复画布某个时刻的状态。
# 用 Canvas 绘制层次关系
要把数据转换成图形信息,这个步骤需要数学计算。不过,可以直接使用 d3-hierarchy (opens new window) 这个工具库转换数据。
<html>
  <script src="https://cdn.jsdelivr.net/npm/d3-hierarchy@3"></script>
  <body>
    <div class="demo3">
      <canvas id="canvas-3" width="1600" height="1600"></canvas>
    </div>
  </body>
</html>
<script>
  const data = {
    "name":"中国",
    "children":
    [
      {
        "name":"浙江" ,
          "children":
          [
              {"name":"杭州" },
              {"name":"宁波" },
              {"name":"温州" },
              {"name":"绍兴" }
          ]
        },
      {
        "name":"广西" ,
        "children":
        [
          {"name":"桂林"},
          {"name":"南宁"},
          {"name":"柳州"},
          {"name":"防城港"}
        ]
      },
      {
        "name":"黑龙江",
        "children":
        [
          {"name":"哈尔滨"},
          {"name":"齐齐哈尔"},
          {"name":"牡丹江"},
          {"name":"大庆"}
        ]
      },
      {
        "name":"新疆" ,
        "children":
        [
          {"name":"乌鲁木齐"},
          {"name":"克拉玛依"},
          {"name":"吐鲁番"},
          {"name":"哈密"}
        ]
      },
      {
        "name":"河北" ,
        "children":
        [
          {"name":"石家庄"},
          {"name":"唐山"},
          {"name":"邯郸"},
          {"name":"秦皇岛"}
        ]
      },
      {
        "name":"西藏" ,
        "children":
        [
          {"name":"拉萨"},
          {"name":"昌都"},
          {"name":"林芝"}
        ]
      },
      {
        "name":"江苏" ,
        "children":
        [
          {"name":"南京"},
          {"name":"无锡"},
          {"name":"徐州"},
          {"name":"常州"},
          {"name":"连云港"},
          {"name":"淮安"}
        ]
      },
      {
        "name":"江苏" ,
        "children":
        [
          {"name":"南京"},
          {"name":"无锡"},
          {"name":"徐州"},
          {"name":"常州"},
          {"name":"连云港"},
          {"name":"淮安"}
        ]
      },
      {
        "name":"湖南" ,
        "children":
        [
          {"name":"长沙"},
          {"name":"株洲"},
          {"name":"湘潭"},
          {"name":"衡阳"},
          {"name":"邵阳"},
          {"name":"岳阳"}
        ]
      },
      {
        "name":"海南" ,
        "children":
        [
          {"name":"海口"},
          {"name":"三亚"},
          {"name":"三沙"}
        ]
      },
      {
        "name":"陕西" ,
        "children":
        [
          {"name":"西安"},
          {"name":"咸阳"},
          {"name":"汉中"},
          {"name":"安康"},
          {"name":"榆林"},
          {"name":"延安"}
        ]
      },
      {
        "name":"甘肃" ,
        "children":
        [
          {"name":"兰州"},
          {"name":"酒泉"},
          {"name":"金昌"},
          {"name":"天水"},
          {"name":"嘉峪关"},
          {"name":"武威"}
        ]
      }
    ]
  };

  const regions = d3.hierarchy(data)
    .sum(d => 1)
    .sort((a, b) => b.value - a.value);
  const pack = d3.pack()
    .size([1600, 1600])
    .padding(3);
  const root = pack(regions);

  const TAU = 2 * Math.PI;

  function draw(ctx, node, {
    fillStyle = 'rgba(0,0,0,0.2)',
    textColor = '#fff',
  } = {}) {
    const { children, x, y, r } = node;

    ctx.fillStyle = fillStyle;
    ctx.beginPath();
    ctx.arc(x, y, r, 0, TAU);
    ctx.fill();

    if (children) {
      for (let i = 0; i < children.length; i++) {
        draw(ctx, children[i]);
      }
    } else {
      const name = node.data.name;
      ctx.fillStyle = textColor;
      ctx.font = '1.5rem Arial';
      ctx.textAlign = 'center';
      ctx.fillText(name, x, y);
    }
  }

  const canvas = document.querySelector('#canvas-3');
  const ctx = canvas.getContext('2d');

  draw(ctx, root);
</script>
<style>
.demo3 {
  display: inline-block;
  border: 1px solid #ccc;
}
.demo3 canvas {
  width: 800px;
  height: 800px;
}
</style>
# SVG
因为描述 SVG 的 XML 语言本身和 HTML 非常接近,都是由标签 + 属性构成的,而且浏览器的 CSS、JavaScript 都能够正常作用于 SVG 元素,可以理解为 SVG 就是 HTML 的增强版。
# 用 SVG 绘制几何图形
<html>
  <body>
    <div class="demo4">
      <svg xmlns="http://www.w3.org/2000/svg" version="1.1">
        <circle cx="100" cy="50" r="40" stroke="black"
          stroke-width="2"  fill="orange" />
      </svg>
    </div>
  </body>
</html>
<script>

</script>
<style>
.demo4 {
  display: inline-block;
  border: 1px solid #ccc;
}
</style>
# 用 SVG 绘制层次关系图
<html>
  <script src="https://cdn.jsdelivr.net/npm/d3-hierarchy@3"></script>
  <body>
    <div class="demo5">
      <h1 id="demo5-title"></h1>
      <svg xmlns="http://www.w3.org/2000/svg" version="1.1" id="svg-5"
        width="800" height="800" viewBox="0 0 1600 1600">
      </svg>
    </div>
  </body>
</html>
<script>
  const data = {
    "name":"中国",
    "children":
    [
      {
        "name":"浙江" ,
          "children":
          [
              {"name":"杭州" },
              {"name":"宁波" },
              {"name":"温州" },
              {"name":"绍兴" }
          ]
        },
      {
        "name":"广西" ,
        "children":
        [
          {"name":"桂林"},
          {"name":"南宁"},
          {"name":"柳州"},
          {"name":"防城港"}
        ]
      },
      {
        "name":"黑龙江",
        "children":
        [
          {"name":"哈尔滨"},
          {"name":"齐齐哈尔"},
          {"name":"牡丹江"},
          {"name":"大庆"}
        ]
      },
      {
        "name":"新疆" ,
        "children":
        [
          {"name":"乌鲁木齐"},
          {"name":"克拉玛依"},
          {"name":"吐鲁番"},
          {"name":"哈密"}
        ]
      },
      {
        "name":"河北" ,
        "children":
        [
          {"name":"石家庄"},
          {"name":"唐山"},
          {"name":"邯郸"},
          {"name":"秦皇岛"}
        ]
      },
      {
        "name":"西藏" ,
        "children":
        [
          {"name":"拉萨"},
          {"name":"昌都"},
          {"name":"林芝"}
        ]
      },
      {
        "name":"江苏" ,
        "children":
        [
          {"name":"南京"},
          {"name":"无锡"},
          {"name":"徐州"},
          {"name":"常州"},
          {"name":"连云港"},
          {"name":"淮安"}
        ]
      },
      {
        "name":"江苏" ,
        "children":
        [
          {"name":"南京"},
          {"name":"无锡"},
          {"name":"徐州"},
          {"name":"常州"},
          {"name":"连云港"},
          {"name":"淮安"}
        ]
      },
      {
        "name":"湖南" ,
        "children":
        [
          {"name":"长沙"},
          {"name":"株洲"},
          {"name":"湘潭"},
          {"name":"衡阳"},
          {"name":"邵阳"},
          {"name":"岳阳"}
        ]
      },
      {
        "name":"海南" ,
        "children":
        [
          {"name":"海口"},
          {"name":"三亚"},
          {"name":"三沙"}
        ]
      },
      {
        "name":"陕西" ,
        "children":
        [
          {"name":"西安"},
          {"name":"咸阳"},
          {"name":"汉中"},
          {"name":"安康"},
          {"name":"榆林"},
          {"name":"延安"}
        ]
      },
      {
        "name":"甘肃" ,
        "children":
        [
          {"name":"兰州"},
          {"name":"酒泉"},
          {"name":"金昌"},
          {"name":"天水"},
          {"name":"嘉峪关"},
          {"name":"武威"}
        ]
      }
    ]
  };

  const regions = d3.hierarchy(data)
    .sum(d => 1)
    .sort((a, b) => b.value - a.value);
  const pack = d3.pack()
    .size([1600, 1600])
    .padding(3);
  const root = pack(regions);

  const svg = document.querySelector('#svg-5');

  draw(svg, root);

  const titleEl = document.querySelector('#demo5-title');

  function getTitle(target) {
    const name = target.getAttribute('data-name');
    if (target.parentNode && target.parentNode.nodeName === 'g') {
      const parentName = target.parentNode.getAttribute('data-name');
      return `${parentName} - ${name}`;
    }
    return name;
  }

  let activeTarget = null;
  svg.addEventListener('mousemove', function(e) {
    const target = e.target;
    if (target.nodeName === 'text') {
      target = target.previousSibling;
    }
    if (activeTarget !== target) {
      if (activeTarget) {
        activeTarget.setAttribute('fill', 'rgba(0, 0, 0, 0.2)');
      }
    }
    target.setAttribute('fill', 'rgba(0, 128, 0, 0.1)');
    titleEl.textContent = getTitle(target);
    activeTarget = target;
  });

  function draw(parent, node, {
    fillStyle = 'rgba(0, 0, 0, 0.2)',
    textColor = 'white',
  } = {}) {
    const { children, x, y, r } = node;

    const circle = document.createElementNS('http://www.w3.org/2000/svg', 'circle');
    circle.setAttribute('cx', x);
    circle.setAttribute('cy', y);
    circle.setAttribute('r', r);
    circle.setAttribute('fill', fillStyle);
    circle.setAttribute('data-name', node.data.name);
    parent.appendChild(circle);

    if (children) {
      const group = document.createElementNS('http://www.w3.org/2000/svg', 'g');
      for (let i = 0; i < children.length; i++) {
        draw(group, children[i]);
      }
      group.setAttribute('data-name', node.data.name);
      parent.appendChild(group);
    } else {
      const text = document.createElementNS('http://www.w3.org/2000/svg', 'text');
      text.setAttribute('fill', textColor);
      text.setAttribute('font-family', 'Arial');
      text.setAttribute('font-size', '1.5rem');
      text.setAttribute('text-anchor', 'middle');
      text.setAttribute('x', x);
      text.setAttribute('y', y);
      text.textContent = node.data.name;
      parent.appendChild(text);
    }
  }
</script>
<style>
.demo5 {
  display: inline-block;
  border: 1px solid #ccc;
}
.demo5 h1 {
  position: absolute;
  width: 800px;
  text-align: center;
}
</style>
https://codepen.io/cellinlab/pen/PoQogpw
SVG 和 Canvas 在使用上的不同主要可以分为两点,分别是写法上的不同和用户交互实现上的不同。
SVG 是以创建图形元素绘图的“声明式”绘图系统,Canvas 是执行绘图指令绘图的“指令式”绘图系统。从写法上来看,因为 SVG 的声明式类似于 HTML 书写方式,本身对前端工程师会更加友好。但是,SVG 图形需要由浏览器负责渲染和管理,将元素节点维护在 DOM 树中。这样做的缺点是,在一些动态的场景中,也就是需要频繁地增加、删除图形元素的场景中,SVG 与一般的 HTML 元素一样会带来 DOM 操作的开销,所以 SVG 的渲染性能相对比较低。
因为 SVG 的一个图形对应一个元素,所以我们可以像处理 DOM 元素一样,很容易地给 SVG 图形元素添加对应的鼠标事件。这可以让图形的用户交互非常简单。
# SVG 性能问题
在一般情况下,当 SVG 节点超过一千个的时候,就能很明显感觉到性能问题了。
对于 SVG 的性能问题,也是有解决方案的。比如可以使用虚拟 DOM 方案来尽可能地减少重绘,这样就可以优化 SVG 的渲染。但是这些方案只能解决一部分问题,当节点数太多时,这些方案也无能为力。这个时候,还是得依靠 Canvas 和 WebGL 来绘图,才能彻底解决问题。
那在上万个节点的可视化应用场景中,SVG 就真的一无是处了吗?当然不是。SVG 除了嵌入 HTML 文档的用法,还可以直接作为一种图像格式使用。所以,即使是在用 Canvas 和 WebGL 渲染的应用场景中,也依然可能会用到 SVG,将它作为一些局部的图形使用,这也会给应用实现带来方便。
# WebGL
# 计算机图形系统绘图基础
- 光栅(Raster):几乎所有的现代图形系统都是基于光栅来绘制图形的,光栅就是指构成图像的像素阵列。
- 像素(Pixel):一个像素对应图像上的一个点,它通常保存图像上的某个具体位置的颜色等信息。
- 帧缓存(Frame Buffer):在绘图过程中,像素信息被存放于帧缓存中,帧缓存是一块内存地址。
- CPU(Central Processing Unit):中央处理单元,负责逻辑计算。
- GPU(Graphics Processing Unit):图形处理单元,负责图形计算。
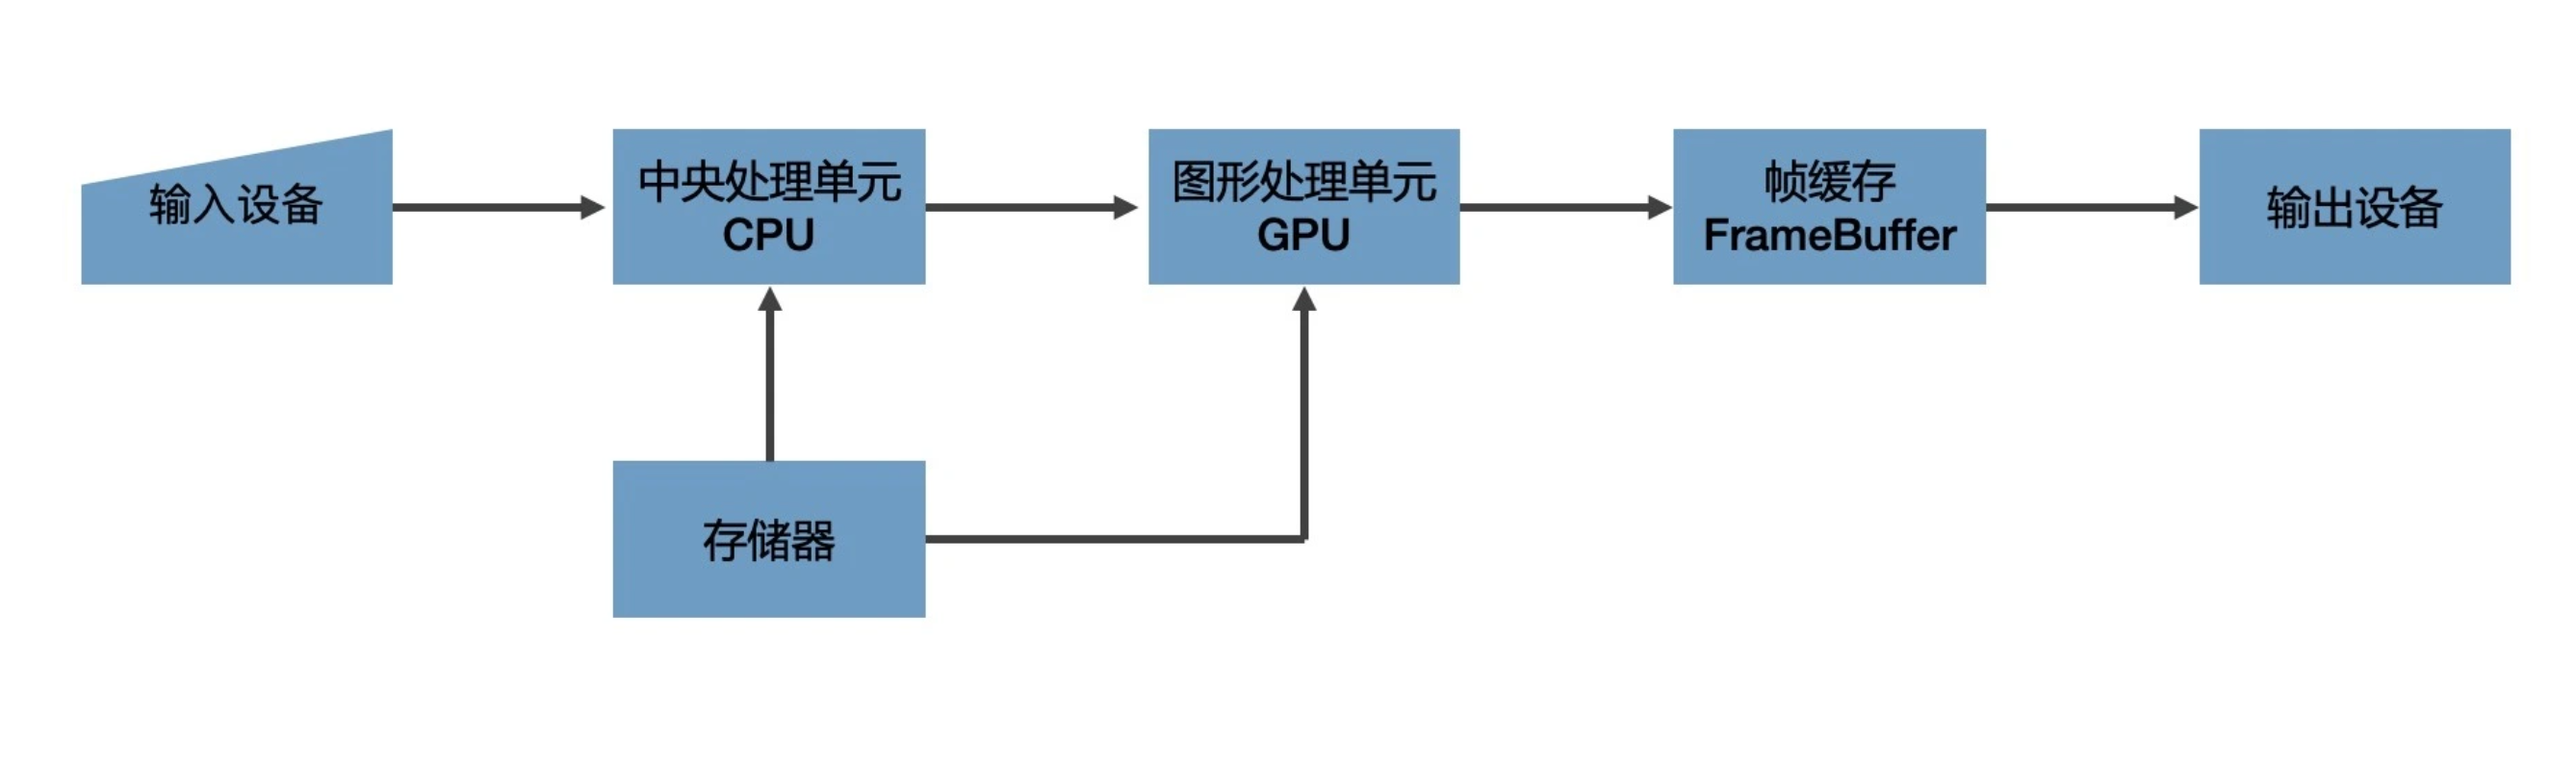
典型的绘图过程:数据经过 CPU 处理,成为具有特定结构的几何信息。然后,这些信息会被送到 GPU 中进行处理。在 GPU 中要经过两个步骤生成光栅信息。这些光栅信息会输出到帧缓存中,最后渲染到屏幕上。
图中的绘图过程是现代计算机中任意一种图形系统处理图形的通用过程。主要做了两件事,一是对给定的数据结合绘图的场景要素(例如相机、光源、遮挡物体等等)进行计算,最终将图形变为屏幕空间的 2D 坐标。二是为屏幕空间的每个像素点进行着色,把最终完成的图形输出到显示设备上。
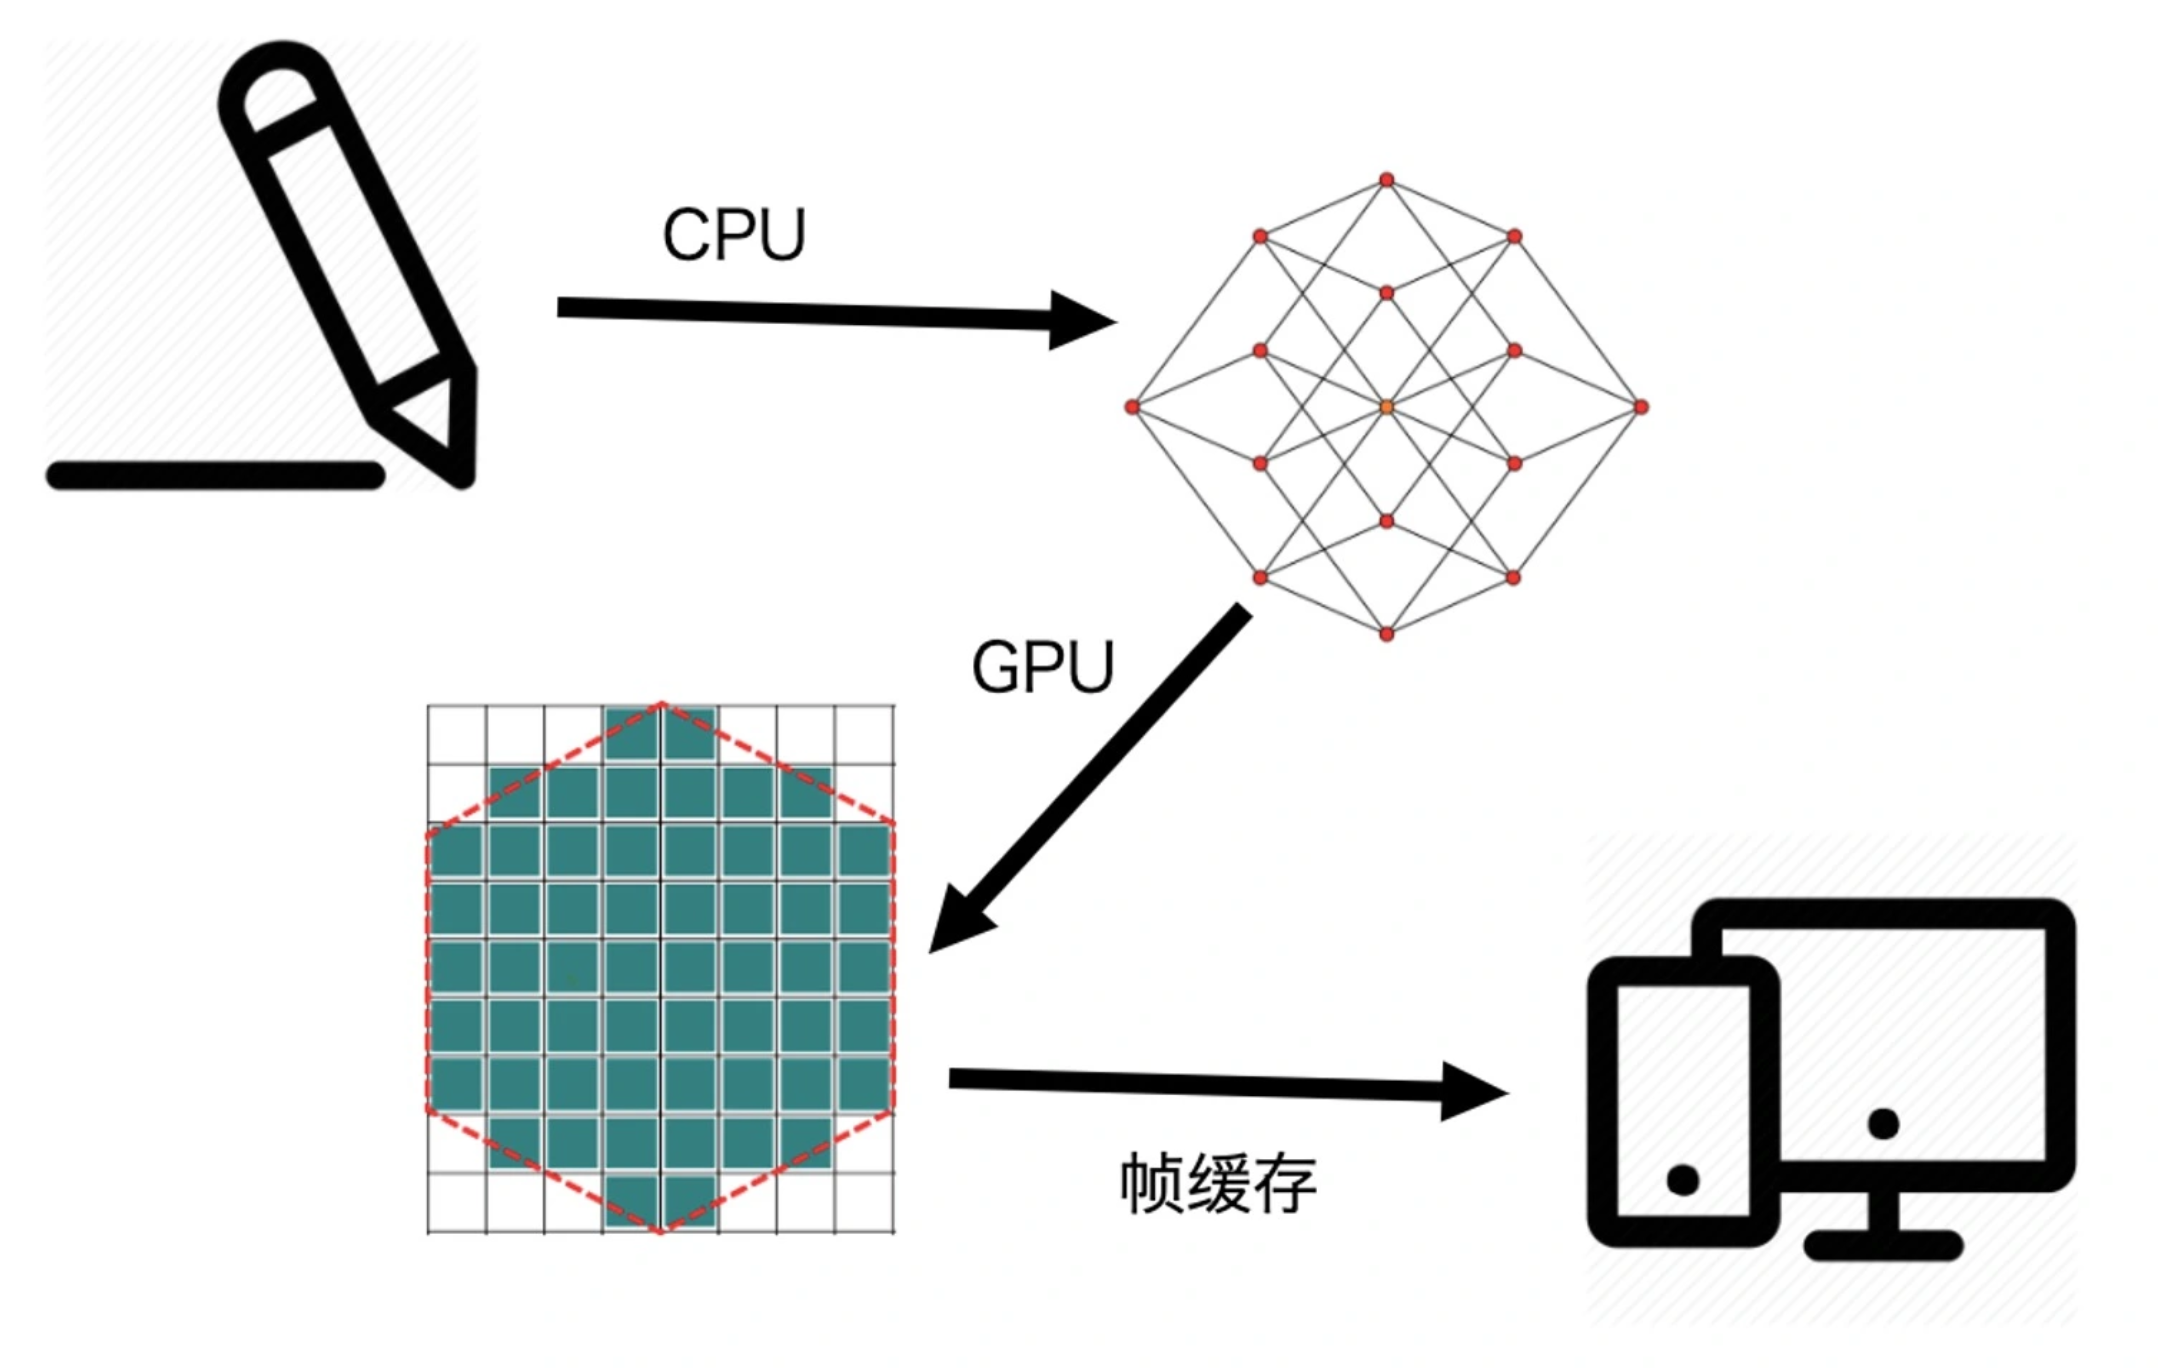
这个过程是一步一步进行的,前一步的输出就是后一步的输入,所以我们也把这个过程叫做渲染管线(RenderPipelines)。
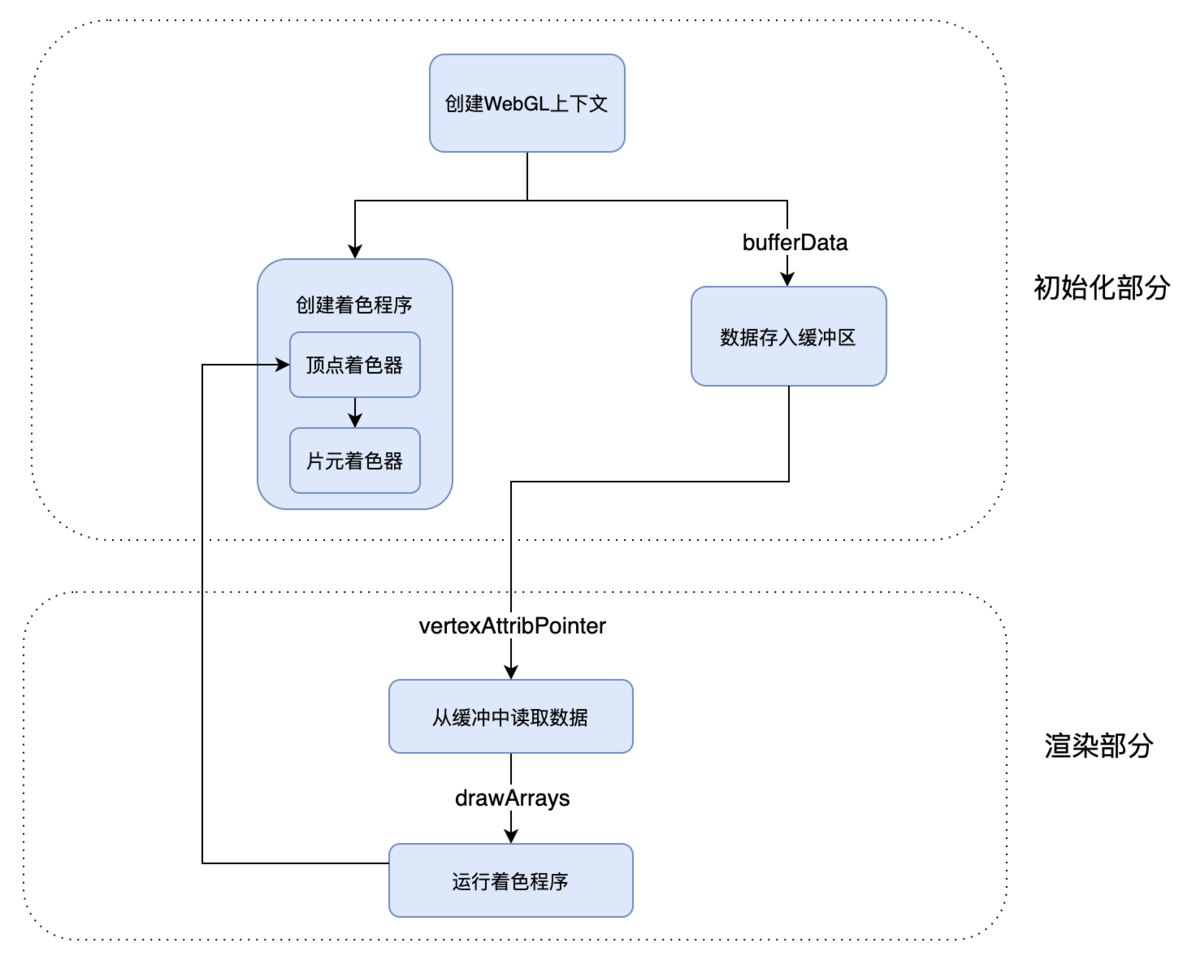
# 用 WebGL 绘制三角形
整体步骤:
- 创建 WebGL 上下文
- 创建 WebGL 程序(WebGL Program)
- 将数据存入缓冲区
- 将缓冲区数据读取到 GPU
- GPU 执行 WebGL 程序,输出结果
# 1. 创建 WebGL 上下文
// 1、创建 WebGL 上下文
const canvas = document.querySelector('#demo6-canvas');
const gl = canvas.getContext('webgl');
# 2. 创建 WebGL 程序
// 2、创建 WebGL 程序
// 2.1、编写着色器
// 顶点着色器
const vertex = `
  attribute vec2 position;
  varying vec3 color;
  void main() {
    gl_PointSize = 1.0;
    color = vec3(0.5 + position * 0.5, 0.0);
    gl_Position = vec4(position * 0.5, 1.0, 1.0);
  }
`;
// 片段着色器
const fragment = `
  precision mediump float;
  varying vec3 color;

  void main() {
    gl_FragColor = vec4(color, 1.0);
  }
`;
// 2.2、创建 shader 对象
const vertexShader = gl.createShader(gl.VERTEX_SHADER);
gl.shaderSource(vertexShader, vertex);
gl.compileShader(vertexShader);

const fragmentShader = gl.createShader(gl.FRAGMENT_SHADER);
gl.shaderSource(fragmentShader, fragment);
gl.compileShader(fragmentShader);

// 2.3、创建 WebGLProgram 程序对象
const program = gl.createProgram();
gl.attachShader(program, vertexShader);
gl.attachShader(program, fragmentShader);
gl.linkProgram(program);

// 3、启用 WebGLProgram 对象
gl.useProgram(program);
顶点着色器 (Vertex Shader)负责处理图形的顶点信息,片元着色器 (Fragment Shader)负责处理图形的像素信息。
可以把顶点着色器理解为处理顶点的 GPU 程序代码。它可以改变顶点的信息(如顶点的坐标、法线方向、材质等等),从而改变绘制出来的图形的形状或者大小等等。
顶点处理完成之后,WebGL 就会根据顶点和绘图模式指定的图元,计算出需要着色的像素点,然后对它们执行片元着色器程序。
WebGL 从顶点着色器和图元提取像素点给片元着色器执行代码的过程,就是生成光栅信息的过程,也叫光栅化过程。所以,片元着色器的作用,就是处理光栅化后的像素信息。
因为图元是 WebGL 可以直接处理的图形单元,所以其他非图元的图形最终必须要转换为图元才可以被 WebGL 处理。片元着色器对像素点着色的过程是并行的。也就是说,无论有多少个像素点,片元着色器都可以同时处理。
在片元着色器里,可以通过设置 gl_FragColor 的值来定义和改变图形的颜色。gl_FragColor 是 WebGL 片元着色器的内置变量,表示当前像素点颜色,它是一个用 RGBA 色值表示的四维向量数据。
WebGL 可以并行地对整个三角形的所有像素点同时运行片元着色器。不论这个三角形是大还是小,有几十个像素点还是上百万个像素点,GPU 都是同时处理每个像素点的。
# 步骤3. 将数据存入缓冲区
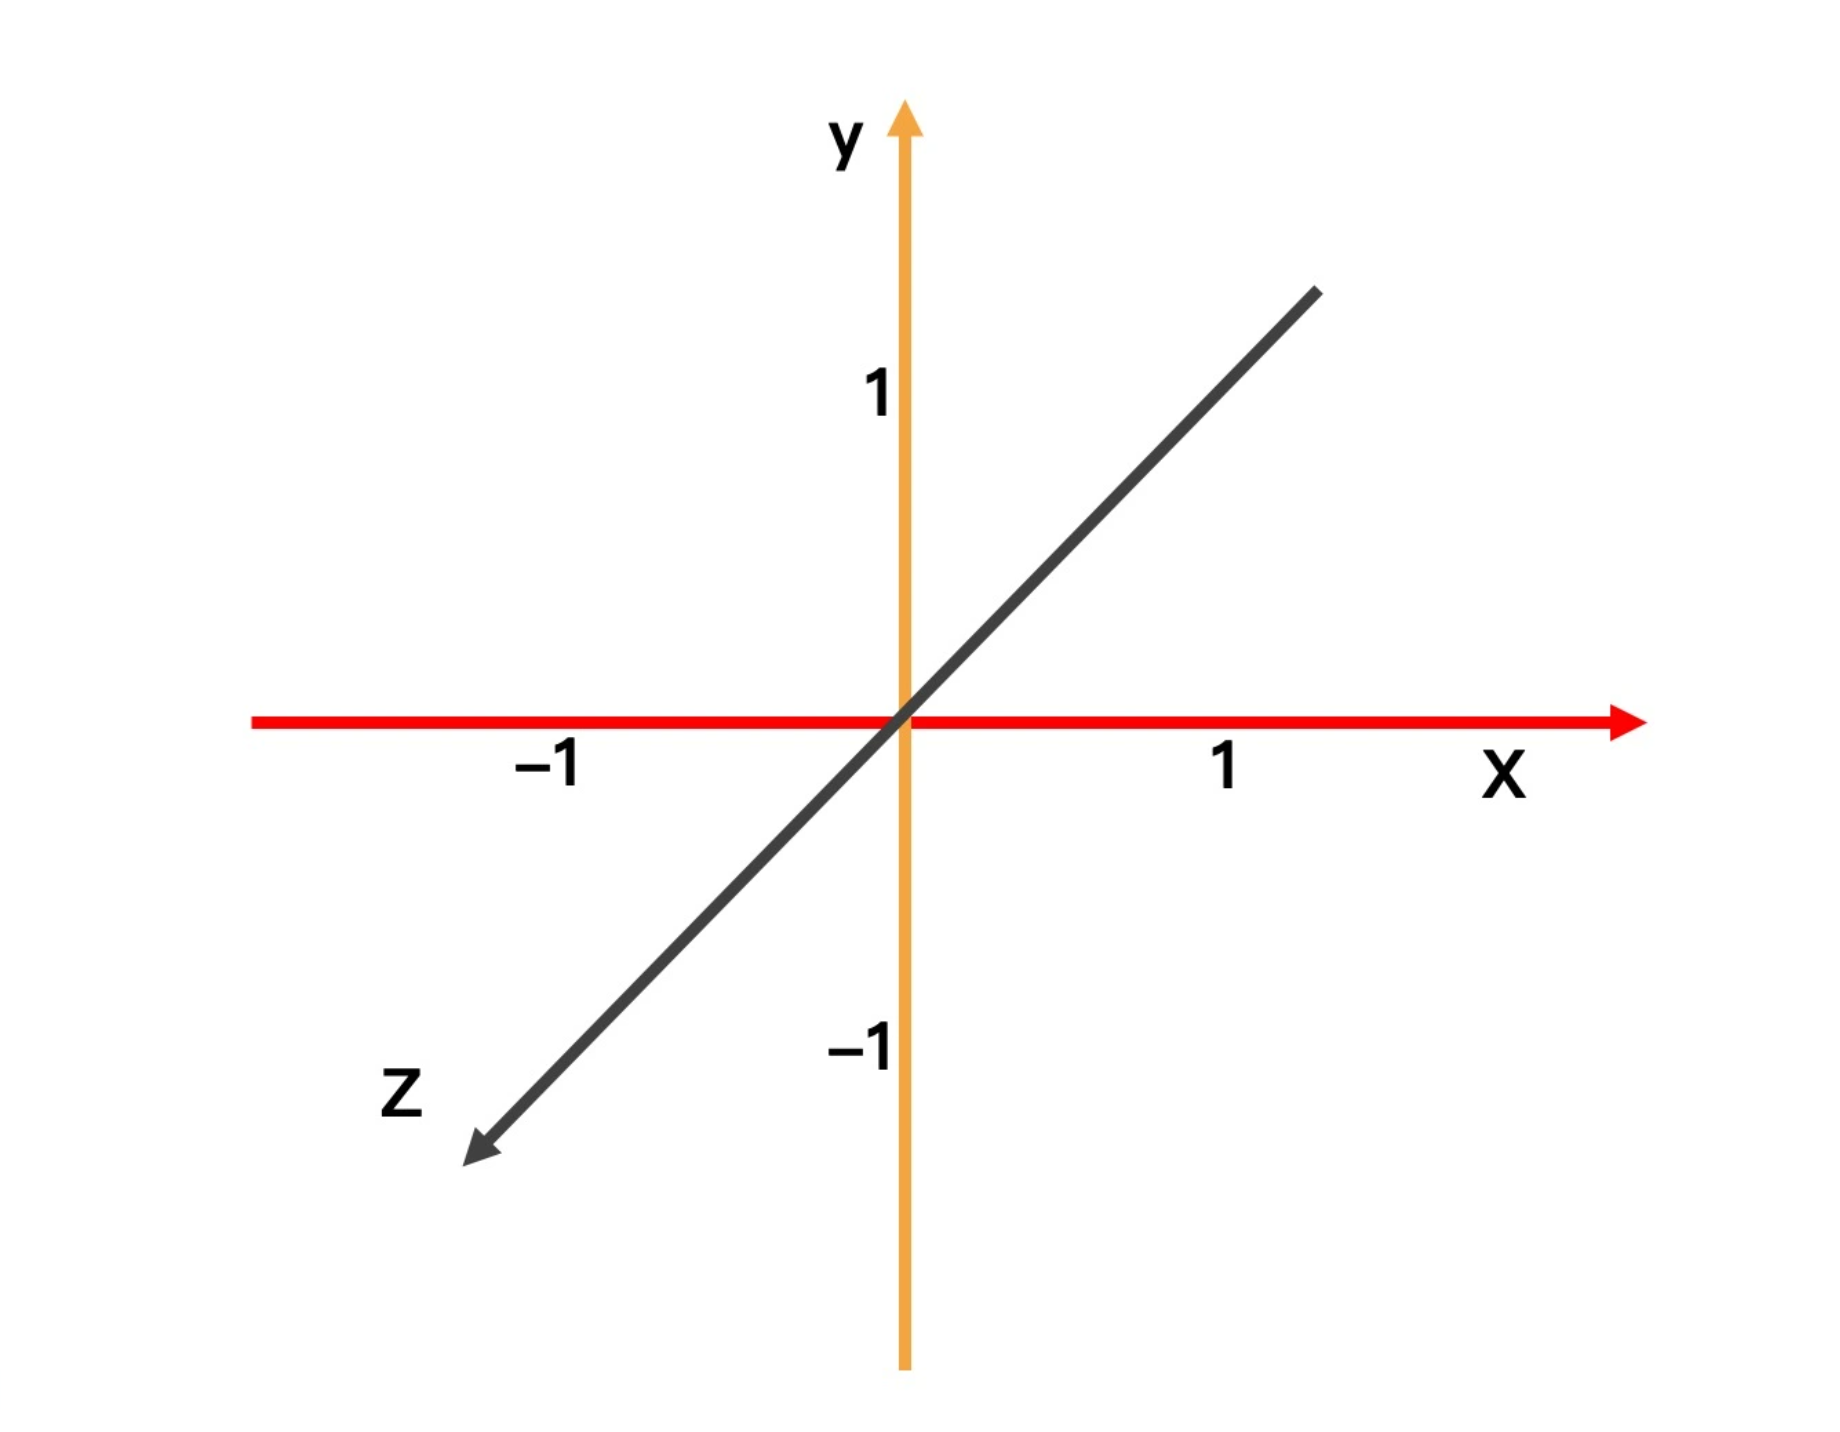
WebGL 的坐标系是一个三维空间坐标系,坐标原点是(0,0,0)。其中,x 轴朝右,y 轴朝上,z 轴朝外,是一个右手坐标系。
WebGL 使用的数据需要用类型数组定义,默认格式是 Float32Array。Float32Array 是 JavaScript 的一种 类型化数组(TypedArray) (opens new window),JavaScript 通常用类型化数组来处理二进制缓冲区。
// 4、创建顶点数据
const points = new Float32Array([
  -1, -1,
  0, 1,
  1, -1
]);

// 5、创建缓冲区对象
const buffer = gl.createBuffer();
gl.bindBuffer(gl.ARRAY_BUFFER, buffer);
gl.bufferData(gl.ARRAY_BUFFER, points, gl.STATIC_DRAW);
# 步骤4. 将缓冲区数据读取到 GPU
// 6、启用顶点属性
const positionLocation = gl.getAttribLocation(program, 'position'); // 获取顶点着色器中的 position 变量的地址
gl.vertexAttribPointer(positionLocation, 2, gl.FLOAT, false, 0, 0); // 给变量设置长度、类型等
gl.enableVertexAttribArray(positionLocation); // 启用顶点属性
# 步骤5. GPU 执行 WebGL 程序,输出结果
// 7、执行绘制
gl.clear(gl.COLOR_BUFFER_BIT);
gl.drawArrays(gl.TRIANGLES, 0, points.length / 2);<html>
<body>
<div class="demo6">
<canvas id="demo6-canvas" width="300" height="300"></canvas>
</div>
</body>
</html>
<script>
// 1、创建 WebGL 上下文
const canvas = document.querySelector('#demo6-canvas');
const gl = canvas.getContext('webgl');
// 2、创建 WebGL 程序
// 2.1、编写着色器
// 顶点着色器
const vertex = `
attribute vec2 position;
varying vec3 color;
void main() {
gl_PointSize = 1.0;
color = vec3(0.5 + position * 0.5, 0.0);
gl_Position = vec4(position * 0.5, 1.0, 1.0);
}
`;
// 片段着色器
const fragment = `
precision mediump float;
varying vec3 color;
void main() {
gl_FragColor = vec4(color, 1.0);
}
`;
// 2.2、创建 shader 对象
const vertexShader = gl.createShader(gl.VERTEX_SHADER);
gl.shaderSource(vertexShader, vertex);
gl.compileShader(vertexShader);
const fragmentShader = gl.createShader(gl.FRAGMENT_SHADER);
gl.shaderSource(fragmentShader, fragment);
gl.compileShader(fragmentShader);
// 2.3、创建 WebGLProgram 程序对象
const program = gl.createProgram();
gl.attachShader(program, vertexShader);
gl.attachShader(program, fragmentShader);
gl.linkProgram(program);
// 3、启用 WebGLProgram 对象
gl.useProgram(program);
// 4、创建顶点数据
const points = new Float32Array([
-1, -1,
0, 1,
1, -1
]);
// 5、创建缓冲区对象
const buffer = gl.createBuffer();
gl.bindBuffer(gl.ARRAY_BUFFER, buffer);
gl.bufferData(gl.ARRAY_BUFFER, points, gl.STATIC_DRAW);
// 6、启用顶点属性
const positionLocation = gl.getAttribLocation(program, 'position'); // 获取顶点着色器中的 position 变量的地址
gl.vertexAttribPointer(positionLocation, 2, gl.FLOAT, false, 0, 0); // 给变量设置长度、类型等
gl.enableVertexAttribArray(positionLocation); // 启用顶点属性
// 7、执行绘制
gl.clear(gl.COLOR_BUFFER_BIT);
gl.drawArrays(gl.TRIANGLES, 0, points.length / 2);
</script>
<style>
.demo6 {
display: inline-block;
border: 1px solid #ccc;
}
</style># WebGL 绘图过程
本文参与 腾讯云自媒体同步曝光计划,分享自作者个人站点/博客。
原始发表:2020/11/25,如有侵权请联系 cloudcommunity@tencent.com 删除
评论
登录后参与评论
推荐阅读
目录
腾讯云开发者

Copyright © 2013 - 2026 Tencent Cloud. All Rights Reserved. 腾讯云 版权所有
深圳市腾讯计算机系统有限公司 ICP备案/许可证号:粤B2-20090059 ![]() 粤公网安备44030502008569号
粤公网安备44030502008569号
腾讯云计算(北京)有限责任公司 京ICP证150476号 | 京ICP备11018762号