使用python绘制wrf中的土地利用类型
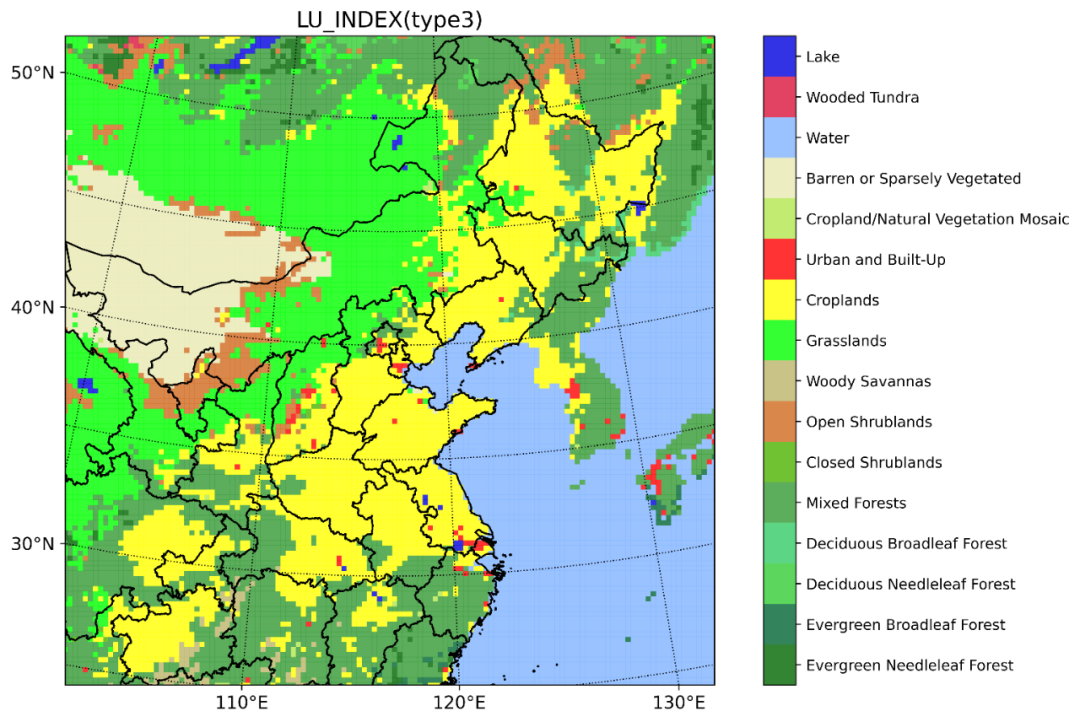
利用python中的cartopy、wrf-python等库,绘制wrf中的土地利用类型。主要使用了pcolormesh函数进行绘制,绘制效果如下:

type3
原始版本
主要参考了Python气象数据处理与绘图:绘制WRF模式模拟所用的土地利用数据来进行绘制。
具体使用的版本如下:
cartopy 0.18.0 matplotlib 3.5.1 wrf-python 1.3.3
其他库如下,一般版本也没啥大的限制,就没有一一列举了。
import numpy as np
from netCDF4 import Dataset
import matplotlib.pyplot as plt
from matplotlib.colors import ListedColormap
import cartopy.crs as ccrs
from cartopy.io.shapereader import Reader
from cartopy.mpl.gridliner import LATITUDE_FORMATTER, LONGITUDE_FORMATTER
import shapely.geometry as sgeom
from copy import copy
from wrf import to_np, getvar,get_cartopy, cartopy_xlim, cartopy_ylim, latlon_coords
import warnings
关于地图设置方面未作改动,直接使用。
def find_side(ls, side):
    """
    Given a shapely LineString which is assumed to be rectangular, return the
    line corresponding to a given side of the rectangle.
    """
    minx, miny, maxx, maxy = ls.bounds
    points = {'left': [(minx, miny), (minx, maxy)],
              'right': [(maxx, miny), (maxx, maxy)],
              'bottom': [(minx, miny), (maxx, miny)],
              'top': [(minx, maxy), (maxx, maxy)],}
    return sgeom.LineString(points[side])

def lambert_xticks(ax, ticks):
    """Draw ticks on the bottom x-axis of a Lambert Conformal projection."""
    te = lambda xy: xy[0]
    lc = lambda t, n, b: np.vstack((np.zeros(n) + t, np.linspace(b[2], b[3], n))).T
    xticks, xticklabels = _lambert_ticks(ax, ticks, 'bottom', lc, te)
    ax.xaxis.tick_bottom()
    ax.set_xticks(xticks)
    ax.set_xticklabels([ax.xaxis.get_major_formatter()(xtick) for xtick in xticklabels])

def lambert_yticks(ax, ticks):
    """Draw ricks on the left y-axis of a Lamber Conformal projection."""
    te = lambda xy: xy[1]
    lc = lambda t, n, b: np.vstack((np.linspace(b[0], b[1], n), np.zeros(n) + t)).T
    yticks, yticklabels = _lambert_ticks(ax, ticks, 'left', lc, te)
    ax.yaxis.tick_left()
    ax.set_yticks(yticks)
    ax.set_yticklabels([ax.yaxis.get_major_formatter()(ytick) for ytick in yticklabels])

def _lambert_ticks(ax, ticks, tick_location, line_constructor, tick_extractor):
    """Get the tick locations and labels for an axis of a Lambert Conformal projection."""
    outline_patch = sgeom.LineString(ax.outline_patch.get_path().vertices.tolist())
    axis = find_side(outline_patch, tick_location)
    n_steps = 30
    extent = ax.get_extent(ccrs.PlateCarree())
    _ticks = []
    for t in ticks:
        xy = line_constructor(t, n_steps, extent)
        proj_xyz = ax.projection.transform_points(ccrs.Geodetic(), xy[:, 0], xy[:, 1])
        xyt = proj_xyz[..., :2]
        ls = sgeom.LineString(xyt.tolist())
        locs = axis.intersection(ls)
        if not locs:
            tick = [None]
        else:
            tick = tick_extractor(locs.xy)
        _ticks.append(tick[0])
    # Remove ticks that aren't visible:
    ticklabels = copy(ticks)
    while True:
        try:
            index = _ticks.index(None)
        except ValueError:
            break
        _ticks.pop(index)
        ticklabels.pop(index)
    return _ticks, ticklabels
修改的部分
主要是把涉及到的土地利用类型刻度和label值单独放到了函数中。
def LU_MODIS21(uniq=np.arange(1, 22)):
    inds = uniq-1
    C = np.array([
    [0,.4,0],          #  1 Evergreen Needleleaf Forest
    [0,.4,.2],         #  2 Evergreen Broadleaf Forest
    [.2,.8,.2],        #  3 Deciduous Needleleaf Forest
    [.2,.8,.4],        #  4 Deciduous Broadleaf Forest
    [.2,.6,.2],        #  5 Mixed Forests
    [.3,.7,0],         #  6 Closed Shrublands
    [.82,.41,.12],     #  7 Open Shurblands
    [.74,.71,.41],     #  8 Woody Savannas
    [1,.84,.0],        #  9 Savannas
    [0,1,0],           #  10 Grasslands
    [0,1,1],           #  11 Permanant Wetlands
    [1,1,0],           #  12 Croplands
    [1,0,0],           #  13 Urban and Built-up
    [.7,.9,.3],        #  14 Cropland/Natual Vegation Mosaic
    [1,1,1],           #  15 Snow and Ice
    [.914,.914,.7],    #  16 Barren or Sparsely Vegetated
    [.5,.7,1],         #  17 Water (like oceans)
    [.86,.08,.23],     #  18 Wooded Tundra
    [.97,.5,.31],      #  19 Mixed Tundra
    [.91,.59,.48],     #  20 Barren Tundra
    [0,0,.88]])        #  21 Lake

    cm = ListedColormap(C[inds])

    labels = ['Evergreen Needleleaf Forest',
            'Evergreen Broadleaf Forest',
            'Deciduous Needleleaf Forest',
            'Deciduous Broadleaf Forest',
            'Mixed Forests',
            'Closed Shrublands',
            'Open Shrublands',
            'Woody Savannas',
            'Savannas',
            'Grasslands',
            'Permanent Wetlands',
            'Croplands',
            'Urban and Built-Up',
            'Cropland/Natural Vegetation Mosaic',
            'Snow and Ice',
            'Barren or Sparsely Vegetated',
            'Water',
            'Wooded Tundra',
            'Mixed Tundra',
            'Barren Tundra',
            'Lake']

    return cm, np.array(labels)[inds]

def ld1(landuse):
    # type 1:
    cm, labels = LU_MODIS21()
    ticks = [x+1.5 for x in range(len(labels))]

    n_max = len(labels)
    return to_np(landuse), ticks, labels, cm, n_max

def start(file_in, shp_path):
    ncfile = Dataset(file_in)
    landuse = getvar(ncfile, 'LU_INDEX')
    lats, lons = latlon_coords(landuse)
    cart_proj = get_cartopy(landuse)

    # Create a figure
    fig = plt.figure(figsize=(12,8))

    # Set the GeoAxes to the projection used by WRF
    ax = plt.axes(projection=cart_proj)

    # Use the data extent
    ax.set_xlim(cartopy_xlim(landuse))
    ax.set_ylim(cartopy_ylim(landuse))

    # # Plot data
    landuse_new, ticks, labels, cm, n_max = ld1(landuse)

    im = ax.pcolormesh(to_np(lons), to_np(lats), landuse_new, vmin=1, vmax=n_max+1,
                    cmap=cm, alpha=0.8, transform=ccrs.PlateCarree())
    cbar = fig.colorbar(im, ax=ax)
    cbar.set_ticks(ticks)
    cbar.ax.set_yticklabels(labels)

    # Add the gridlines
    ax.gridlines(color="black", linestyle="dotted")

    # add xticks and yticks
    xticks = list(np.arange(70, 140, 10))
    yticks = list(np.arange(0, 60, 10))
    fig.canvas.draw()
    ax.xaxis.set_major_formatter(LONGITUDE_FORMATTER)
    ax.yaxis.set_major_formatter(LATITUDE_FORMATTER)
    lambert_xticks(ax, xticks)
    lambert_yticks(ax, yticks)

    # 叠加shp
    ax.add_geometries(Reader(shp_path).geometries(), ccrs.PlateCarree(), lw=1.2, facecolor='none')

    # Set the labelsize
    plt.tick_params(labelsize=12)

    # Add title
    title = 'LU_INDEX(type1)'

    pic_name = r'E:\Python使用\WRF运行\绘图\土地利用类型\图片\type1.png'
    plt.title(title, fontsize=15)
    fig.savefig(pic_name, bbox_inches='tight', dpi=600)
    plt.close()
    print('土地利用绘制完毕')

def main():
    file_in = r'E:\geo_em.d01.nc'
    shp_path = 'E:\Python使用\生成shp\中国\中国.shp'
    start(file_in, shp_path)

if __name__ == '__main__':
    main()
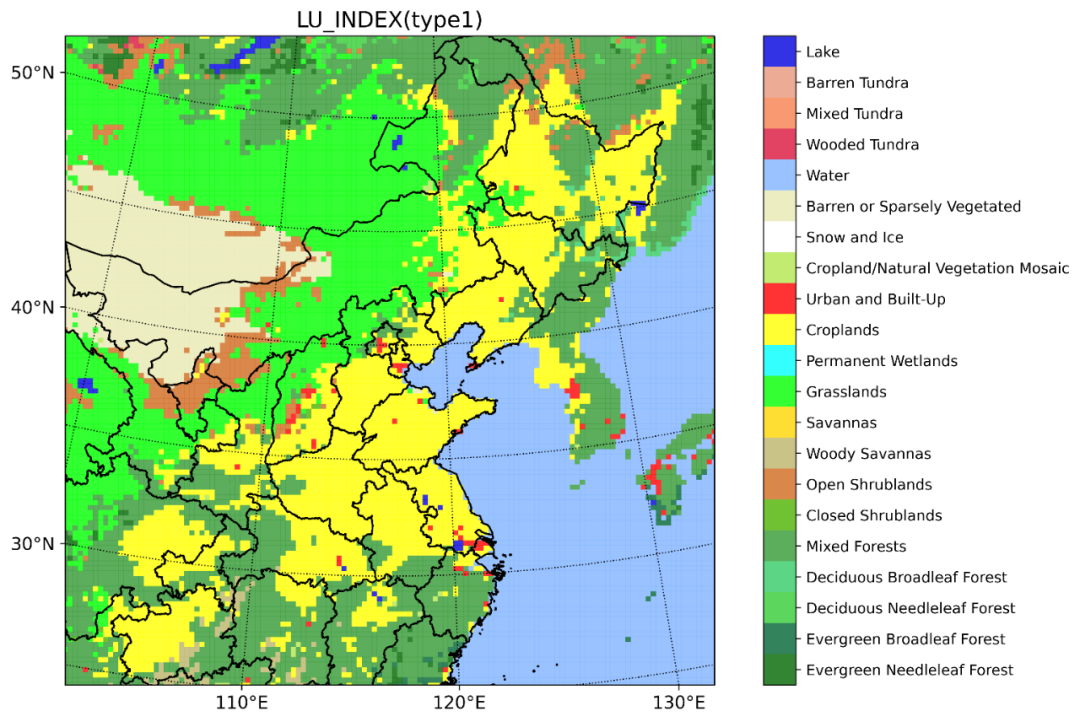
绘制得到的效果如下:

type1
修改思路1
其实得到上面的效果也不错,和之前文章的效果类似。
但同时不禁让人产生一个疑问,右边的colorbar中存在21类,但实际的nc数据中是否真的存在这么多?
话不多说,输出nc数据测试一下。
将读取的landuse唯一值进行输出,即:
print(np.unique(landuse).astype(int))

输出结果:[ 1 2 3 4 5 6 7 8 10 12 13 14 16 17 18 21]
可以发现少了9、11、15、19、20这些类,对应的具体名称可以去看用户手册,这里不再细说。
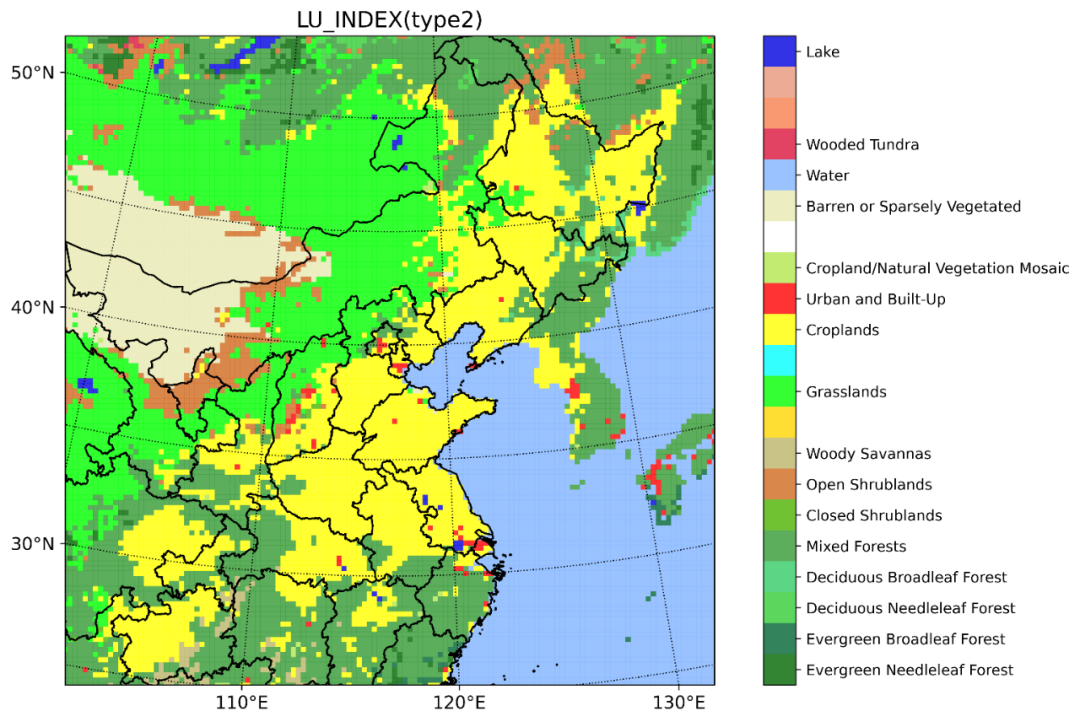
因此考虑colorbar中仅显示出现的类型,不存在的类型则不显示相应的值,新增的对应函数如下:
def ld2(landuse):
    # type 2:
    uniq = np.unique(landuse).astype(int)
    cm, label = LU_MODIS21()

    ticks = [x+0.5 for x in uniq]
    labels = [label[x-1] for x in uniq]
    n_max = len(label)
    return to_np(landuse), ticks, labels, cm, n_max
只需要将原来程序中调用的ld1(landuse)换成ld2(landuse)即可。得到如下图的效果,可以看到缺少的9、11、15、19、20已经没有显示了,这样也能直观的看到LU_INDEX文件中仅有哪些类型。

type2
修改思路2
这时候强迫症又犯了,觉得colorbar中缺少了一些对应的值,实在不好看,因此考虑在colorbar中将对应颜色删除。修改思路是将landuse中对应的值进行映射,从1到最多种类值进行排序并标号,比如上面的nc文件中缺少了5种类型,最多种类值为16,则新生成的映射应该是从1,2,3...16,其中需要将10变为9,12变为10,最终效果是为了和前面对应,统一对应颜色,方便比较。使用的具体函数如下:
def ld3(landuse):
    # type 3:
    uniq = np.unique(landuse).astype(int)
    cm, labels = LU_MODIS21(uniq)
    links = {val:ind+1 for ind, val in enumerate(uniq)}
    landuse_new = np.vectorize(links.get)(to_np(landuse))

    ticks = np.arange(1.5, len(labels)+1)
    n_max = len(labels)
    return landuse_new, ticks, labels, cm, n_max
使用方法还是ld1(landuse)换成ld3(landuse)。显示效果如下:

type3
小结
因为之前陆续有朋友问过我有关土地利用类型绘制的问题,所以就把自己绘制和改进的思路进行分享了。
其中还有一些可以继续改进的,包括受cartopy_xlim, cartopy_ylim限制导致四条边上的格点仅显示半个面积,还有颜色调整和优化等一系列工作。
相关py脚本和数据放到网盘上了,公众号下后台回复luindex获取下载链接。
如果大家有其他思路和改进方法的,欢迎积极投稿和分享~~
Reference
[1] [Python气象数据处理与绘图:绘制WRF模式模拟所用的土地利用数据] (https://mp.weixin.qq.com/s/EdC_Z2QoNiWkQ3gvLFvfKg)
[2] [如何优雅地用字典dict映射numpy array:map和np.vectorize] (https://blog.csdn.net/weixin_39925939/article/details/121684088)
本文参与 腾讯云自媒体同步曝光计划,分享自微信公众号。
原始发表:2023-03-12,如有侵权请联系 cloudcommunity@tencent.com 删除
评论
登录后参与评论
推荐阅读
目录


