scRNA分析| 和SCI学 定制化聚类点图(Dotplot ),含二行代码出图方式
scRNA分析| 和SCI学 定制化聚类点图(Dotplot ),含二行代码出图方式

单细胞常见的可视化方式有DimPlot,FeaturePlot ,DotPlot ,VlnPlot 和 DoHeatmap集中 ,在Seurat中均可以实现,但文献中的图大多会精美很多。之前 scRNA复现|所见即所得,和Cell学umap,plot1cell完成惊艳的细胞注释umap图介绍了一种绘制惊艳umap图的方式;在跟SCI学umap图| ggplot2 绘制umap图,坐标位置 ,颜色 ,大小还不是你说了算 介绍过DimPlot的一些调整方法;在 scRNA分析 | 定制 美化FeaturePlot 图,你需要的都在这介绍了DotPlot的美化方式。
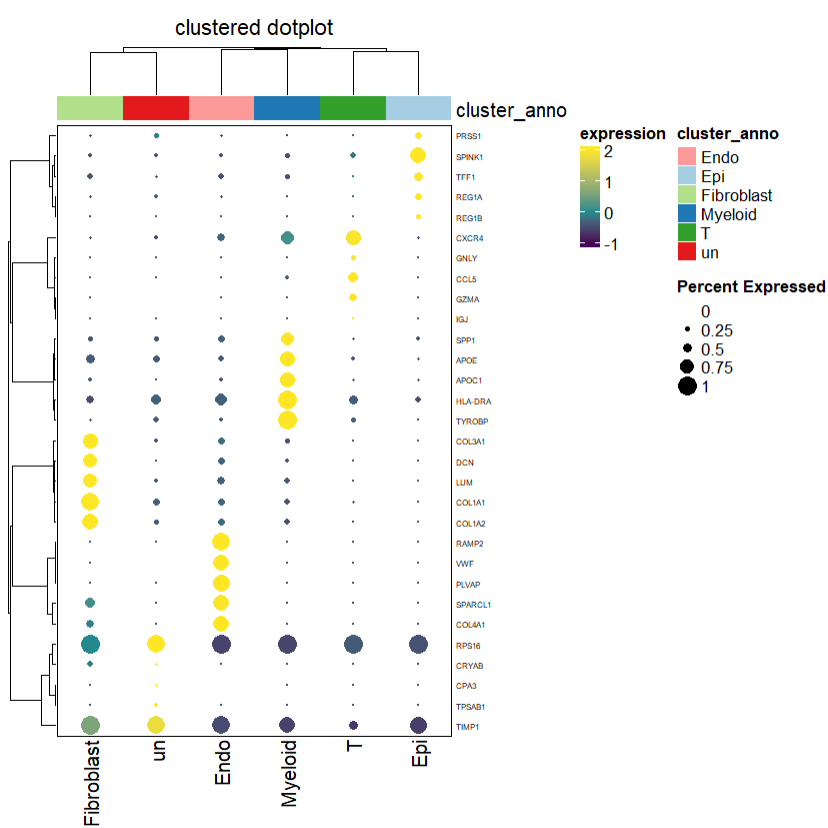
本次介绍一下如何绘制SCI文献中高水平的聚类DotPlot,以及一些调整,美化的方法。
(1)Seurat优化点的颜色 ,大小,主题,翻转等
(2)complexheatmap 自定义聚类点图
(3)scCustomize 一键式得到聚类点图
一 载入R包,数据
仍然使用之前注释过的sce.anno.RData数据 ,后台回复 anno 即可获取
library(Seurat)
library(tidyverse)
library(scCustomize) # 需要Seurat版本4.3.0
library(viridis)
library(RColorBrewer)
library(gridExtra)

load("sce.anno.RData")
head(sce2,2)
二 Seurat 调整,美化
1,计算marker 基因
首先计算marker基因,然后使用seurat的DotPlot函数绘制初始的点图
all_markers <- FindAllMarkers(object = sce2)
save(all_markers,file = "all_markers.RData")

top5 <- all_markers %>% group_by(cluster) %>% top_n(5, avg_log2FC)
##Seurat 初始点图
DotPlot(sce2,features = unique(top5$gene) ,assay='RNA')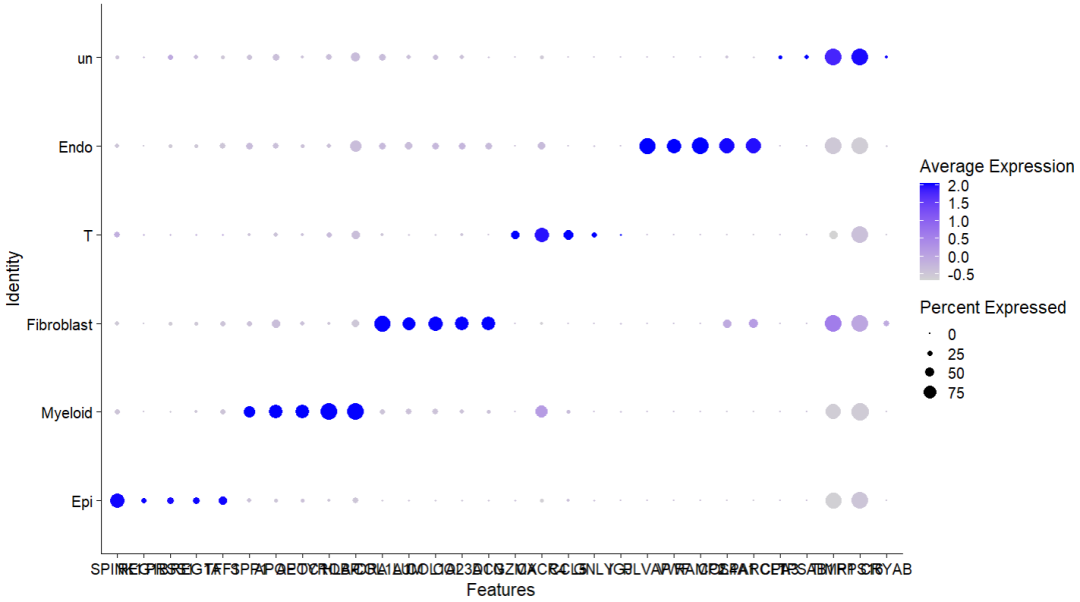
可以看到待调整的地方很多(1)横坐标轴标签重叠(2)点的颜色(3)方向翻转等。
2,优化颜色,大小,方向
这里同样也可以使用ggplot2 的一些函数进行美化,例如本例中的 coord_flip 调整翻转与否,theme中调整坐标轴字体,角度等;guide调整legend ,scale调整颜色等
p1 <- DotPlot(sce2, features = unique(top5$gene) ,
        assay='RNA' ) +
  coord_flip() + #翻转
  theme(panel.grid = element_blank(),
        axis.text.x=element_text(angle = 45, hjust = 0.5,vjust=0.5))+ #轴标签
  labs(x=NULL,y=NULL) +
  guides(size = guide_legend("Percent Expression") )+ #legend
  scale_color_gradientn(colours = c('#330066','#336699','#66CC66','#FFCC33')) #颜色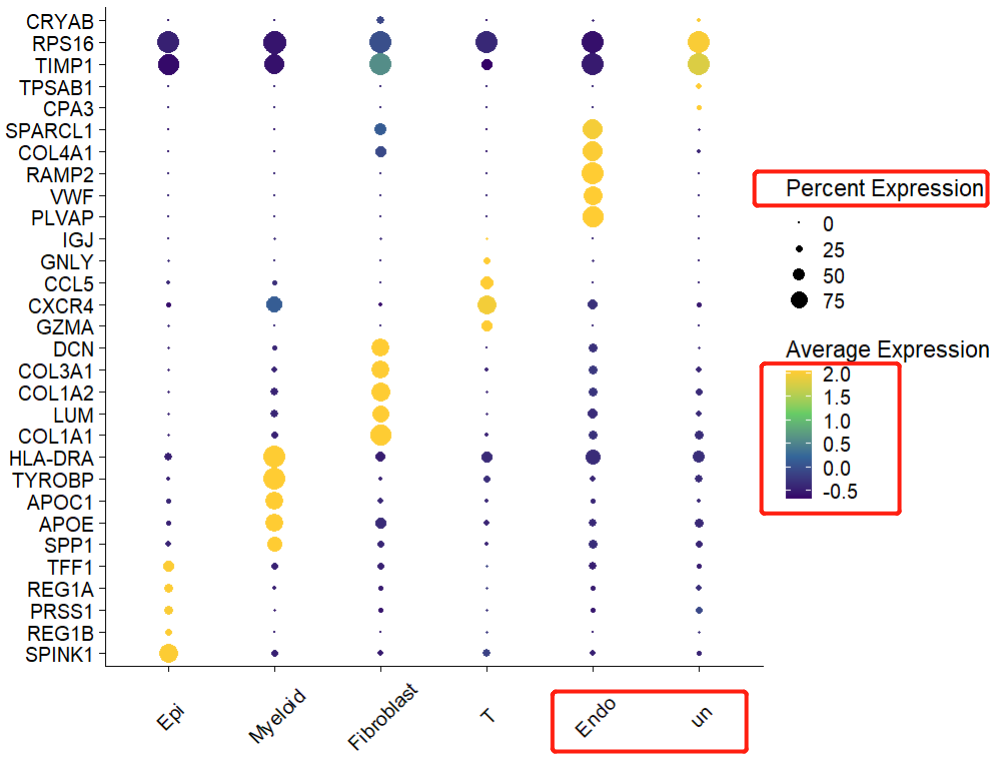
三 “定制” 聚类点图
根据https://divingintogeneticsandgenomics.com/post/clustered-dotplot-for-single-cell-rnaseq/学习参数定制,使用complexheatmap 绘制聚类点图,这里的参数较多,个人建议耐心看下去。
如果觉得这里比较繁琐的话,可以直接跳到最后的 四,scCustomize 一键出图 。
1,数据提取
提取上图中涉及到的 平均表达量矩阵 以及 表达比例矩阵 的数据。
可以通过自行计算获取,也可以直接 使用p1$data 函数在plot图中提取 ,很实用,使用ggplot2绘制的话也可以这样提取。
df<- p1$data
head(df)
           avg.exp  pct.exp features.plot  id avg.exp.scaled
SPINK1  29.6395822 84.81206        SPINK1 Epi      2.0224363
REG1B   13.5975520 28.69318         REG1B Epi      2.0299380
PRSS1   59.3600334 38.12281         PRSS1 Epi      2.0035976
REG1A  107.6708266 38.28671         REG1A Epi      2.0271501
TFF1    32.9818779 46.63462          TFF1 Epi      2.0212981
SPP1     0.7022139 23.78715          SPP1 Epi     -0.4283568
分别获取 pct.exp 和 avg.exp的矩阵
### the matrix for the scaled expression
exp_mat<-df %>%
  dplyr::select(-pct.exp, -avg.exp) %>%
  pivot_wider(names_from = id, values_from = avg.exp.scaled) %>%
  as.data.frame()
row.names(exp_mat) <- exp_mat$features.plot
exp_mat <- exp_mat[,-1] %>% as.matrix()

## the matrix for the percentage of cells express a gene
percent_mat<-df %>%
  dplyr::select(-avg.exp, -avg.exp.scaled) %>%
  pivot_wider(names_from = id, values_from = pct.exp) %>%
  as.data.frame()
row.names(percent_mat) <- percent_mat$features.plot
percent_mat <- percent_mat[,-1] %>% as.matrix()
2,complexheatmap 绘制点图
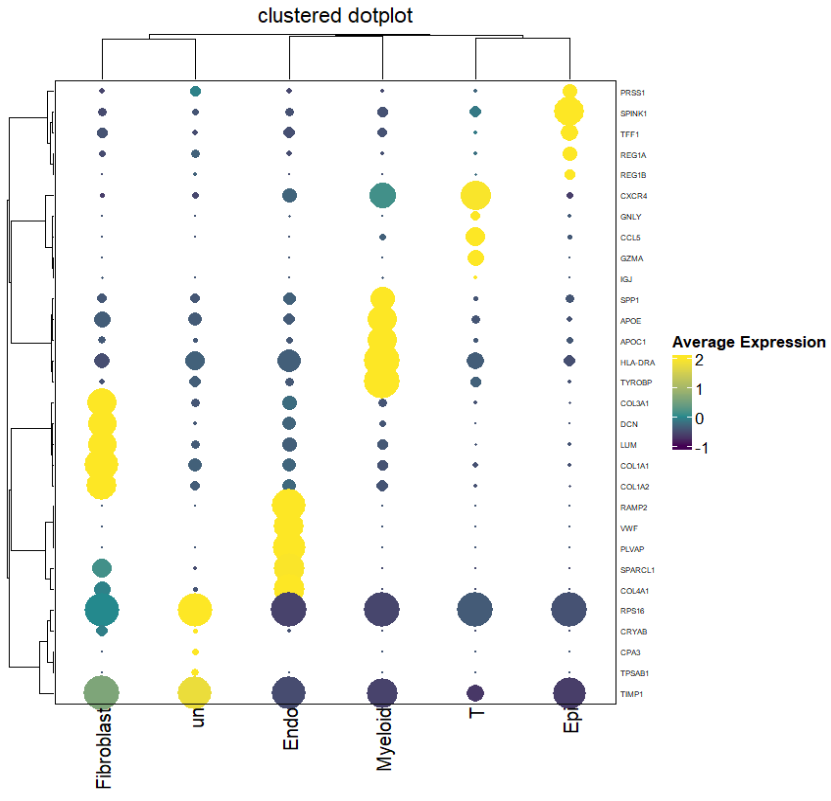
是的,complexheatmap 除了可以绘制热图,还可以绘制点图,强大不?去掉热图的方块(rect_gp = gpar(type = "none")),改为点(cell_fun),个人觉得这个想法很炫。
cell_fun = function(j, i, x, y, w, h, fill){
  grid.rect(x = x, y = y, width = w, height = h,
            gp = gpar(col = NA, fill = NA))
  grid.circle(x=x,y=y,r= percent_mat[i, j]/100 * min(unit.c(w, h)),
              gp = gpar(fill = col_fun(exp_mat[i, j]), col = NA))}

## also do a kmeans clustering for the genes with k = 4
Heatmap(exp_mat,
        heatmap_legend_param=list(title="Average Expression"),
        column_title = "clustered dotplot",
        col=col_fun,
        rect_gp = gpar(type = "none"),
        cell_fun = cell_fun,
        row_names_gp = gpar(fontsize = 3),
        #row_km = 4,
        border = "black")
这里可以设置km参数,设置后根据k值聚类为几簇。
3,添加celltype注释,细节调整
HeatmapAnnotation函数添加注释 ,颜色自定义;Heatmap函数自定义颜色,大小,legend等。
#注释信息 celltype
colnames(exp_mat)
cluster_anno<-  c("Epi", "Myeloid", "Fibroblast", "T" , "Endo" , "un"  )

column_ha<- HeatmapAnnotation(
  cluster_anno = cluster_anno,
  col = list(cluster_anno = setNames(brewer.pal(6, "Paired"), unique(cluster_anno))
  ),
  na_col = "grey"
)

Heatmap(exp_mat,
        heatmap_legend_param=list(title="Average Expression"),
        column_title = "clustered dotplot",
        col=col_fun,
        rect_gp = gpar(type = "none"),
        cell_fun = cell_fun,
        row_names_gp = gpar(fontsize = 5),
        #row_km = 4,
        border = "black",
        top_annotation = column_ha)
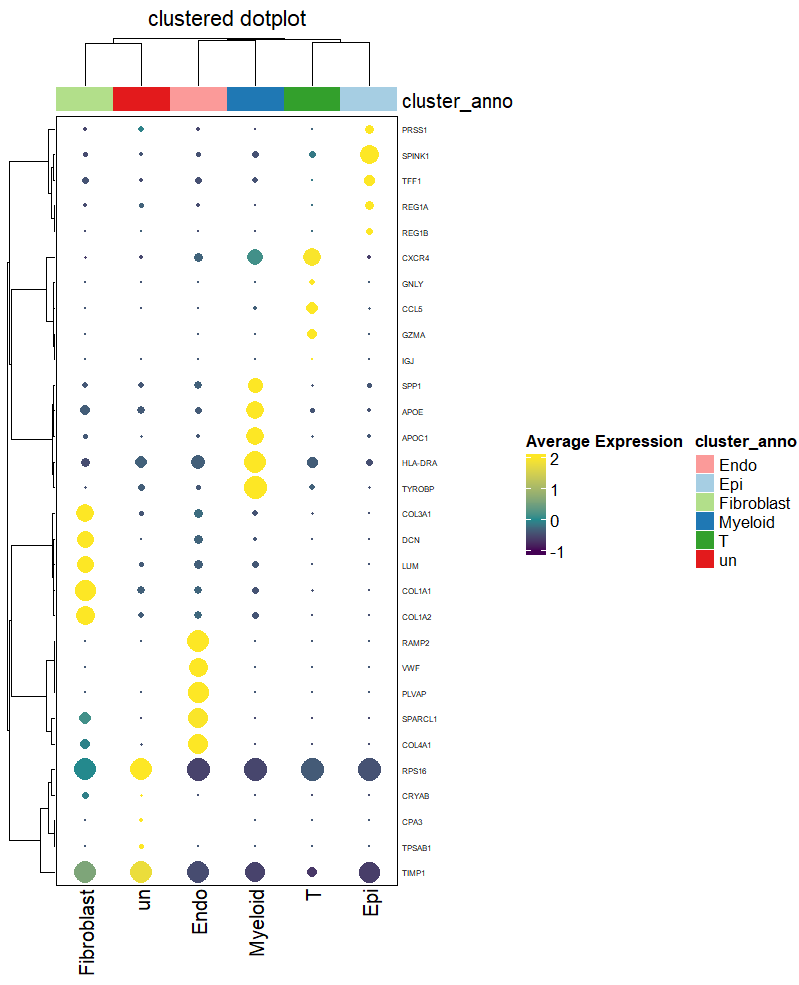
4,添加legend
对比发现还缺少 表达比例的legend , 作者提到了几种方法,这里使用grid.circle 方式,也是后面Clustered_DotPlot函数中的方式。
layer_fun = function(j, i, x, y, w, h, fill){
  grid.rect(x = x, y = y, width = w, height = h,
            gp = gpar(col = NA, fill = NA))
  grid.circle(x=x,y=y,r= pindex(percent_mat, i, j)/100 * unit(2, "mm"),
              gp = gpar(fill = col_fun(pindex(exp_mat, i, j)), col = NA))}

lgd_list = list(
  Legend( labels = c(0,0.25,0.5,0.75,1), title = "Percent Expressed",
          graphics = list(
            function(x, y, w, h) grid.circle(x = x, y = y, r = 0 * unit(2, "mm"),
                                             gp = gpar(fill = "black")),
            function(x, y, w, h) grid.circle(x = x, y = y, r = 0.25 * unit(2, "mm"),
                                             gp = gpar(fill = "black")),
            function(x, y, w, h) grid.circle(x = x, y = y, r = 0.5 * unit(2, "mm"),
                                             gp = gpar(fill = "black")),
            function(x, y, w, h) grid.circle(x = x, y = y, r = 0.75 * unit(2, "mm"),
                                             gp = gpar(fill = "black")),
            function(x, y, w, h) grid.circle(x = x, y = y, r = 1 * unit(2, "mm"),
                                             gp = gpar(fill = "black")))
  ))

hp<- Heatmap(exp_mat,
             heatmap_legend_param=list(title="expression"),
             column_title = "clustered dotplot",
             col=col_fun,
             rect_gp = gpar(type = "none"),
             layer_fun = layer_fun,
             row_names_gp = gpar(fontsize = 5),
             #row_km = 4,
             border = "black",
             top_annotation = column_ha)

draw( hp, annotation_legend_list = lgd_list)
四 scCustomize 聚类点图
前面在scRNA分析 | 定制 美化FeaturePlot 图,你需要的都在这也提到了scCustomize包优化的方便,这里也可以很快得到聚类点图。上面https://divingintogeneticsandgenomics.com/post/clustered-dotplot-for-single-cell-rnaseq/的博客作者就是scCustomize包的Contributor 。
Clustered_DotPlot(seurat_object = sce2, features = unique(top5$gene))

my36colors <-c('#E5D2DD', '#53A85F', '#F1BB72', '#F3B1A0', '#D6E7A3', '#57C3F3', '#476D87',
               '#E95C59', '#E59CC4', '#AB3282', '#23452F', '#BD956A', '#8C549C', '#585658',
               '#9FA3A8', '#E0D4CA', '#5F3D69', '#C5DEBA', '#58A4C3', '#E4C755', '#F7F398',
               '#AA9A59', '#E63863', '#E39A35', '#C1E6F3', '#6778AE', '#91D0BE', '#B53E2B',
               '#712820', '#DCC1DD', '#CCE0F5',  '#CCC9E6', '#625D9E', '#68A180', '#3A6963',
               '#968175'
)
###聚类点图
Clustered_DotPlot(seurat_object = sce2,
                  colors_use_exp = c('#330066','#336699','#66CC66','#FFCC33'),
                  colors_use_idents = my36colors ,
                  features = unique(top5$gene))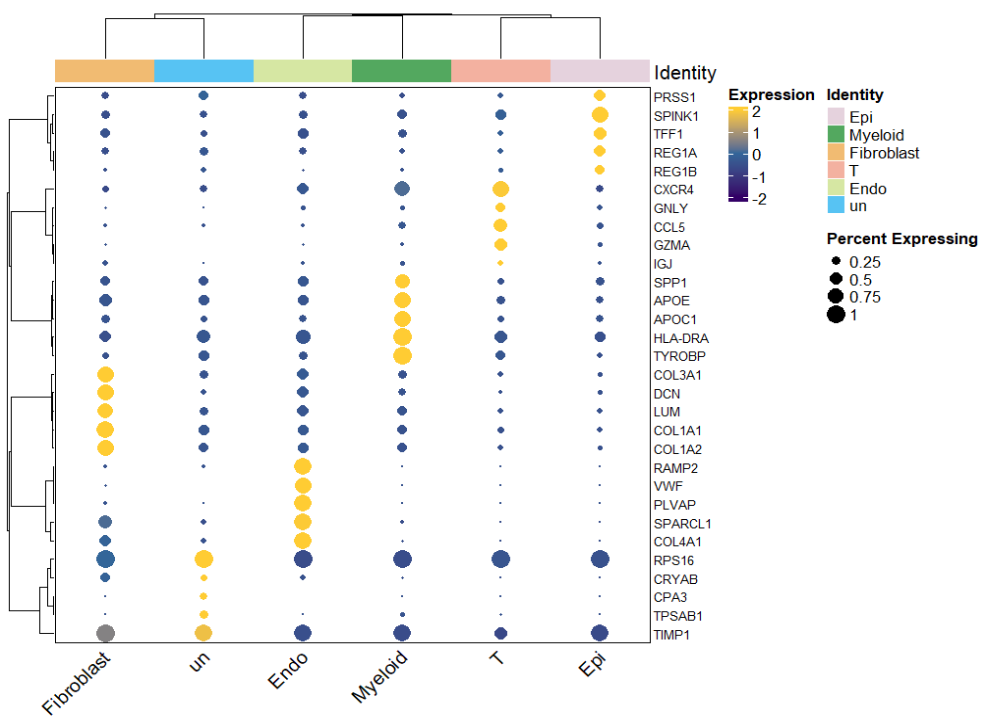
OK ,到这里一键出图 和 自定义都介绍了,优化你自己的DotPlot吧。

