支持向量机多种核函数的比较
今天给大家演示下R语言做支持向量机的例子,并且比较下在不进行调参的默认情况下,4种核函数的表现情况。分别是:线性核,多项式核,高斯径向基核,sigmoid核。
支持向量机非常强,应用非常广泛,不管是分类还是回归都能用,万金油一样的算法。不过它的理论知识比随机森林复杂了非常多,但是实现起来并不难哈,我们就直接调包即可。
加载数据和R包
使用e1071包做演示。数据使用modeldata中的credit_data,这是一个二分类数据,其中Status是结果变量,其余列是预测变量。这个德国信用卡评分数据集也是经常见的经典数据集,大家可以自己了解下。
library(modeldata)
library(e1071)
library(tidyverse)
library(pROC)

credit_df <- na.omit(credit_data)
做支持向量机前需要很多数据预处理,我们今天主要是为了演示4种核函数的基本使用,所有数据预处理就简单点,直接把缺失值删除了。
最终数据是这样的:
anyNA(credit_df)
## [1] FALSE
dim(credit_df)
## [1] 4039   14
str(credit_df)
## 'data.frame': 4039 obs. of  14 variables:
##  $ Status   : Factor w/ 2 levels "bad","good": 2 2 1 2 2 2 2 2 2 1 ...
##  $ Seniority: int  9 17 10 0 0 1 29 9 0 0 ...
##  $ Home     : Factor w/ 6 levels "ignore","other",..: 6 6 3 6 6 3 3 4 3 4 ...
##  $ Time     : int  60 60 36 60 36 60 60 12 60 48 ...
##  $ Age      : int  30 58 46 24 26 36 44 27 32 41 ...
##  $ Marital  : Factor w/ 5 levels "divorced","married",..: 2 5 2 4 4 2 2 4 2 2 ...
##  $ Records  : Factor w/ 2 levels "no","yes": 1 1 2 1 1 1 1 1 1 1 ...
##  $ Job      : Factor w/ 4 levels "fixed","freelance",..: 2 1 2 1 1 1 1 1 2 4 ...
##  $ Expenses : int  73 48 90 63 46 75 75 35 90 90 ...
##  $ Income   : int  129 131 200 182 107 214 125 80 107 80 ...
##  $ Assets   : int  0 0 3000 2500 0 3500 10000 0 15000 0 ...
##  $ Debt     : int  0 0 0 0 0 0 0 0 0 0 ...
##  $ Amount   : int  800 1000 2000 900 310 650 1600 200 1200 1200 ...
##  $ Price    : int  846 1658 2985 1325 910 1645 1800 1093 1957 1468 ...
##  - attr(*, "na.action")= 'omit' Named int [1:415] 30 114 144 153 158 177 195 206 240 241 ...
##   ..- attr(*, "names")= chr [1:415] "30" "114" "144" "153" ...
数据探索
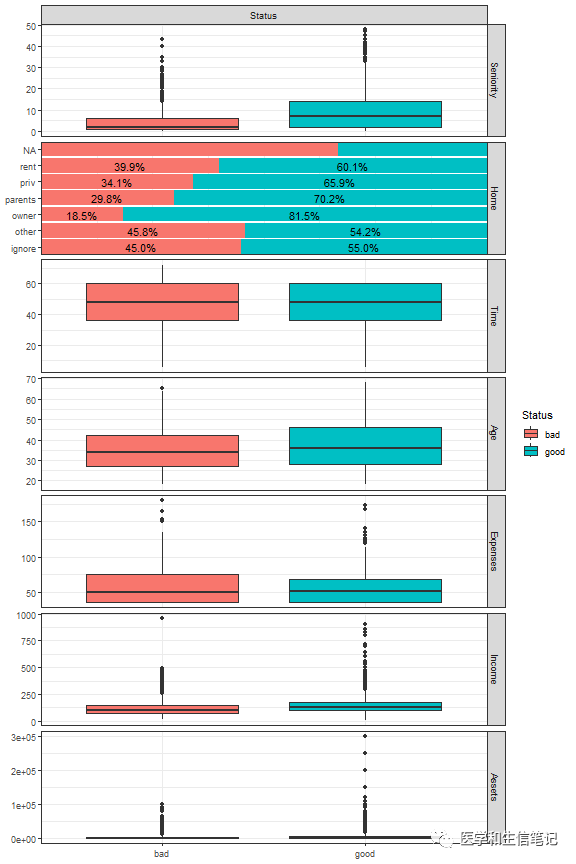
变量太多了,不太好画图,随便取几个变量画个图看看:
library(ggplot2)
library(GGally)
## Registered S3 method overwritten by 'GGally':
##   method from
##   +.gg   ggplot2

ggbivariate(credit_data, outcome = "Status",
            explanatory = c(2:5,9:11)
            )+theme_bw()

plot of chunk unnamed-chunk-3
数据划分
这次我们不打算调参,所以暂时用不到caret,数据划分直接用sample也能搞定,非常easy。
# 经典的3,7分
index <- sample(1:nrow(credit_df), nrow(credit_df)*0.7, replace = F)
train_df <- credit_df[index,]
test_df <- credit_df[-index,]
dim(train_df)
## [1] 2827   14
dim(test_df)
## [1] 1212   14
训练集建模
e1071使用起来非常简单,直接一个函数搞定,也是使用R语言经典的formula写法,二分类数据我们通常希望获得预测概率,所以加上probability = TRUE
然后kernel参数就是分别用4种核函数。
set.seed(123)
svmLinear <- svm(Status~ ., data = train_df,
                 probability = TRUE,
                 kernel="linear"
                 )

svmPoly <- svm(Status~ ., data = train_df,
               probability = TRUE,
               kernel="polynomial"
               )

svmRadial <- svm(Status~ ., data = train_df,
                 probability = TRUE,
                 kernel="radial"
                 )

svmSigmoid <- svm(Status~., data = train_df,
                  probability = TRUE,
                  kernel="sigmoid"
                  )
接下来就是查看模型在训练集中的表现,我们为了少写几行代码,先定义一个函数,可以自定帮我们提取训练结果,并组成1个数据框,内含原始数据的结果变量,预测结果,预测概率。
# 定义函数
getres <- function(svmfunc, dataset){
  data_pred <- predict(svmfunc, newdata=dataset, probability = T)
  data_pred_df <- dataset %>% select(Status) %>%
  bind_cols(status_pred = data_pred) %>%
  bind_cols(attr(data_pred, "probabilities"))
}
接下来提取数据即可,我们先提取1个看看:
Linear_train_pred_df <- getres(svmLinear, train_df)
head(Linear_train_pred_df)
##   Status status_pred      good        bad
## 1   good        good 0.7136969 0.28630310
## 2   good        good 0.9001797 0.09982026
## 3   good        good 0.7425551 0.25744486
## 4    bad         bad 0.3266534 0.67334662
## 5   good        good 0.8836509 0.11634910
## 6   good        good 0.8229439 0.17705613
上面这个是:线性核函数,训练集,的结果,看起来没什么问题,第一列是原始结果变量,第2列是预测结果,第3和4列是预测概率。
如果你想看看混淆矩阵,可以借助caret包实现:
caret::confusionMatrix(Linear_train_pred_df$Status,
                       Linear_train_pred_df$status_pred,
                       mode = "everything")
## Confusion Matrix and Statistics
##
##           Reference
## Prediction  bad good
##       bad   318  388
##       good  147 1974
##
##                Accuracy : 0.8108
##                  95% CI : (0.7958, 0.825)
##     No Information Rate : 0.8355
##     P-Value [Acc > NIR] : 0.9998
##
##                   Kappa : 0.4301
##
##  Mcnemar's Test P-Value : <2e-16
##
##             Sensitivity : 0.6839
##             Specificity : 0.8357
##          Pos Pred Value : 0.4504
##          Neg Pred Value : 0.9307
##               Precision : 0.4504
##                  Recall : 0.6839
##                      F1 : 0.5431
##              Prevalence : 0.1645
##          Detection Rate : 0.1125
##    Detection Prevalence : 0.2497
##       Balanced Accuracy : 0.7598
##
##        'Positive' Class : bad
##
内容非常全面,我们就不解读了。
我们直接把剩下的核函数在训练集、测试集中的结果都提取出来,方便接下来使用。
# 提取4种核函数分别在训练集、测试集的结果
Linear_test_pred_df <- getres(svmLinear, test_df)
Poly_train_pred_df <- getres(svmPoly, train_df)
Poly_test_pred_df <- getres(svmPoly, test_df)

Radial_train_pred_df <- getres(svmRadial, train_df)
Radial_test_pred_df <- getres(svmRadial, test_df)

Sigmoid_train_pred_df <- getres(svmSigmoid, train_df)
Sigmoid_test_pred_df <- getres(svmSigmoid, test_df)
接下来又是大家喜闻乐见的画图环节,就选大家最喜欢的ROC曲线吧。
关于这个ROC曲线,我一共写了十几篇推文,应该是全面覆盖了,大家还不会的去翻历史推文吧。
其实这里你也可以写个函数哈,大神们都说只要重复超过3遍的都建议写函数实现...
# 首先构建训练集中4个ROC对象
roc_train_linear <- roc(Linear_train_pred_df$Status,
                        Linear_train_pred_df$good,
                        auc=T
                        )
## Setting levels: control = bad, case = good
## Setting direction: controls < cases

roc_train_Poly <- roc(Poly_train_pred_df$Status,
                      Poly_train_pred_df$good,
                      auc=T
                        )
## Setting levels: control = bad, case = good
## Setting direction: controls < cases

roc_train_Radial <- roc(Radial_train_pred_df$Status,
                        Radial_train_pred_df$good,
                        auc=T
                        )
## Setting levels: control = bad, case = good
## Setting direction: controls < cases

roc_train_Sigmoid <- roc(Sigmoid_train_pred_df$Status,
                        Sigmoid_train_pred_df$good,
                        auc=T
                        )
## Setting levels: control = bad, case = good
## Setting direction: controls < cases
然后我们准备4种颜色,这种小代码,建议大家记住,因为使用很高频,它可以直接给你十六进制颜色代码,复制粘贴就可以使用了!
RColorBrewer::brewer.pal(4,"Set1")
## [1] "#E41A1C" "#377EB8" "#4DAF4A" "#984EA3"
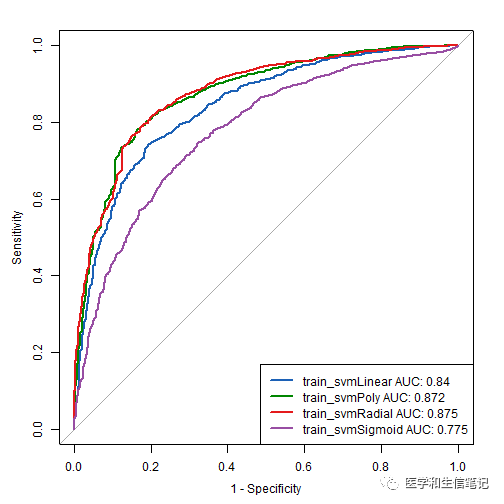
然后就是把训练集中,4种核函数的ROC曲线画在1张图上:
plot.roc(Linear_train_pred_df$Status,
         Linear_train_pred_df$good,
         col="#1c61b6",legacy=T,lwd=2)
## Setting levels: control = bad, case = good
## Setting direction: controls < cases
lines.roc(Poly_train_pred_df$Status,
          Poly_train_pred_df$good, col="#008600")
## Setting levels: control = bad, case = good
## Setting direction: controls < cases
lines.roc(Radial_train_pred_df$Status,
          Radial_train_pred_df$good, col="#E41A1C")
## Setting levels: control = bad, case = good
## Setting direction: controls < cases
lines.roc(Sigmoid_train_pred_df$Status,
          Sigmoid_train_pred_df$good, col="#984EA3")
## Setting levels: control = bad, case = good
## Setting direction: controls < cases

legend("bottomright",
       legend=c(paste0("train_svmLinear AUC: ",round(roc_train_linear[["auc"]],3)),
                paste0("train_svmPoly AUC: ",round(roc_train_Poly[["auc"]],3)),
                paste0("train_svmRadial AUC: ",round(roc_train_Radial[["auc"]],3)),
                paste0("train_svmSigmoid AUC: ",round(roc_train_Sigmoid[["auc"]],3))
                ),
       col=c("#1c61b6", "#008600","#E41A1C","#984EA3"),
       lwd=2)

plot of chunk unnamed-chunk-12
easy!看着还行。
测试集
测试集的数据已经提取好了,直接用即可。还是写个函数吧....
# 构建测试集中4个ROC对象
roc_test <- lapply(list(Linear_test_pred_df,poly_test_pred_df,
                        Radial_test_pred_df,Sigmoid_test_pred_df), function(x){
                          roc_res <- roc(x$Status, x$good,auc=T)
                          }
                   )
roc_test[[1]]
## Call:
## roc.default(response = x$Status, predictor = x$good, auc = T)
##
## Data: x$good in 282 controls (x$Status bad) < 930 cases (x$Status good).
## Area under the curve: 0.8319
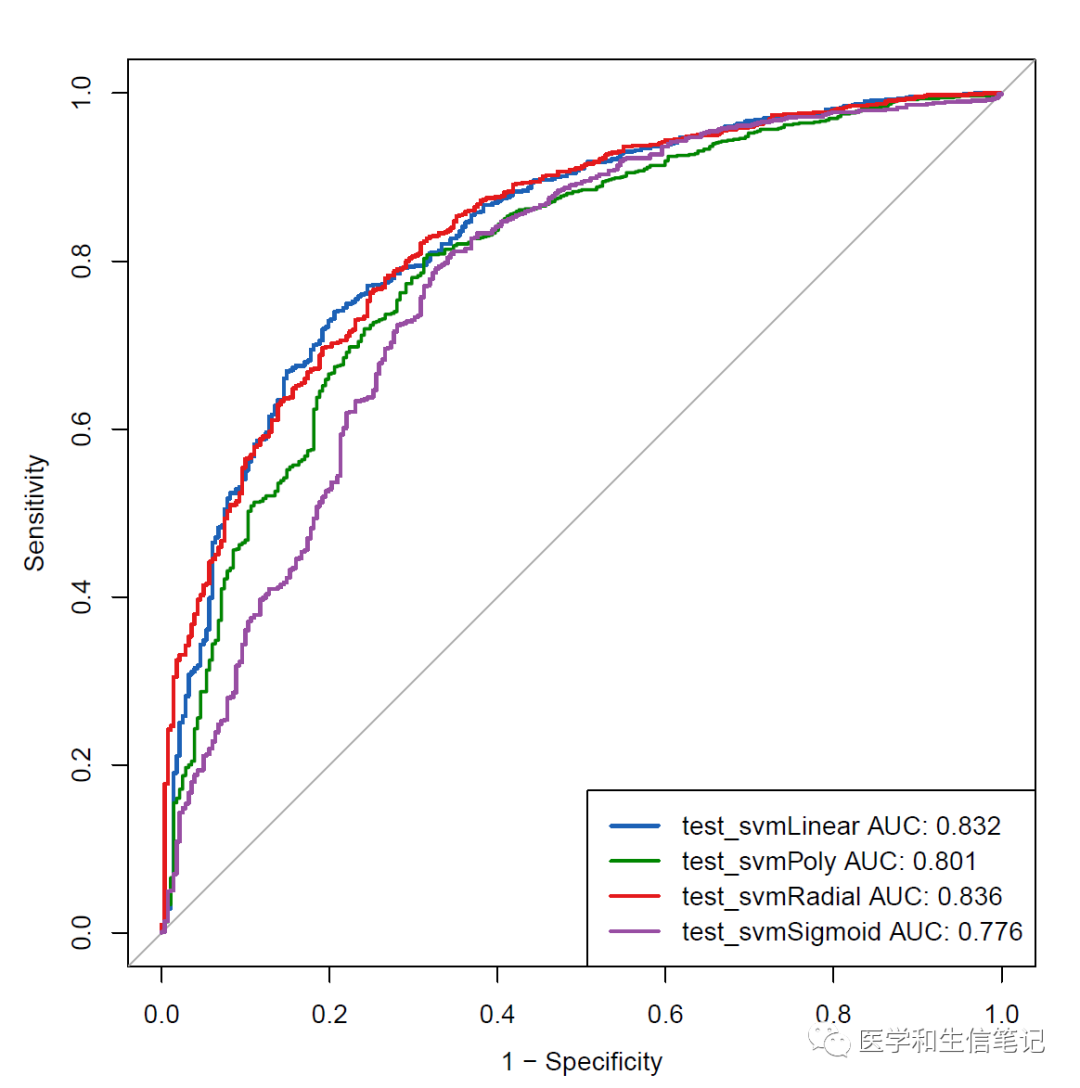
然后把测试集中,4种核函数的ROC曲线画在一起:
plot.roc(Linear_test_pred_df$Status,
         Linear_test_pred_df$good,
         col="#1c61b6",legacy=T)
## Setting levels: control = bad, case = good
## Setting direction: controls < cases
lines.roc(Poly_test_pred_df$Status,
          Poly_test_pred_df$good, col="#008600")
## Setting levels: control = bad, case = good
## Setting direction: controls < cases
lines.roc(Radial_test_pred_df$Status,
          Radial_test_pred_df$good, col="#E41A1C")
## Setting levels: control = bad, case = good
## Setting direction: controls < cases
lines.roc(Sigmoid_test_pred_df$Status,
          Sigmoid_test_pred_df$good, col="#984EA3")
## Setting levels: control = bad, case = good
## Setting direction: controls < cases
legend("bottomright",
       legend=c(paste0("test_svmLinear AUC: ",round(roc_test[[1]][["auc"]],3)),
                paste0("test_svmPoly AUC: ",round(roc_test[[2]][["auc"]],3)),
                paste0("test_svmRadial AUC: ",round(roc_test[[3]][["auc"]],3)),
                paste0("test_svmSigmoid AUC: ",round(roc_test[[4]][["auc"]],3))
                ),
       col=c("#1c61b6", "#008600","#E41A1C","#984EA3"),
       lwd=2)

结果看起来还不错哦。
本文参与 腾讯云自媒体同步曝光计划,分享自微信公众号。
原始发表:2023-06-05,如有侵权请联系 cloudcommunity@tencent.com 删除
评论
登录后参与评论
推荐阅读
目录


