PyAlgoTrade 0.20 中文文档(四)

PyAlgoTrade 0.20 中文文档(四)

ApacheCN_飞龙
发布于 2024-05-16 15:35:49
发布于 2024-05-16 15:35:49
SMA 交叉
原文:
gbeced.github.io/pyalgotrade/docs/v0.20/html/sample_sma_crossover.html
将此代码保存为 sma_crossover.py:
from pyalgotrade import strategy
from pyalgotrade.technical import ma
from pyalgotrade.technical import cross

class SMACrossOver(strategy.BacktestingStrategy):
    def __init__(self, feed, instrument, smaPeriod):
        super(SMACrossOver, self).__init__(feed)
        self.__instrument = instrument
        self.__position = None
        # We'll use adjusted close values instead of regular close values.
        self.setUseAdjustedValues(True)
        self.__prices = feed[instrument].getPriceDataSeries()
        self.__sma = ma.SMA(self.__prices, smaPeriod)

    def getSMA(self):
        return self.__sma

    def onEnterCanceled(self, position):
        self.__position = None

    def onExitOk(self, position):
        self.__position = None

    def onExitCanceled(self, position):
        # If the exit was canceled, re-submit it.
        self.__position.exitMarket()

    def onBars(self, bars):
        # If a position was not opened, check if we should enter a long position.
        if self.__position is None:
            if cross.cross_above(self.__prices, self.__sma) > 0:
                shares = int(self.getBroker().getCash() * 0.9 / bars[self.__instrument].getPrice())
                # Enter a buy market order. The order is good till canceled.
                self.__position = self.enterLong(self.__instrument, shares, True)
        # Check if we have to exit the position.
        elif not self.__position.exitActive() and cross.cross_below(self.__prices, self.__sma) > 0:
            self.__position.exitMarket()
并使用以下代码执行策略:
from __future__ import print_function

import sma_crossover
from pyalgotrade import plotter
from pyalgotrade.tools import quandl
from pyalgotrade.stratanalyzer import sharpe

def main(plot):
    instrument = "AAPL"
    smaPeriod = 163

    # Download the bars.
    feed = quandl.build_feed("WIKI", [instrument], 2011, 2012, ".")

    strat = sma_crossover.SMACrossOver(feed, instrument, smaPeriod)
    sharpeRatioAnalyzer = sharpe.SharpeRatio()
    strat.attachAnalyzer(sharpeRatioAnalyzer)

    if plot:
        plt = plotter.StrategyPlotter(strat, True, False, True)
        plt.getInstrumentSubplot(instrument).addDataSeries("sma", strat.getSMA())

    strat.run()
    print("Sharpe ratio: %.2f" % sharpeRatioAnalyzer.getSharpeRatio(0.05))

    if plot:
        plt.plot()

if __name__ == "__main__":
    main(True)
这是输出应该呈现的样子:
2017-07-24 22:56:58,112 quandl [INFO] Downloading AAPL 2011 to ./WIKI-AAPL-2011-quandl.csv
2017-07-24 22:57:02,364 quandl [INFO] Downloading AAPL 2012 to ./WIKI-AAPL-2012-quandl.csv
Sharpe ratio: 1.12
这是图表应该呈现的样子:
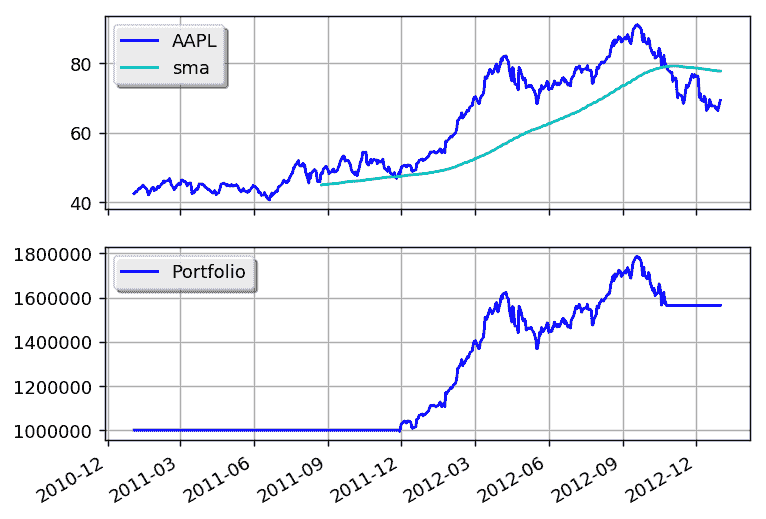
通过调整 sma 周期可以获得更好的回报。
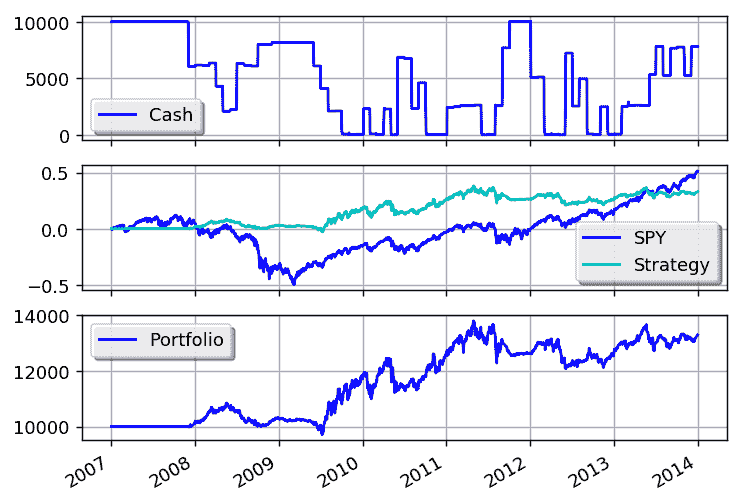
使用移动平均线交叉的市场定时
原文:
gbeced.github.io/pyalgotrade/docs/v0.20/html/sample_market_timing.html
这个示例是基于市场定时/GTAA 模型的描述:
该策略支持分析每个资产类别中的多个工具,并选择过去一个月收益最高的那个。
from __future__ import print_function

from pyalgotrade import strategy
from pyalgotrade import plotter
from pyalgotrade.barfeed import yahoofeed
from pyalgotrade.technical import ma
from pyalgotrade.technical import cumret
from pyalgotrade.stratanalyzer import sharpe
from pyalgotrade.stratanalyzer import returns

class MarketTiming(strategy.BacktestingStrategy):
    def __init__(self, feed, instrumentsByClass, initialCash):
        super(MarketTiming, self).__init__(feed, initialCash)
        self.setUseAdjustedValues(True)
        self.__instrumentsByClass = instrumentsByClass
        self.__rebalanceMonth = None
        self.__sharesToBuy = {}
        # Initialize indicators for each instrument.
        self.__sma = {}
        for assetClass in instrumentsByClass:
            for instrument in instrumentsByClass[assetClass]:
                priceDS = feed[instrument].getPriceDataSeries()
                self.__sma[instrument] = ma.SMA(priceDS, 200)

    def _shouldRebalance(self, dateTime):
        return dateTime.month != self.__rebalanceMonth

    def _getRank(self, instrument):
        # If the price is below the SMA, then this instrument doesn't rank at
        # all.
        smas = self.__sma[instrument]
        price = self.getLastPrice(instrument)
        if len(smas) == 0 or smas[-1] is None or price < smas[-1]:
            return None

        # Rank based on 20 day returns.
        ret = None
        lookBack = 20
        priceDS = self.getFeed()[instrument].getPriceDataSeries()
        if len(priceDS) >= lookBack and smas[-1] is not None and smas[-1*lookBack] is not None:
            ret = (priceDS[-1] - priceDS[-1*lookBack]) / float(priceDS[-1*lookBack])
        return ret

    def _getTopByClass(self, assetClass):
        # Find the instrument with the highest rank.
        ret = None
        highestRank = None
        for instrument in self.__instrumentsByClass[assetClass]:
            rank = self._getRank(instrument)
            if rank is not None and (highestRank is None or rank > highestRank):
                highestRank = rank
                ret = instrument
        return ret

    def _getTop(self):
        ret = {}
        for assetClass in self.__instrumentsByClass:
            ret[assetClass] = self._getTopByClass(assetClass)
        return ret

    def _placePendingOrders(self):
        # Use less chash just in case price changes too much.
        remainingCash = round(self.getBroker().getCash() * 0.9, 2)

        for instrument in self.__sharesToBuy:
            orderSize = self.__sharesToBuy[instrument]
            if orderSize > 0:
                # Adjust the order size based on available cash.
                lastPrice = self.getLastPrice(instrument)
                cost = orderSize * lastPrice
                while cost > remainingCash and orderSize > 0:
                    orderSize -= 1
                    cost = orderSize * lastPrice
                if orderSize > 0:
                    remainingCash -= cost
                    assert(remainingCash >= 0)

            if orderSize != 0:
                self.info("Placing market order for %d  %s shares" % (orderSize, instrument))
                self.marketOrder(instrument, orderSize, goodTillCanceled=True)
                self.__sharesToBuy[instrument] -= orderSize

    def _logPosSize(self):
        totalEquity = self.getBroker().getEquity()
        positions = self.getBroker().getPositions()
        for instrument in self.getBroker().getPositions():
            posSize = positions[instrument] * self.getLastPrice(instrument) / totalEquity * 100
            self.info("%s - %0.2f  %%" % (instrument, posSize))

    def _rebalance(self):
        self.info("Rebalancing")

        # Cancel all active/pending orders.
        for order in self.getBroker().getActiveOrders():
            self.getBroker().cancelOrder(order)

        cashPerAssetClass = round(self.getBroker().getEquity() / float(len(self.__instrumentsByClass)), 2)
        self.__sharesToBuy = {}

        # Calculate which positions should be open during the next period.
        topByClass = self._getTop()
        for assetClass in topByClass:
            instrument = topByClass[assetClass]
            self.info("Best for class %s: %s" % (assetClass, instrument))
            if instrument is not None:
                lastPrice = self.getLastPrice(instrument)
                cashForInstrument = round(cashPerAssetClass - self.getBroker().getShares(instrument) * lastPrice, 2)
                # This may yield a negative value and we have to reduce this
                # position.
                self.__sharesToBuy[instrument] = int(cashForInstrument / lastPrice)

        # Calculate which positions should be closed.
        for instrument in self.getBroker().getPositions():
            if instrument not in topByClass.values():
                currentShares = self.getBroker().getShares(instrument)
                assert(instrument not in self.__sharesToBuy)
                self.__sharesToBuy[instrument] = currentShares * -1

    def getSMA(self, instrument):
        return self.__sma[instrument]

    def onBars(self, bars):
        currentDateTime = bars.getDateTime()

        if self._shouldRebalance(currentDateTime):
            self.__rebalanceMonth = currentDateTime.month
            self._rebalance()

        self._placePendingOrders()

def main(plot):
    initialCash = 10000
    instrumentsByClass = {
        "US Stocks": ["VTI"],
        "Foreign Stocks": ["VEU"],
        "US 10 Year Government Bonds": ["IEF"],
        "Real Estate": ["VNQ"],
        "Commodities": ["DBC"],
    }

    # Load the bars. These files were manually downloaded from Yahoo Finance.
    feed = yahoofeed.Feed()
    instruments = ["SPY"]
    for assetClass in instrumentsByClass:
        instruments.extend(instrumentsByClass[assetClass])

    for year in range(2007, 2013+1):
        for instrument in instruments:
            fileName = "%s-%d-yahoofinance.csv" % (instrument, year)
            print("Loading bars from %s" % fileName)
            feed.addBarsFromCSV(instrument, fileName)

    # Build the strategy and attach some metrics.
    strat = MarketTiming(feed, instrumentsByClass, initialCash)
    sharpeRatioAnalyzer = sharpe.SharpeRatio()
    strat.attachAnalyzer(sharpeRatioAnalyzer)
    returnsAnalyzer = returns.Returns()
    strat.attachAnalyzer(returnsAnalyzer)

    if plot:
        plt = plotter.StrategyPlotter(strat, False, False, True)
        plt.getOrCreateSubplot("cash").addCallback("Cash", lambda x: strat.getBroker().getCash())
        # Plot strategy vs. SPY cumulative returns.
        plt.getOrCreateSubplot("returns").addDataSeries("SPY", cumret.CumulativeReturn(feed["SPY"].getPriceDataSeries()))
        plt.getOrCreateSubplot("returns").addDataSeries("Strategy", returnsAnalyzer.getCumulativeReturns())

    strat.run()
    print("Sharpe ratio: %.2f" % sharpeRatioAnalyzer.getSharpeRatio(0.05))
    print("Returns: %.2f  %%" % (returnsAnalyzer.getCumulativeReturns()[-1] * 100))

    if plot:
        plt.plot()

if __name__ == "__main__":
    main(True)
输出应该是这样的:
Loading bars from SPY-2007-yahoofinance.csv
Loading bars from VTI-2007-yahoofinance.csv
Loading bars from DBC-2007-yahoofinance.csv
Loading bars from IEF-2007-yahoofinance.csv
Loading bars from VEU-2007-yahoofinance.csv
Loading bars from VNQ-2007-yahoofinance.csv
Loading bars from SPY-2008-yahoofinance.csv
Loading bars from VTI-2008-yahoofinance.csv
Loading bars from DBC-2008-yahoofinance.csv
Loading bars from IEF-2008-yahoofinance.csv
.
.
.
2013-10-01 00:00:00 strategy [INFO] Best for class US Stocks: VTI
2013-10-01 00:00:00 strategy [INFO] Best for class Commodities: None
2013-10-01 00:00:00 strategy [INFO] Best for class US 10 Year Government Bonds: None
2013-10-01 00:00:00 strategy [INFO] Best for class Foreign Stocks: VEU
2013-10-01 00:00:00 strategy [INFO] Best for class Real Estate: None
2013-10-01 00:00:00 strategy [INFO] Placing market order for -2 VEU shares
2013-11-01 00:00:00 strategy [INFO] Rebalancing
2013-11-01 00:00:00 strategy [INFO] Best for class US Stocks: VTI
2013-11-01 00:00:00 strategy [INFO] Best for class Commodities: None
2013-11-01 00:00:00 strategy [INFO] Best for class US 10 Year Government Bonds: None
2013-11-01 00:00:00 strategy [INFO] Best for class Foreign Stocks: VEU
2013-11-01 00:00:00 strategy [INFO] Best for class Real Estate: VNQ
2013-11-01 00:00:00 strategy [INFO] Placing market order for -1 VTI shares
2013-11-01 00:00:00 strategy [INFO] Placing market order for -1 VEU shares
2013-11-01 00:00:00 strategy [INFO] Placing market order for 39 VNQ shares
2013-12-02 00:00:00 strategy [INFO] Rebalancing
2013-12-02 00:00:00 strategy [INFO] Best for class US Stocks: VTI
2013-12-02 00:00:00 strategy [INFO] Best for class Commodities: None
2013-12-02 00:00:00 strategy [INFO] Best for class US 10 Year Government Bonds: None
2013-12-02 00:00:00 strategy [INFO] Best for class Foreign Stocks: VEU
2013-12-02 00:00:00 strategy [INFO] Best for class Real Estate: None
2013-12-02 00:00:00 strategy [INFO] Placing market order for -1 VTI shares
2013-12-02 00:00:00 strategy [INFO] Placing market order for -39 VNQ shares
Sharpe ratio: -0.06
Returns: 32.97 %
图表应该是这样的:
Ernie Chan 的黄金与黄金矿业公司
原文:
gbeced.github.io/pyalgotrade/docs/v0.20/html/sample_statarb_erniechan.html
此示例基于:
-
epchan.blogspot.com.ar/2006/11/gold-vs-gold-miners-another-arbitrage.html -
www.quantopian.com/posts/ernie-chans-gold-vs-gold-miners-stat-arb
from __future__ import print_function

from pyalgotrade import strategy
from pyalgotrade import dataseries
from pyalgotrade.dataseries import aligned
from pyalgotrade import plotter
from pyalgotrade.barfeed import yahoofeed
from pyalgotrade.stratanalyzer import sharpe

import numpy as np
import statsmodels.api as sm

def get_beta(values1, values2):
    # http://statsmodels.sourceforge.net/stable/regression.html
    model = sm.OLS(values1, values2)
    results = model.fit()
    return results.params[0]

class StatArbHelper:
    def __init__(self, ds1, ds2, windowSize):
        # We're going to use datetime aligned versions of the dataseries.
        self.__ds1, self.__ds2 = aligned.datetime_aligned(ds1, ds2)
        self.__windowSize = windowSize
        self.__hedgeRatio = None
        self.__spread = None
        self.__spreadMean = None
        self.__spreadStd = None
        self.__zScore = None

    def getSpread(self):
        return self.__spread

    def getSpreadMean(self):
        return self.__spreadMean

    def getSpreadStd(self):
        return self.__spreadStd

    def getZScore(self):
        return self.__zScore

    def getHedgeRatio(self):
        return self.__hedgeRatio

    def __updateHedgeRatio(self, values1, values2):
        self.__hedgeRatio = get_beta(values1, values2)

    def __updateSpreadMeanAndStd(self, values1, values2):
        if self.__hedgeRatio is not None:
            spread = values1 - values2 * self.__hedgeRatio
            self.__spreadMean = spread.mean()
            self.__spreadStd = spread.std(ddof=1)

    def __updateSpread(self):
        if self.__hedgeRatio is not None:
            self.__spread = self.__ds1[-1] - self.__hedgeRatio * self.__ds2[-1]

    def __updateZScore(self):
        if self.__spread is not None and self.__spreadMean is not None and self.__spreadStd is not None:
            self.__zScore = (self.__spread - self.__spreadMean) / float(self.__spreadStd)

    def update(self):
        if len(self.__ds1) >= self.__windowSize:
            values1 = np.asarray(self.__ds1[-1*self.__windowSize:])
            values2 = np.asarray(self.__ds2[-1*self.__windowSize:])
            self.__updateHedgeRatio(values1, values2)
            self.__updateSpread()
            self.__updateSpreadMeanAndStd(values1, values2)
            self.__updateZScore()

class StatArb(strategy.BacktestingStrategy):
    def __init__(self, feed, instrument1, instrument2, windowSize):
        super(StatArb, self).__init__(feed)
        self.setUseAdjustedValues(True)
        self.__statArbHelper = StatArbHelper(feed[instrument1].getAdjCloseDataSeries(), feed[instrument2].getAdjCloseDataSeries(), windowSize)
        self.__i1 = instrument1
        self.__i2 = instrument2

        # These are used only for plotting purposes.
        self.__spread = dataseries.SequenceDataSeries()
        self.__hedgeRatio = dataseries.SequenceDataSeries()

    def getSpreadDS(self):
        return self.__spread

    def getHedgeRatioDS(self):
        return self.__hedgeRatio

    def __getOrderSize(self, bars, hedgeRatio):
        cash = self.getBroker().getCash(False)
        price1 = bars[self.__i1].getAdjClose()
        price2 = bars[self.__i2].getAdjClose()
        size1 = int(cash / (price1 + hedgeRatio * price2))
        size2 = int(size1 * hedgeRatio)
        return (size1, size2)

    def buySpread(self, bars, hedgeRatio):
        amount1, amount2 = self.__getOrderSize(bars, hedgeRatio)
        self.marketOrder(self.__i1, amount1)
        self.marketOrder(self.__i2, amount2 * -1)

    def sellSpread(self, bars, hedgeRatio):
        amount1, amount2 = self.__getOrderSize(bars, hedgeRatio)
        self.marketOrder(self.__i1, amount1 * -1)
        self.marketOrder(self.__i2, amount2)

    def reducePosition(self, instrument):
        currentPos = self.getBroker().getShares(instrument)
        if currentPos > 0:
            self.marketOrder(instrument, currentPos * -1)
        elif currentPos < 0:
            self.marketOrder(instrument, currentPos * -1)

    def onBars(self, bars):
        self.__statArbHelper.update()

        # These is used only for plotting purposes.
        self.__spread.appendWithDateTime(bars.getDateTime(), self.__statArbHelper.getSpread())
        self.__hedgeRatio.appendWithDateTime(bars.getDateTime(), self.__statArbHelper.getHedgeRatio())

        if bars.getBar(self.__i1) and bars.getBar(self.__i2):
            hedgeRatio = self.__statArbHelper.getHedgeRatio()
            zScore = self.__statArbHelper.getZScore()
            if zScore is not None:
                currentPos = abs(self.getBroker().getShares(self.__i1)) + abs(self.getBroker().getShares(self.__i2))
                if abs(zScore) <= 1 and currentPos != 0:
                    self.reducePosition(self.__i1)
                    self.reducePosition(self.__i2)
                elif zScore <= -2 and currentPos == 0:  # Buy spread when its value drops below 2 standard deviations.
                    self.buySpread(bars, hedgeRatio)
                elif zScore >= 2 and currentPos == 0:  # Short spread when its value rises above 2 standard deviations.
                    self.sellSpread(bars, hedgeRatio)

def main(plot):
    instruments = ["gld", "gdx"]
    windowSize = 50

    # Load the bars. These files were manually downloaded from Yahoo Finance.
    feed = yahoofeed.Feed()
    for year in range(2006, 2012+1):
        for instrument in instruments:
            fileName = "%s-%d-yahoofinance.csv" % (instrument, year)
            print("Loading bars from %s" % fileName)
            feed.addBarsFromCSV(instrument, fileName)

    strat = StatArb(feed, instruments[0], instruments[1], windowSize)
    sharpeRatioAnalyzer = sharpe.SharpeRatio()
    strat.attachAnalyzer(sharpeRatioAnalyzer)

    if plot:
        plt = plotter.StrategyPlotter(strat, False, False, True)
        plt.getOrCreateSubplot("hedge").addDataSeries("Hedge Ratio", strat.getHedgeRatioDS())
        plt.getOrCreateSubplot("spread").addDataSeries("Spread", strat.getSpreadDS())

    strat.run()
    print("Sharpe ratio: %.2f" % sharpeRatioAnalyzer.getSharpeRatio(0.05))

    if plot:
        plt.plot()

if __name__ == "__main__":
    main(True)
这是输出应该的样子:
Loading bars from gld-2006-yahoofinance.csv
Loading bars from gdx-2006-yahoofinance.csv
Loading bars from gld-2007-yahoofinance.csv
Loading bars from gdx-2007-yahoofinance.csv
Loading bars from gld-2008-yahoofinance.csv
Loading bars from gdx-2008-yahoofinance.csv
Loading bars from gld-2009-yahoofinance.csv
Loading bars from gdx-2009-yahoofinance.csv
Loading bars from gld-2010-yahoofinance.csv
Loading bars from gdx-2010-yahoofinance.csv
Loading bars from gld-2011-yahoofinance.csv
Loading bars from gdx-2011-yahoofinance.csv
Loading bars from gld-2012-yahoofinance.csv
Loading bars from gdx-2012-yahoofinance.csv
Sharpe ratio: -0.20
这是图表应该的样子:
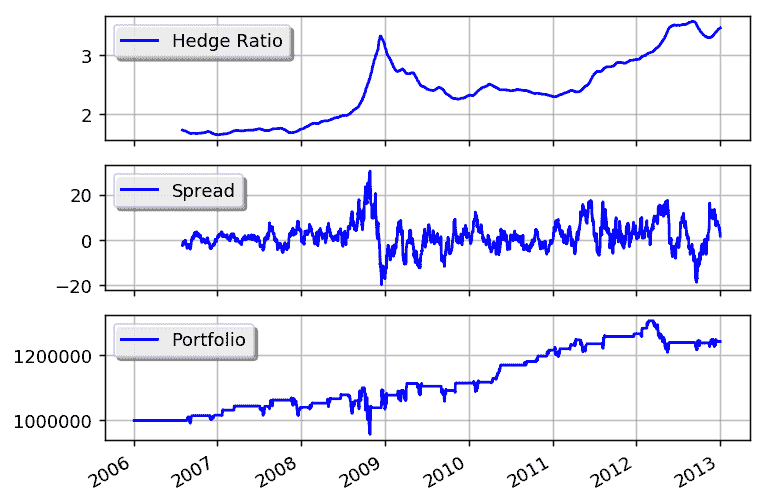
通过调整窗口大小以及 z-score 的入口和出口值,您可以获得更好的回报。
布林带
原文:
gbeced.github.io/pyalgotrade/docs/v0.20/html/sample_bbands.html
此示例基于:
from __future__ import print_function

from pyalgotrade import strategy
from pyalgotrade import plotter
from pyalgotrade.tools import quandl
from pyalgotrade.technical import bollinger
from pyalgotrade.stratanalyzer import sharpe
from pyalgotrade import broker as basebroker

class BBands(strategy.BacktestingStrategy):
    def __init__(self, feed, instrument, bBandsPeriod):
        super(BBands, self).__init__(feed)
        self.__instrument = instrument
        self.__bbands = bollinger.BollingerBands(feed[instrument].getCloseDataSeries(), bBandsPeriod, 2)

    def getBollingerBands(self):
        return self.__bbands

    def onOrderUpdated(self, order):
        if order.isBuy():
            orderType = "Buy"
        else:
            orderType = "Sell"
        self.info("%s order %d updated - Status: %s" % (
            orderType, order.getId(), basebroker.Order.State.toString(order.getState())
        ))

    def onBars(self, bars):
        lower = self.__bbands.getLowerBand()[-1]
        upper = self.__bbands.getUpperBand()[-1]
        if lower is None:
            return

        shares = self.getBroker().getShares(self.__instrument)
        bar = bars[self.__instrument]
        if shares == 0 and bar.getClose() < lower:
            sharesToBuy = int(self.getBroker().getCash(False) / bar.getClose())
            self.info("Placing buy market order for %s shares" % sharesToBuy)
            self.marketOrder(self.__instrument, sharesToBuy)
        elif shares > 0 and bar.getClose() > upper:
            self.info("Placing sell market order for %s shares" % shares)
            self.marketOrder(self.__instrument, -1*shares)

def main(plot):
    instrument = "yhoo"
    bBandsPeriod = 40

    # Download the bars.
    feed = quandl.build_feed("WIKI", [instrument], 2011, 2012, ".")

    strat = BBands(feed, instrument, bBandsPeriod)
    sharpeRatioAnalyzer = sharpe.SharpeRatio()
    strat.attachAnalyzer(sharpeRatioAnalyzer)

    if plot:
        plt = plotter.StrategyPlotter(strat, True, True, True)
        plt.getInstrumentSubplot(instrument).addDataSeries("upper", strat.getBollingerBands().getUpperBand())
        plt.getInstrumentSubplot(instrument).addDataSeries("middle", strat.getBollingerBands().getMiddleBand())
        plt.getInstrumentSubplot(instrument).addDataSeries("lower", strat.getBollingerBands().getLowerBand())

    strat.run()
    print("Sharpe ratio: %.2f" % sharpeRatioAnalyzer.getSharpeRatio(0.05))

    if plot:
        plt.plot()

if __name__ == "__main__":
    main(True)
这就是输出的样子:
2011-07-20 00:00:00 strategy [INFO] Placing buy market order for 74183 shares
2011-07-20 00:00:00 strategy [INFO] Buy order 1 updated - Status: SUBMITTED
2011-07-21 00:00:00 strategy [INFO] Buy order 1 updated - Status: ACCEPTED
2011-07-21 00:00:00 broker.backtesting [DEBUG] Not enough cash to fill yhoo order [1] for 74183 share/s
2011-07-21 00:00:00 strategy [INFO] Buy order 1 updated - Status: CANCELED
2011-07-21 00:00:00 strategy [INFO] Placing buy market order for 73583 shares
2011-07-21 00:00:00 strategy [INFO] Buy order 2 updated - Status: SUBMITTED
2011-07-22 00:00:00 strategy [INFO] Buy order 2 updated - Status: ACCEPTED
2011-07-22 00:00:00 broker.backtesting [DEBUG] Not enough cash to fill yhoo order [2] for 73583 share/s
2011-07-22 00:00:00 strategy [INFO] Buy order 2 updated - Status: CANCELED
2011-07-25 00:00:00 strategy [INFO] Placing buy market order for 73046 shares
2011-07-25 00:00:00 strategy [INFO] Buy order 3 updated - Status: SUBMITTED
2011-07-26 00:00:00 strategy [INFO] Buy order 3 updated - Status: ACCEPTED
2011-07-26 00:00:00 broker.backtesting [DEBUG] Not enough cash to fill yhoo order [3] for 73046 share/s
2011-07-26 00:00:00 strategy [INFO] Buy order 3 updated - Status: CANCELED
2011-07-27 00:00:00 strategy [INFO] Placing buy market order for 73610 shares
2011-07-27 00:00:00 strategy [INFO] Buy order 4 updated - Status: SUBMITTED
2011-07-28 00:00:00 strategy [INFO] Buy order 4 updated - Status: ACCEPTED
2011-07-28 00:00:00 broker.backtesting [DEBUG] Not enough cash to fill yhoo order [4] for 73610 share/s
2011-07-28 00:00:00 strategy [INFO] Buy order 4 updated - Status: CANCELED
2011-07-28 00:00:00 strategy [INFO] Placing buy market order for 74074 shares
2011-07-28 00:00:00 strategy [INFO] Buy order 5 updated - Status: SUBMITTED
2011-07-29 00:00:00 strategy [INFO] Buy order 5 updated - Status: ACCEPTED
2011-07-29 00:00:00 broker.backtesting [DEBUG] Not enough cash to fill yhoo order [5] for 74074 share/s
2011-07-29 00:00:00 strategy [INFO] Buy order 5 updated - Status: CANCELED
2011-07-29 00:00:00 strategy [INFO] Placing buy market order for 76335 shares
2011-07-29 00:00:00 strategy [INFO] Buy order 6 updated - Status: SUBMITTED
2011-08-01 00:00:00 strategy [INFO] Buy order 6 updated - Status: ACCEPTED
2011-08-01 00:00:00 broker.backtesting [DEBUG] Not enough cash to fill yhoo order [6] for 76335 share/s
2011-08-01 00:00:00 strategy [INFO] Buy order 6 updated - Status: CANCELED
2011-08-01 00:00:00 strategy [INFO] Placing buy market order for 76335 shares
2011-08-01 00:00:00 strategy [INFO] Buy order 7 updated - Status: SUBMITTED
2011-08-02 00:00:00 strategy [INFO] Buy order 7 updated - Status: ACCEPTED
2011-08-02 00:00:00 strategy [INFO] Buy order 7 updated - Status: FILLED
2011-09-15 00:00:00 strategy [INFO] Placing sell market order for 76335 shares
2011-09-15 00:00:00 strategy [INFO] Sell order 8 updated - Status: SUBMITTED
2011-09-16 00:00:00 strategy [INFO] Sell order 8 updated - Status: ACCEPTED
2011-09-16 00:00:00 strategy [INFO] Sell order 8 updated - Status: FILLED
2012-02-17 00:00:00 strategy [INFO] Placing buy market order for 77454 shares
2012-02-17 00:00:00 strategy [INFO] Buy order 9 updated - Status: SUBMITTED
2012-02-21 00:00:00 strategy [INFO] Buy order 9 updated - Status: ACCEPTED
2012-02-21 00:00:00 broker.backtesting [DEBUG] Not enough cash to fill yhoo order [9] for 77454 share/s
2012-02-21 00:00:00 strategy [INFO] Buy order 9 updated - Status: CANCELED
2012-02-21 00:00:00 strategy [INFO] Placing buy market order for 78819 shares
2012-02-21 00:00:00 strategy [INFO] Buy order 10 updated - Status: SUBMITTED
2012-02-22 00:00:00 strategy [INFO] Buy order 10 updated - Status: ACCEPTED
2012-02-22 00:00:00 strategy [INFO] Buy order 10 updated - Status: FILLED
2012-06-29 00:00:00 strategy [INFO] Placing sell market order for 78819 shares
2012-06-29 00:00:00 strategy [INFO] Sell order 11 updated - Status: SUBMITTED
2012-07-02 00:00:00 strategy [INFO] Sell order 11 updated - Status: ACCEPTED
2012-07-02 00:00:00 strategy [INFO] Sell order 11 updated - Status: FILLED
2012-08-10 00:00:00 strategy [INFO] Placing buy market order for 82565 shares
2012-08-10 00:00:00 strategy [INFO] Buy order 12 updated - Status: SUBMITTED
2012-08-13 00:00:00 strategy [INFO] Buy order 12 updated - Status: ACCEPTED
2012-08-13 00:00:00 strategy [INFO] Buy order 12 updated - Status: FILLED
2012-10-23 00:00:00 strategy [INFO] Placing sell market order for 82565 shares
2012-10-23 00:00:00 strategy [INFO] Sell order 13 updated - Status: SUBMITTED
2012-10-24 00:00:00 strategy [INFO] Sell order 13 updated - Status: ACCEPTED
2012-10-24 00:00:00 strategy [INFO] Sell order 13 updated - Status: FILLED
Sharpe ratio: 0.71
这就是图表的样子:
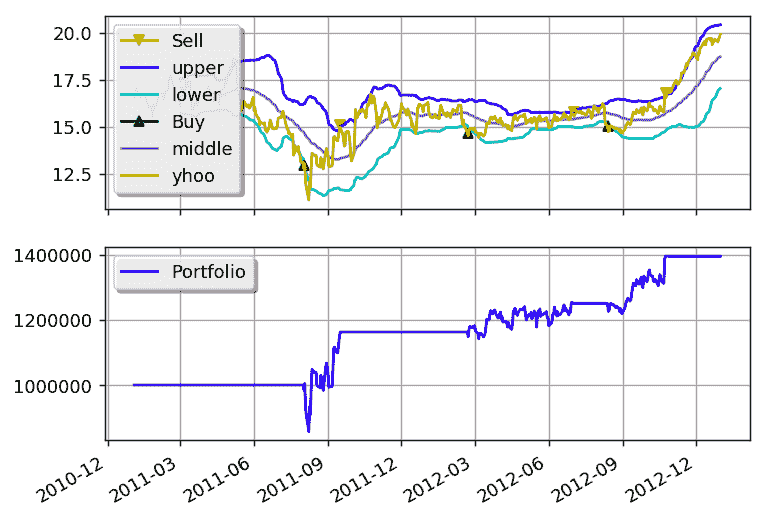
通过调整布林带的周期以及进出点,您可以获得更好的回报。
RSI2
原文链接:
gbeced.github.io/pyalgotrade/docs/v0.20/html/sample_rsi2.html
此示例基于一种称为 RSI2 的策略(stockcharts.com/school/doku.php?id=chart_school:trading_strategies:rsi2),需要以下参数:
- 用于趋势识别的 SMA 周期。我们将其称为 entrySMA。
- 用于退出点的较小 SMA 周期。我们将其称为 exitSMA。
- 一个用于进入多空仓位的 RSI 期间。我们将其称为 rsiPeriod。
- 一个用于多仓位进入的 RSI 超卖阈值。我们将其称为 overSoldThreshold。
- 用于空仓位进入的 RSI 超买阈值。我们将其称为 overBoughtThreshold。
将此代码保存为 rsi2.py:
from pyalgotrade import strategy
from pyalgotrade.technical import ma
from pyalgotrade.technical import rsi
from pyalgotrade.technical import cross

class RSI2(strategy.BacktestingStrategy):
    def __init__(self, feed, instrument, entrySMA, exitSMA, rsiPeriod, overBoughtThreshold, overSoldThreshold):
        super(RSI2, self).__init__(feed)
        self.__instrument = instrument
        # We'll use adjusted close values, if available, instead of regular close values.
        if feed.barsHaveAdjClose():
            self.setUseAdjustedValues(True)
        self.__priceDS = feed[instrument].getPriceDataSeries()
        self.__entrySMA = ma.SMA(self.__priceDS, entrySMA)
        self.__exitSMA = ma.SMA(self.__priceDS, exitSMA)
        self.__rsi = rsi.RSI(self.__priceDS, rsiPeriod)
        self.__overBoughtThreshold = overBoughtThreshold
        self.__overSoldThreshold = overSoldThreshold
        self.__longPos = None
        self.__shortPos = None

    def getEntrySMA(self):
        return self.__entrySMA

    def getExitSMA(self):
        return self.__exitSMA

    def getRSI(self):
        return self.__rsi

    def onEnterCanceled(self, position):
        if self.__longPos == position:
            self.__longPos = None
        elif self.__shortPos == position:
            self.__shortPos = None
        else:
            assert(False)

    def onExitOk(self, position):
        if self.__longPos == position:
            self.__longPos = None
        elif self.__shortPos == position:
            self.__shortPos = None
        else:
            assert(False)

    def onExitCanceled(self, position):
        # If the exit was canceled, re-submit it.
        position.exitMarket()

    def onBars(self, bars):
        # Wait for enough bars to be available to calculate SMA and RSI.
        if self.__exitSMA[-1] is None or self.__entrySMA[-1] is None or self.__rsi[-1] is None:
            return

        bar = bars[self.__instrument]
        if self.__longPos is not None:
            if self.exitLongSignal():
                self.__longPos.exitMarket()
        elif self.__shortPos is not None:
            if self.exitShortSignal():
                self.__shortPos.exitMarket()
        else:
            if self.enterLongSignal(bar):
                shares = int(self.getBroker().getCash() * 0.9 / bars[self.__instrument].getPrice())
                self.__longPos = self.enterLong(self.__instrument, shares, True)
            elif self.enterShortSignal(bar):
                shares = int(self.getBroker().getCash() * 0.9 / bars[self.__instrument].getPrice())
                self.__shortPos = self.enterShort(self.__instrument, shares, True)

    def enterLongSignal(self, bar):
        return bar.getPrice() > self.__entrySMA[-1] and self.__rsi[-1] <= self.__overSoldThreshold

    def exitLongSignal(self):
        return cross.cross_above(self.__priceDS, self.__exitSMA) and not self.__longPos.exitActive()

    def enterShortSignal(self, bar):
        return bar.getPrice() < self.__entrySMA[-1] and self.__rsi[-1] >= self.__overBoughtThreshold

    def exitShortSignal(self):
        return cross.cross_below(self.__priceDS, self.__exitSMA) and not self.__shortPos.exitActive()
并使用以下代码执行策略:
from __future__ import print_function

import rsi2
from pyalgotrade import plotter
from pyalgotrade.barfeed import yahoofeed
from pyalgotrade.stratanalyzer import sharpe

def main(plot):
    instrument = "DIA"
    entrySMA = 200
    exitSMA = 5
    rsiPeriod = 2
    overBoughtThreshold = 90
    overSoldThreshold = 10

    # Load the bars. These files were manually downloaded from Yahoo Finance.
    feed = yahoofeed.Feed()
    for year in range(2009, 2013):
        fileName = "%s-%d-yahoofinance.csv" % (instrument, year)
        print("Loading bars from %s" % fileName)
        feed.addBarsFromCSV(instrument, fileName)

    strat = rsi2.RSI2(feed, instrument, entrySMA, exitSMA, rsiPeriod, overBoughtThreshold, overSoldThreshold)
    sharpeRatioAnalyzer = sharpe.SharpeRatio()
    strat.attachAnalyzer(sharpeRatioAnalyzer)

    if plot:
        plt = plotter.StrategyPlotter(strat, True, False, True)
        plt.getInstrumentSubplot(instrument).addDataSeries("Entry SMA", strat.getEntrySMA())
        plt.getInstrumentSubplot(instrument).addDataSeries("Exit SMA", strat.getExitSMA())
        plt.getOrCreateSubplot("rsi").addDataSeries("RSI", strat.getRSI())
        plt.getOrCreateSubplot("rsi").addLine("Overbought", overBoughtThreshold)
        plt.getOrCreateSubplot("rsi").addLine("Oversold", overSoldThreshold)

    strat.run()
    print("Sharpe ratio: %.2f" % sharpeRatioAnalyzer.getSharpeRatio(0.05))

    if plot:
        plt.plot()

if __name__ == "__main__":
    main(True)
输出应该如下所示:
Loading bars from DIA-2009-yahoofinance.csv
Loading bars from DIA-2010-yahoofinance.csv
Loading bars from DIA-2011-yahoofinance.csv
Loading bars from DIA-2012-yahoofinance.csv
Sharpe ratio: -0.11
并且图表应该如下所示:
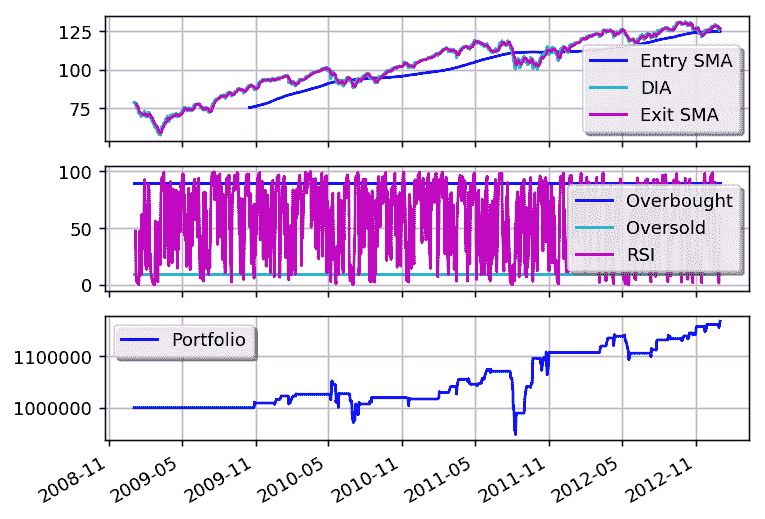
通过调整不同参数,您可以获得更好的回报。
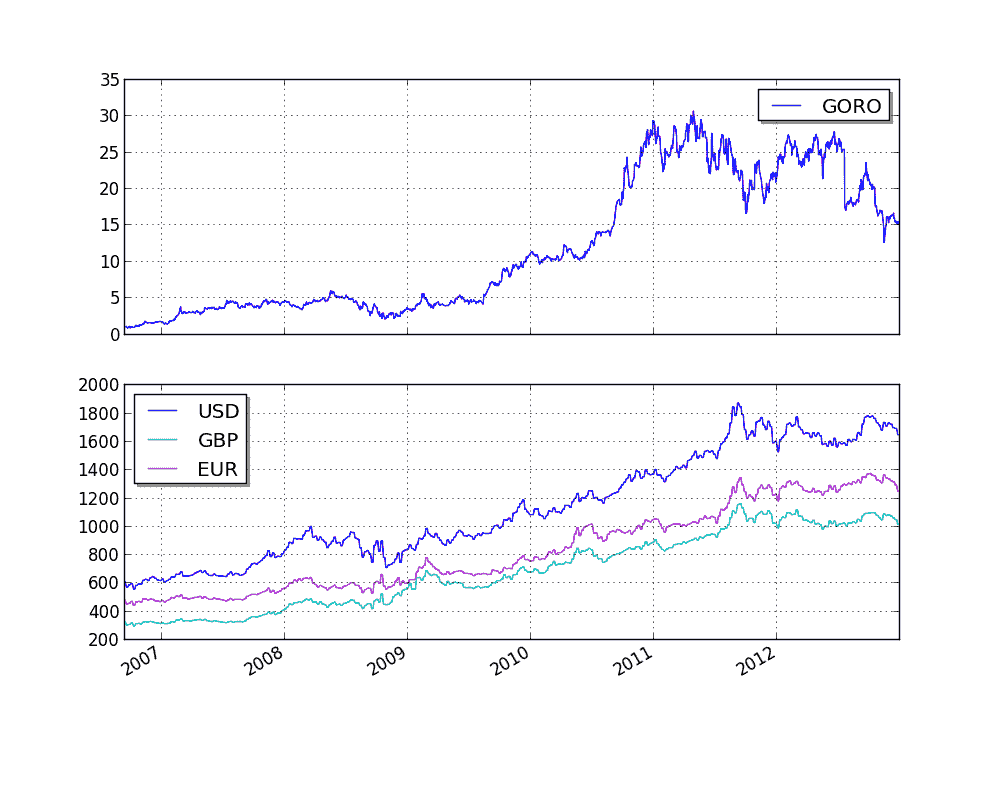
Quandl 整合
原文:
gbeced.github.io/pyalgotrade/docs/v0.20/html/sample_quandl.html
这个示例的目的是展示如何将来自 Quandl 的价格数据以及任何时间序列数据以 CSV 格式整合到策略中。
我们将使用来自 Quandl 的以下 CSV 数据:www.quandl.com/OFDP-Open-Financial-Data-Project/GOLD_2-LBMA-Gold-Price-London-Fixings-P-M
from pyalgotrade import strategy
from pyalgotrade import plotter
from pyalgotrade.tools import quandl
from pyalgotrade.feed import csvfeed
import datetime

class MyStrategy(strategy.BacktestingStrategy):
    def __init__(self, feed, quandlFeed, instrument):
        super(MyStrategy, self).__init__(feed)
        self.setUseAdjustedValues(True)
        self.__instrument = instrument

        # It is VERY important to add the the extra feed to the event dispatch loop before
        # running the strategy.
        self.getDispatcher().addSubject(quandlFeed)

        # Subscribe to events from the Quandl feed.
        quandlFeed.getNewValuesEvent().subscribe(self.onQuandlData)

    def onQuandlData(self, dateTime, values):
        self.info(values)

    def onBars(self, bars):
        self.info(bars[self.__instrument].getAdjClose())

def main(plot):
    instruments = ["GORO"]

    # Download GORO bars using WIKI source code.
    feed = quandl.build_feed("WIKI", instruments, 2006, 2012, ".")

    # Load Quandl CSV downloaded from http://www.quandl.com/OFDP-Open-Financial-Data-Project/GOLD_2-LBMA-Gold-Price-London-Fixings-P-M
    quandlFeed = csvfeed.Feed("Date", "%Y-%m-%d")
    quandlFeed.setDateRange(datetime.datetime(2006, 1, 1), datetime.datetime(2012, 12, 31))
    quandlFeed.addValuesFromCSV("quandl_gold_2.csv")

    myStrategy = MyStrategy(feed, quandlFeed, instruments[0])

    if plot:
        plt = plotter.StrategyPlotter(myStrategy, True, False, False)
        plt.getOrCreateSubplot("quandl").addDataSeries("USD", quandlFeed["USD"])
        plt.getOrCreateSubplot("quandl").addDataSeries("EUR", quandlFeed["EUR"])
        plt.getOrCreateSubplot("quandl").addDataSeries("GBP", quandlFeed["GBP"])

    myStrategy.run()

    if plot:
        plt.plot()

if __name__ == "__main__":
    main(True)
输出应该如下所示:
2006-01-01 00:00:00 strategy [INFO] {'USD': 513.0, 'GBP': 298.204, 'EUR': 433.533}
2006-01-08 00:00:00 strategy [INFO] {'USD': 535.25, 'GBP': 302.572, 'EUR': 440.173}
2006-01-15 00:00:00 strategy [INFO] {'USD': 548.25, 'GBP': 309.781, 'EUR': 454.489}
2006-01-22 00:00:00 strategy [INFO] {'USD': 567.25, 'GBP': 321.152, 'EUR': 468.802}
2006-01-29 00:00:00 strategy [INFO] {'USD': 561.75, 'GBP': 315.147, 'EUR': 460.526}
2006-02-05 00:00:00 strategy [INFO] {'USD': 569.0, 'GBP': 322.562, 'EUR': 474.167}
2006-02-12 00:00:00 strategy [INFO] {'USD': 557.0, 'GBP': 317.198, 'EUR': 463.78}
2006-02-19 00:00:00 strategy [INFO] {'USD': 551.7, 'GBP': 317.251, 'EUR': 463.224}
2006-02-26 00:00:00 strategy [INFO] {'USD': 554.15, 'GBP': 316.838, 'EUR': 465.555}
2006-03-05 00:00:00 strategy [INFO] {'USD': 565.0, 'GBP': 322.029, 'EUR': 469.854}
.
.
.
2012-12-19 00:00:00 strategy [INFO] 15.43
2012-12-20 00:00:00 strategy [INFO] 15.39
2012-12-21 00:00:00 strategy [INFO] 15.35
2012-12-23 00:00:00 strategy [INFO] {'USD': 1651.5, 'GBP': 1019.256, 'EUR': 1253.701}
2012-12-24 00:00:00 strategy [INFO] 15.2
2012-12-26 00:00:00 strategy [INFO] 15.56
2012-12-27 00:00:00 strategy [INFO] 15.24
2012-12-28 00:00:00 strategy [INFO] 15.09
2012-12-30 00:00:00 strategy [INFO] {'USD': 1657.5, 'GBP': 1027.206, 'EUR': 1253.024}
2012-12-31 00:00:00 strategy [INFO] 15.41
而这个图表应该是这样的:
本文参与 腾讯云自媒体同步曝光计划,分享自作者个人站点/博客。
原始发表:2024-05-16,如有侵权请联系 cloudcommunity@tencent.com 删除
评论
登录后参与评论
推荐阅读
目录
腾讯云开发者

Copyright © 2013 - 2026 Tencent Cloud. All Rights Reserved. 腾讯云 版权所有
深圳市腾讯计算机系统有限公司 ICP备案/许可证号:粤B2-20090059 ![]() 粤公网安备44030502008569号
粤公网安备44030502008569号
腾讯云计算(北京)有限责任公司 京ICP证150476号 | 京ICP备11018762号