单细胞空间联合分析新贵--iStar
原创
单细胞空间联合分析新贵--iStar
原创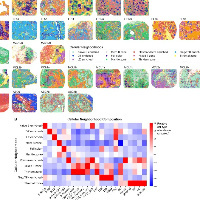
追风少年i
发布于 2025-11-10 15:07:48
发布于 2025-11-10 15:07:48
作者,Evil Genius
Faker,我也有梦想,能带我冲一次么?
有人问我个性化分析为什么公司做的总是不让人满意?
虽然我是公司的人,但是原因是多方面的。
1、公司大多数跑流程,这个大家都知道了,参数都是默认的。
2、客户也很少说参数设置的事情,所以不确定的情况下,就是默认参数,本质上是对分析的不了解。
3、个性化分析,尤其是针对课题的专门分析,这个目前只能自己做。
4、在公司,当然说句自夸的话,像我这样不断阅读文献,追求分析质量的人不是主流。
还有其他很多原因,综合下来就是分析质量,尤其是个性化分析的质量不高。
今天我们分享方法
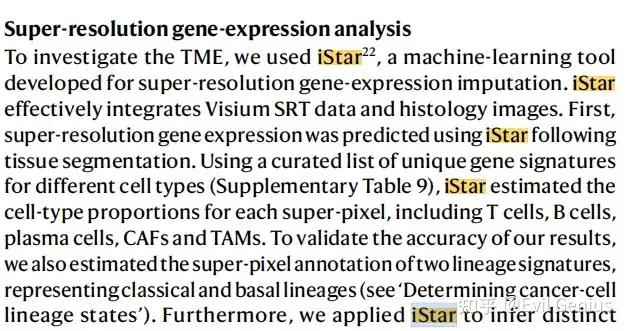
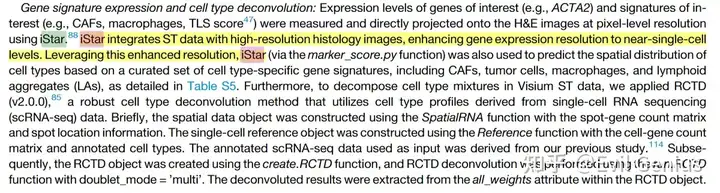
最近看到的文章,都喜欢这个单细胞空间联合分析的软件----iStar。
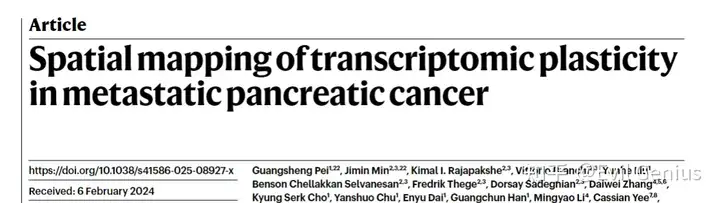
比如正刊
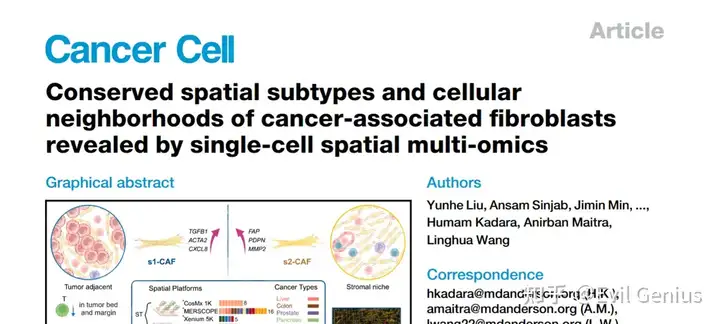
还有王凌华的文章
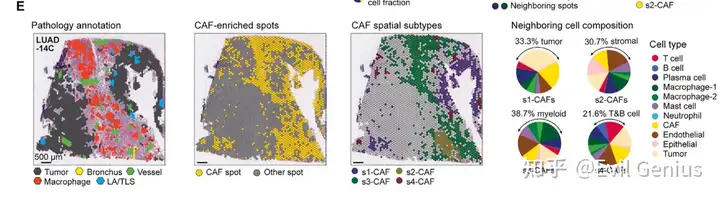
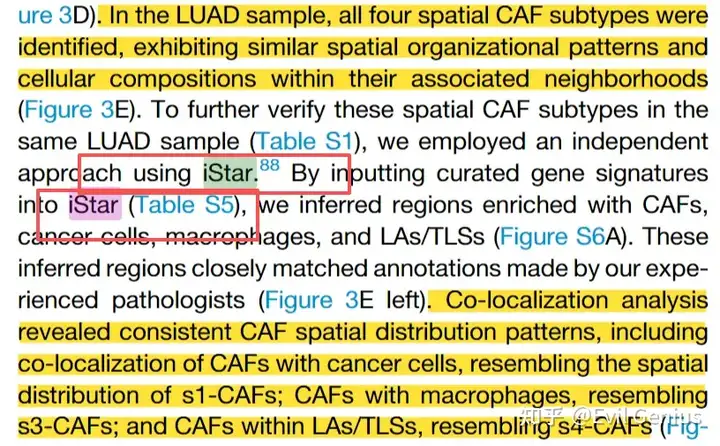
还有最新的文章
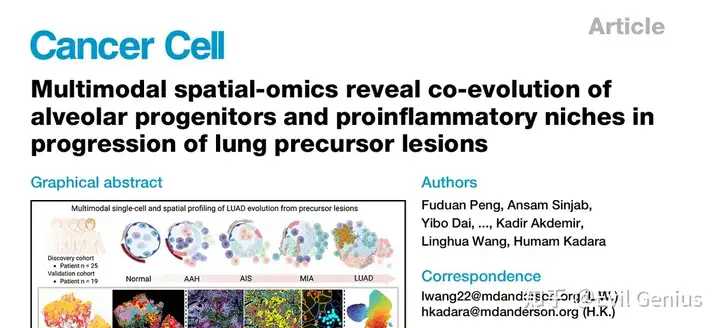
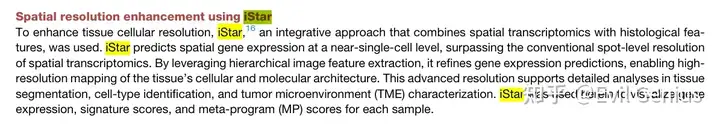
这个方法发表的文章在
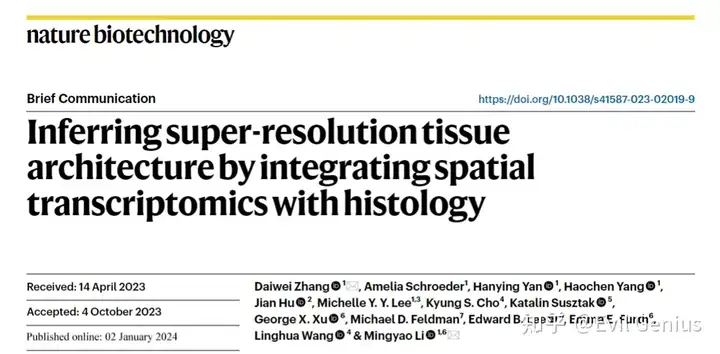
相当高了,
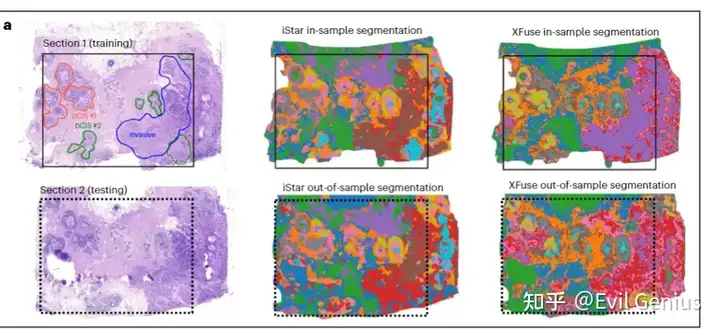
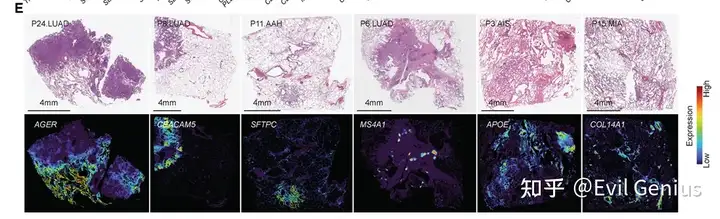
方法主要的优势在于将visium等低精度空转填充到高精度。
示例代码在GitHub - daviddaiweizhang/istar
非常简便的方法
# Use Python 3.9 or above
pip install -r requirements.txt
./run_demo.sh
需要准备的文章
he-raw.jpg: 原始组织学图像
cnts.tsv: 基因计数矩阵。
- 第 1 行:基因名称。
- 第 2 行及之后:每一行代表一个点位。
- 第 1 列:点位 ID。
- 第 2 列及之后:每一列代表一个基因。
locs-raw.tsv: 点位位置信息
- 第 1 行:表头
- 第 2 行及之后:每一行代表一个点位。必须与 cnts.tsv 中的行相匹配。
- 第 1 列:点位 ID
- 第 2 列:x 坐标(水平轴)。必须与 he-raw.jpg 图像像素数组索引的 axis-1(列)处于同一坐标系。
- 第 3 列:y 坐标(垂直轴)。必须与 he-raw.jpg 图像像素数组索引的 axis-0(行)处于同一坐标系。
pixel-size-raw.txt: he-raw.jpg 图像中像素的边长(以微米为单位)。此值通常在 0.1 到 1.0 之间。
对于 Visium 数据,此值可近似计算为 8000 / 2000 * tissue_hires_scalef,其中 tissue_hires_scalef 存储在 scalefactors_json.json 文件中。
radius-raw.txt: he-raw.jpg 图像中每个点位半径所对应的像素数量。
对于 Visium 数据,此值可通过 spot_diameter_fullres * 0.5 计算得到,其中 spot_diameter_fullres 存储在 scalefactors_json.json 文件中,并且应接近 55 * 0.5 / pixel_size_raw。
准备好以后,配置文件分析即可。
#!/bin/bash
set -e

prefix=$1  # e.g. data/demo/

device="cuda"  # "cuda" or "cpu"
pixel_size=0.5  # desired pixel size for the whole analysis
n_genes=1000  # number of most variable genes to impute

# preprocess histology image
echo $pixel_size > ${prefix}pixel-size.txt
python rescale.py ${prefix} --image
python preprocess.py ${prefix} --image

# extract histology features
python extract_features.py ${prefix} --device=${device}
# # If you want to retun model, you need to delete the existing results:
# rm ${prefix}embeddings-hist-raw.pickle

# auto detect tissue mask
# If you have a user-defined tissue mask, put it at `${prefix}mask-raw.png` and comment out the line below
python get_mask.py ${prefix}embeddings-hist.pickle ${prefix}mask-small.png

# # segment image by histology features
# python cluster.py --mask=${prefix}mask-small.png --n-clusters=10 ${prefix}embeddings-hist.pickle ${prefix}clusters-hist/
# # # segment image by histology features without tissue mask
# # python cluster.py ${prefix}embeddings-hist.pickle ${prefix}clusters-hist/unmasked/

# select most highly variable genes to predict
# If you have a user-defined list of genes, put it at `${prefix}gene-names.txt` and comment out the line below
python select_genes.py --n-top=${n_genes} "${prefix}cnts.tsv" "${prefix}gene-names.txt"

# predict super-resolution gene expression
# rescale coordinates and spot radius
python rescale.py ${prefix} --locs --radius

# train gene expression prediction model and predict at super-resolution
python impute.py ${prefix} --epochs=400 --device=${device}  # train model from scratch
# # If you want to retrain model, you need to delete the existing model:
# rm -r ${prefix}states

# visualize imputed gene expression
python plot_imputed.py ${prefix}

# segment image by gene features
python cluster.py --filter-size=8 --min-cluster-size=20 --n-clusters=10 --mask=${prefix}mask-small.png ${prefix}embeddings-gene.pickle ${prefix}clusters-gene/
# # segment image without tissue mask
# python cluster.py --filter-size=8 --min-cluster-size=20 ${prefix}embeddings-gene.pickle ${prefix}clusters-gene/unmasked/
# # segment image without spatial smoothing
# python cluster.py --mask=${prefix}mask-small.png ${prefix}embeddings-gene.pickle ${prefix}clusters-gene/unsmoothed/
# python cluster.py ${prefix}embeddings-gene.pickle ${prefix}clusters-gene/unsmoothed/unmasked/

# differential analysis by clusters
python aggregate_imputed.py ${prefix}
python reorganize_imputed.py ${prefix}
python differential.py ${prefix}

# visualize spot-level gene expression data
python plot_spots.py ${prefix}

# # cell type inference
# # see data/markers/cell-type-template.tsv for an example of a cell type reference panel
# python pixannot.py ${prefix} data/markers/cell-type.tsv ${prefix}markers/cell-type/
# cp -r ${prefix}markers/cell-type/threshold010/* ${prefix}markers/cell-type/
# python enrich.py ${prefix}clusters-gene/ ${prefix}markers/cell-type/

# # user-defined tissue structure signature scores
# # see data/markers/signature-score-template.tsv for an example of a signature score reference panel
# python marker_score.py ${prefix} data/markers/signature-score.txt ${prefix}markers/signature-score
配置好以后
#!/bin/bash
set -e

prefix="data/demo/"

# download demo data
./download_demo.sh $prefix
# download pretrained models
./download_checkpoints.sh
# run pipeline
./run.sh $prefix
生活很好,有你更好
原创声明:本文系作者授权腾讯云开发者社区发表,未经许可,不得转载。
如有侵权,请联系 cloudcommunity@tencent.com 删除。
原创声明:本文系作者授权腾讯云开发者社区发表,未经许可,不得转载。
如有侵权,请联系 cloudcommunity@tencent.com 删除。
评论
登录后参与评论
推荐阅读
目录
腾讯云开发者

Copyright © 2013 - 2026 Tencent Cloud. All Rights Reserved. 腾讯云 版权所有
深圳市腾讯计算机系统有限公司 ICP备案/许可证号:粤B2-20090059 ![]() 粤公网安备44030502008569号
粤公网安备44030502008569号
腾讯云计算(北京)有限责任公司 京ICP证150476号 | 京ICP备11018762号