【征文】使用WorkBuddy快速将原型界面转换为前端页面代码
原创
【征文】使用WorkBuddy快速将原型界面转换为前端页面代码
原创
小明互联网技术分享社区
发布于 2026-10-19 10:13:30
发布于 2026-10-19 10:13:30
作为一个常年写后端的程序员,CRUD、接口设计、数据库调优、原型设计都还算顺手,但一到前端页面开发就有点头疼。不是完全不会写,而是太费时间:布局、样式、交互、响应式,零零碎碎一堆细节,写着写着个人项目的热情就被磨没了。基本上都是系统原型和后端都想清楚了,最后却卡在“页面还没搭出来”这一步。
最近我在尝试用 WorkBuddy 解决这个问题:拿产品原型界面直接快速生成 HTML 前端页面代码。它不是我之前想象中那种“生成个大概看看”的工具,而是能把原型里的结构先落成可运行、可继续改的前端页面,至少帮我把头疼的前端页面这个难题解决。这篇文章就记录一下我用 WorkBuddy 把原型界面转成前端页面的实际过程、效果,给同样被前端页面卡住的后端朋友做个参考
1、WorkBuddy介绍
WorkBuddy 是一个面向开发者的 AI 编程助手。和聊天式 AI 不同,它不只给建议,而是能直接接入本地环境:读项目文件、跑终端命令、改代码,甚至从零搭出网站或小工具,整个过程都能实时看到它在做什么。
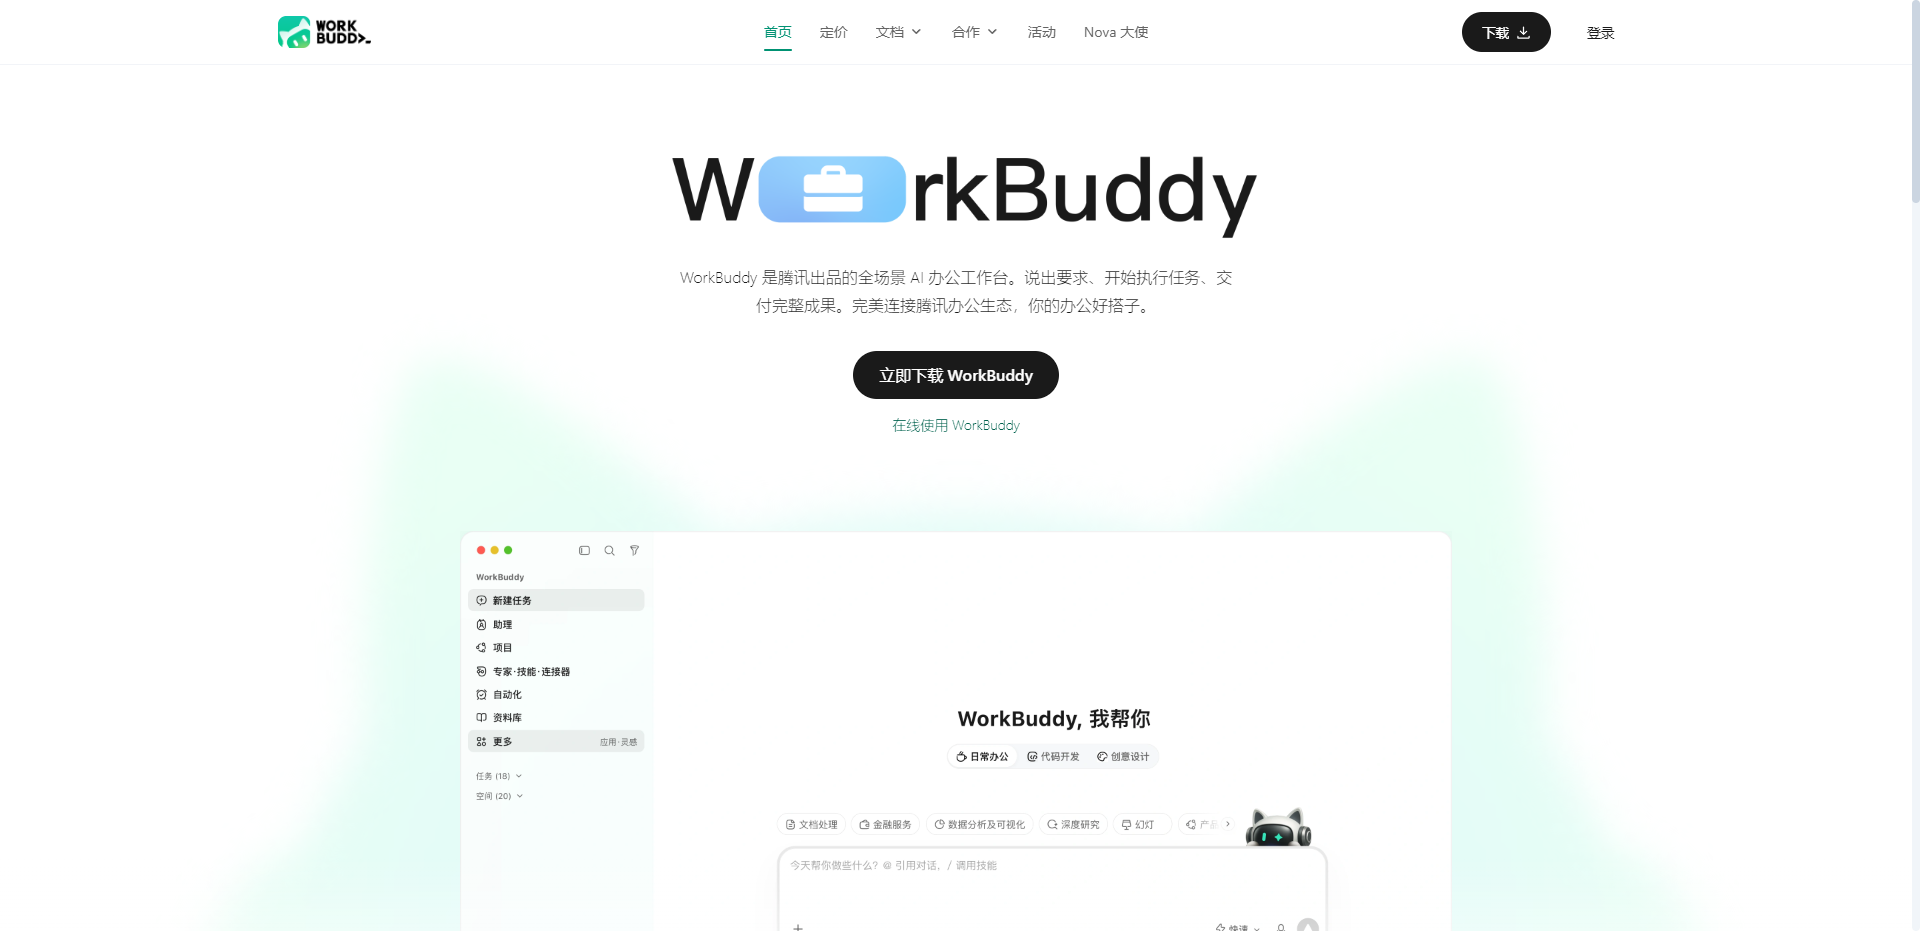
它支持 Agent 模式,你只要说清需求,它就会一步步落实,而不是只丢一段要自己拼装的代码。日常里,改本地脚本、验证想法、整理文件、跑批处理,都可以交给它。对一个想把机械劳动外包出去的开发者,这种"说清需求就能落地"的方式,确实好用。
官网:https://www.workbuddy.cn/events/invite?inviteCode=2tb66yrzsr7ee79a
2、上手过程
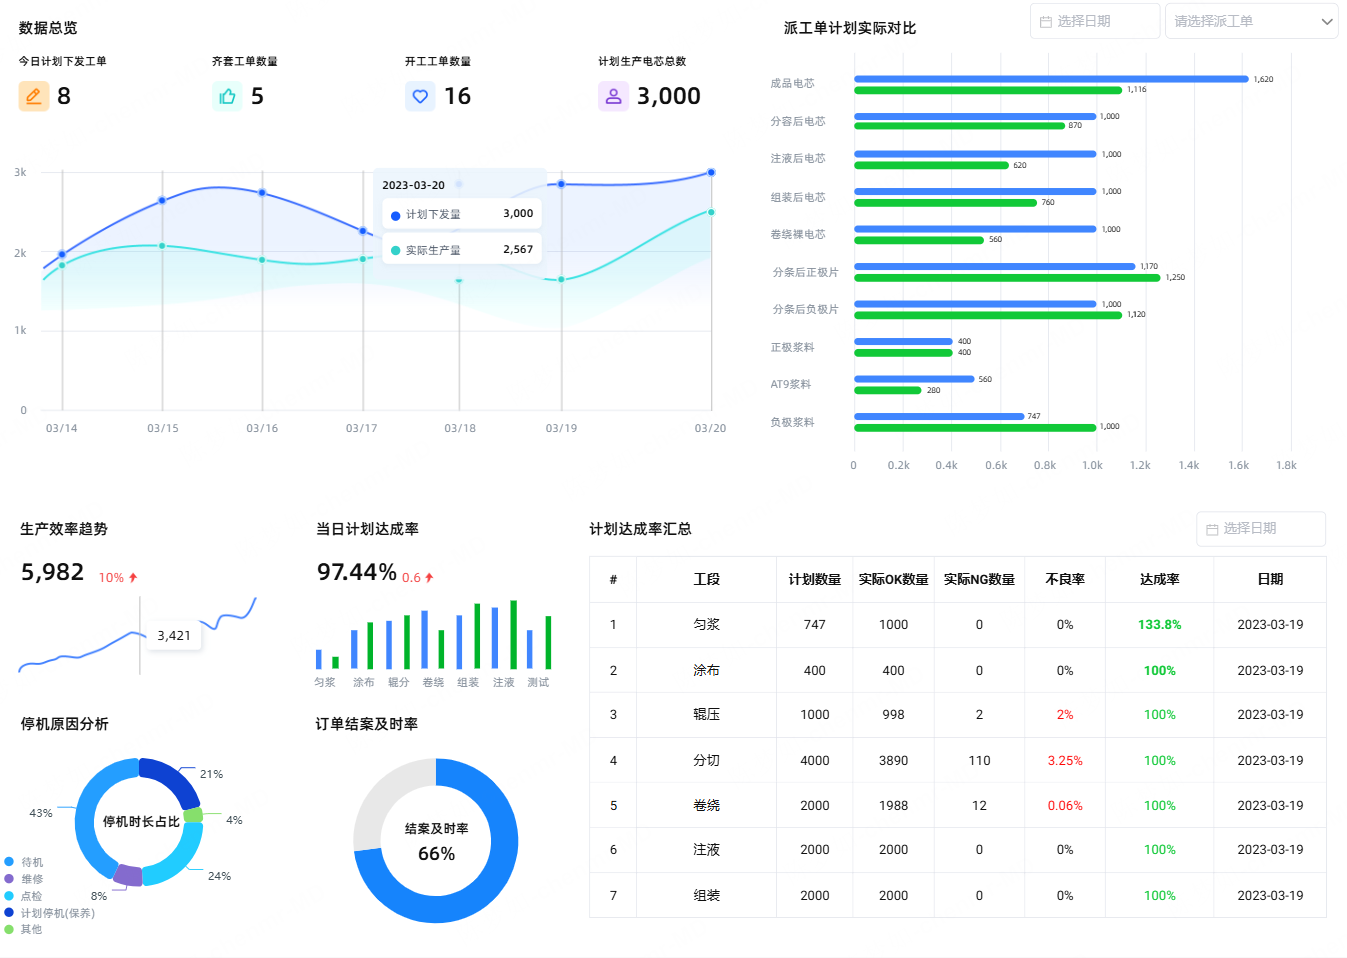
这里使用了一个工厂设备监控大屏界面来验证Workbuddy的静态图片转前端页面的功能。具体如下图:
首先打开我本地的WorkBuddy工具登录账户。
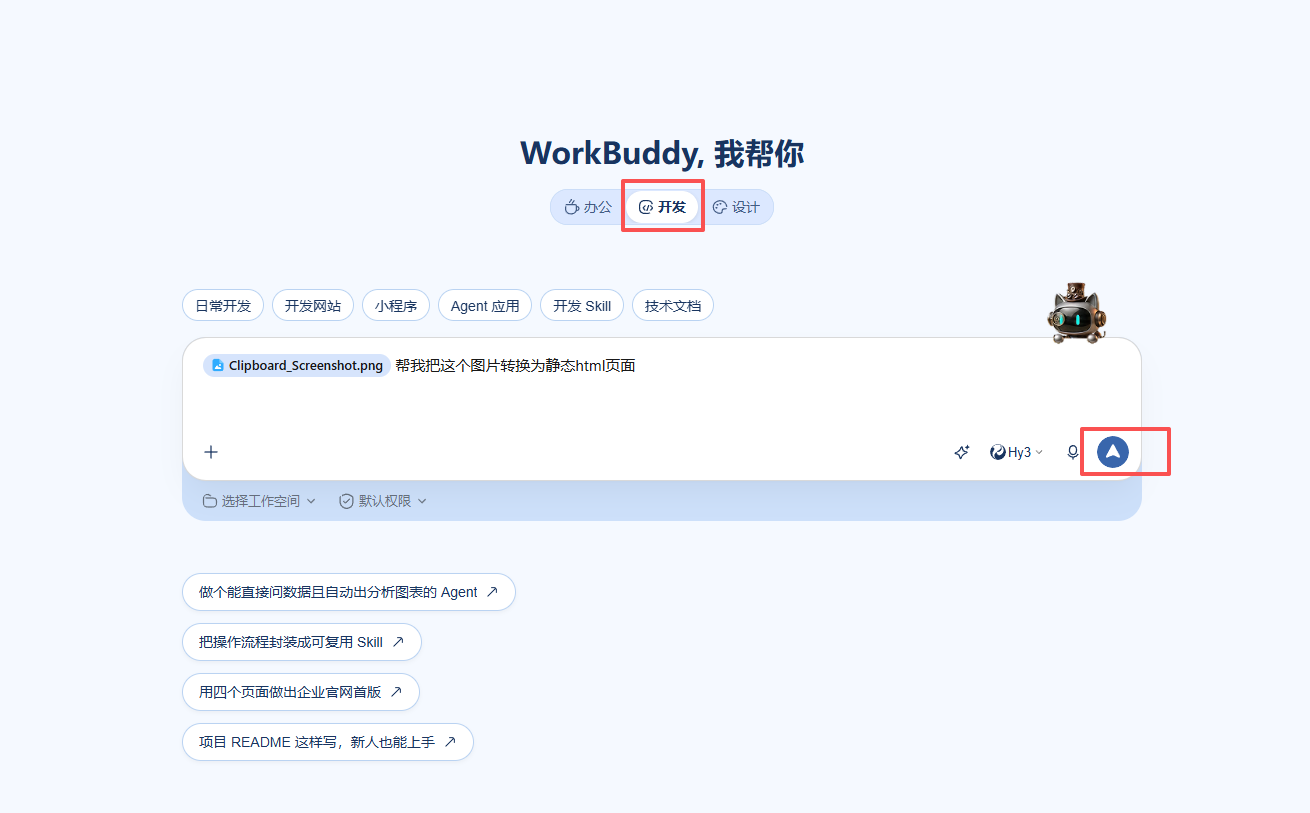
然后切换为开发模式,对话框输入“帮我把这个图片转换为静态html页面”,模型目前选择的是Hy3。然后点击右下角的按钮,工具开始进行工作。
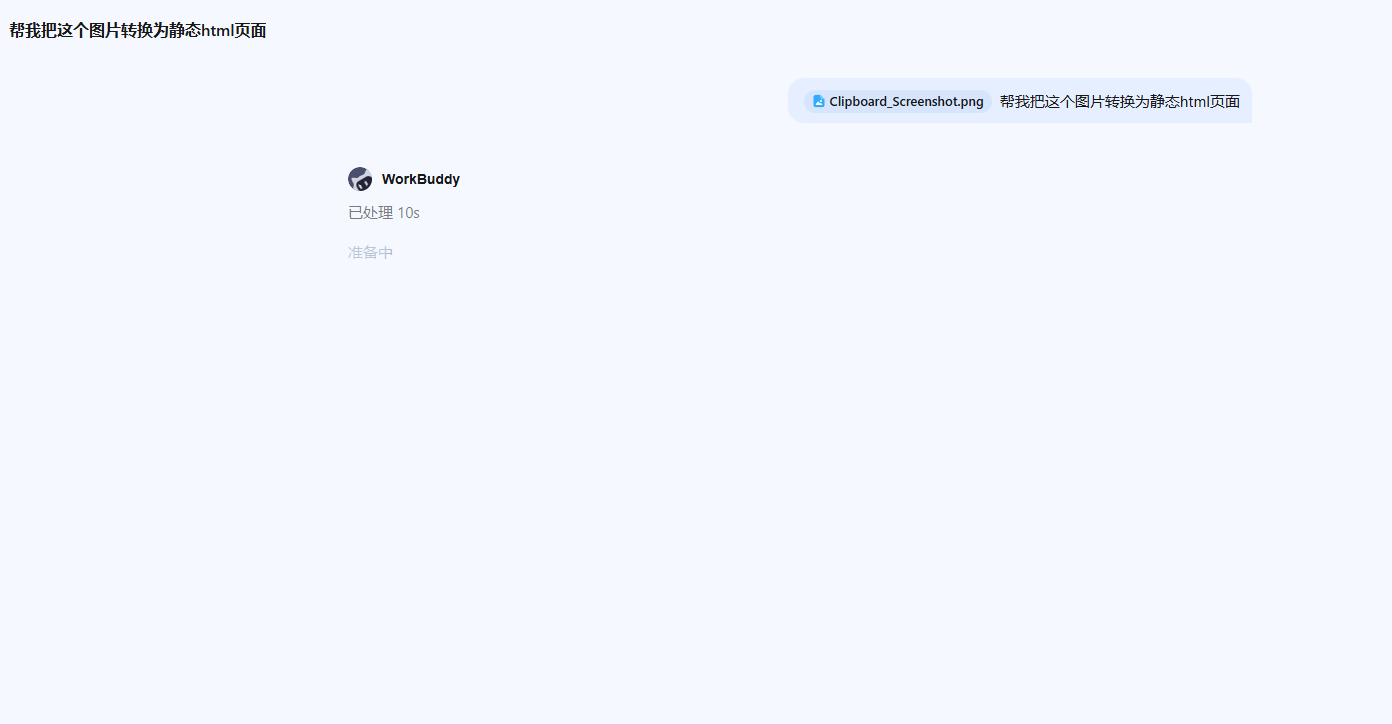
工具思考后给出了生成静态HTML页面的提示并且去执行。
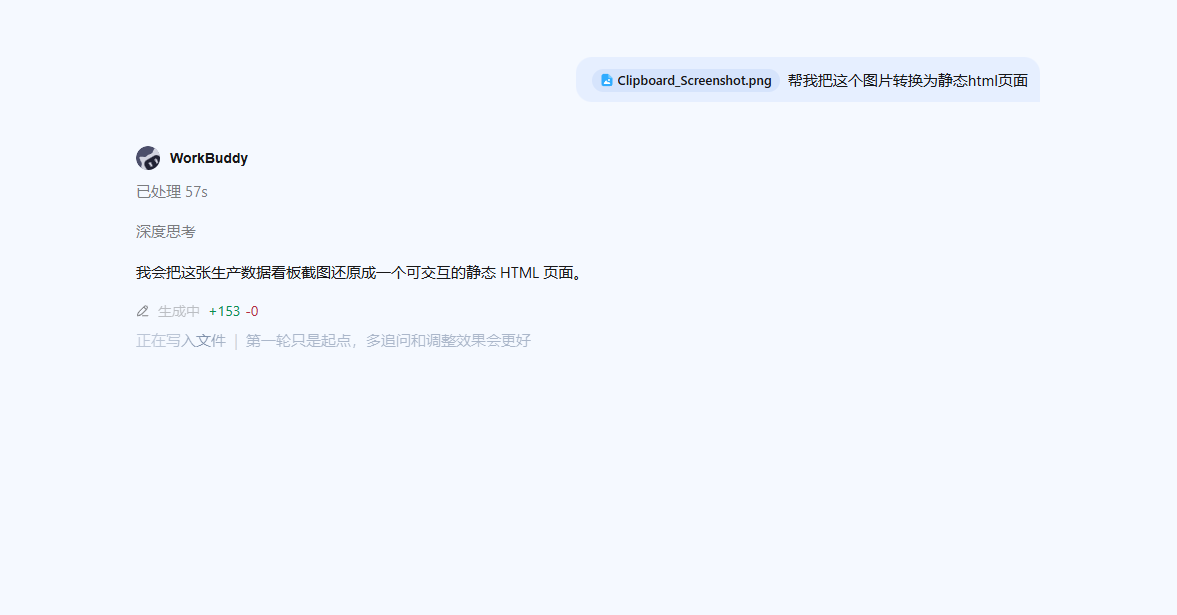
我这边大概等了两分钟左右输出了静态页面。
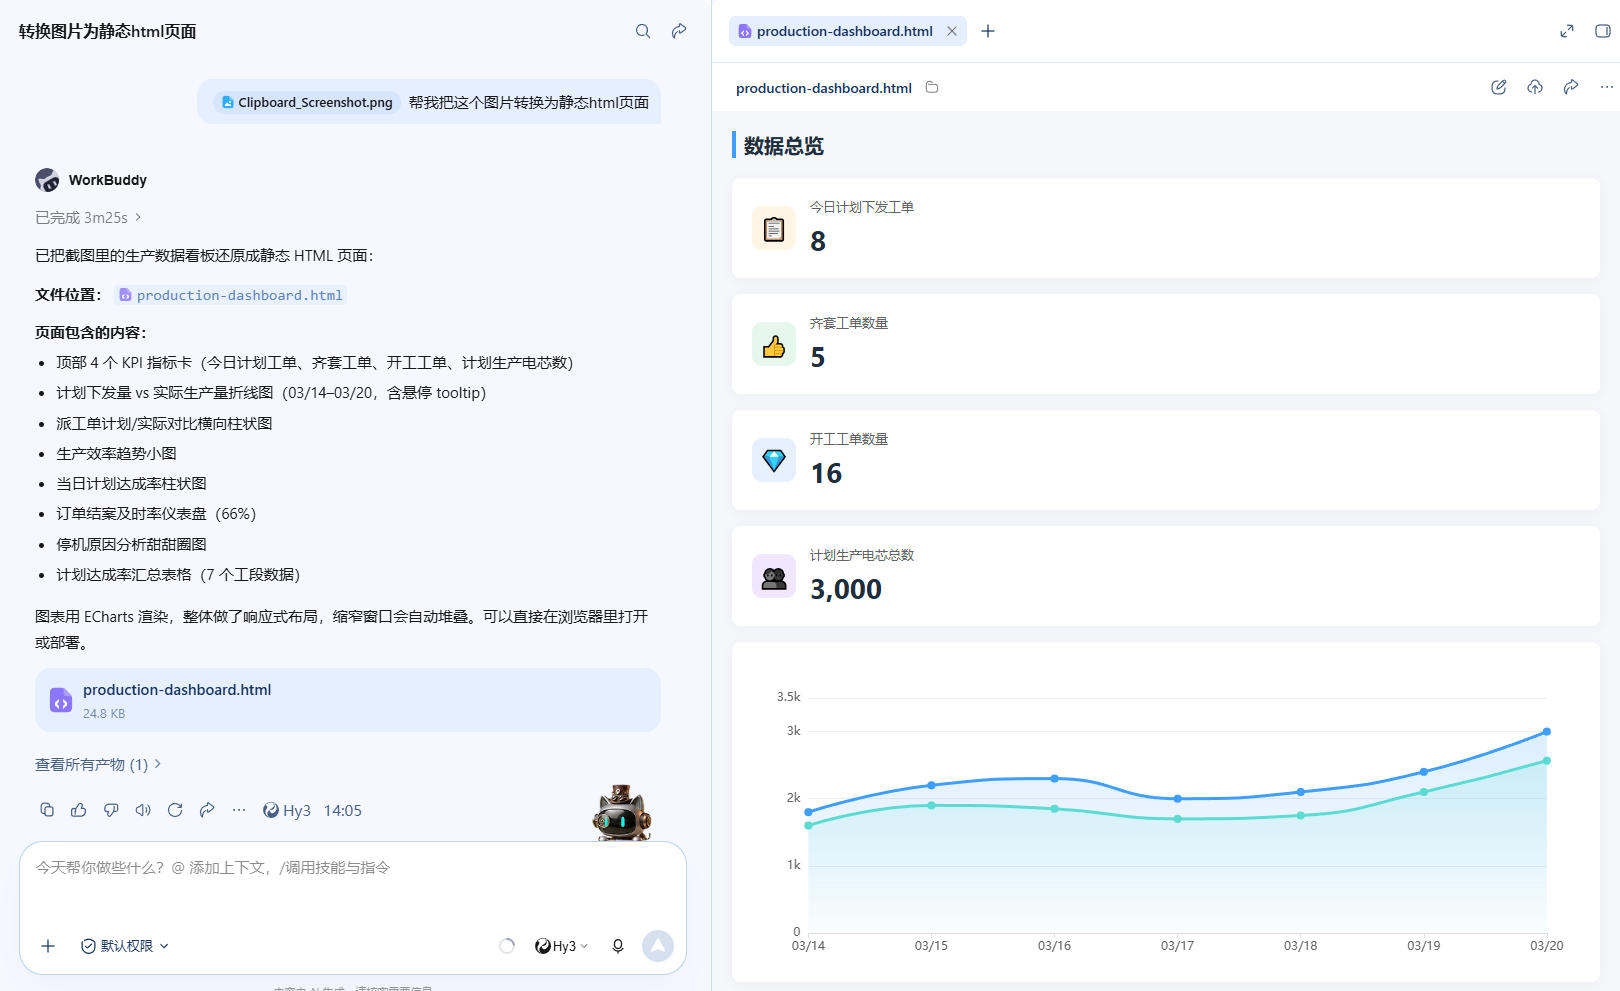
点击右上角全屏预览页面效果如下:
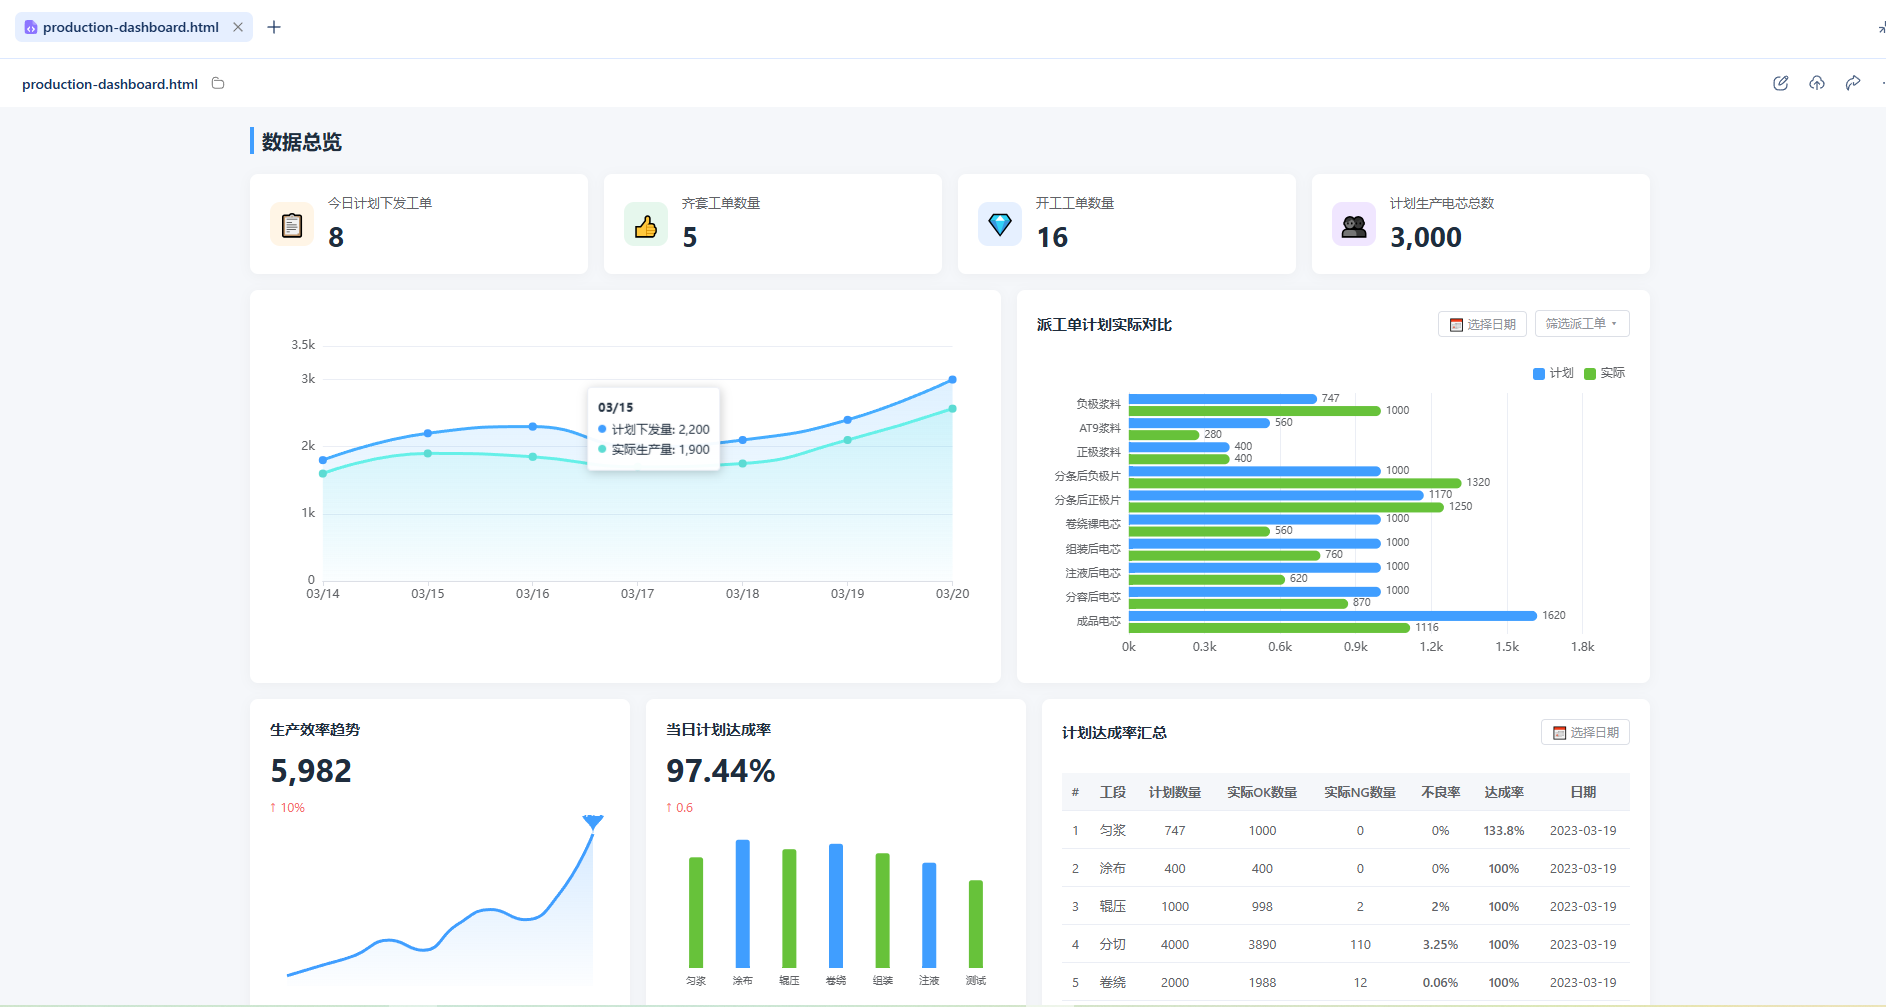
接着打开外部浏览器打开预览
页面的布局和整体效果几乎一样。
我们看下输出的结果:
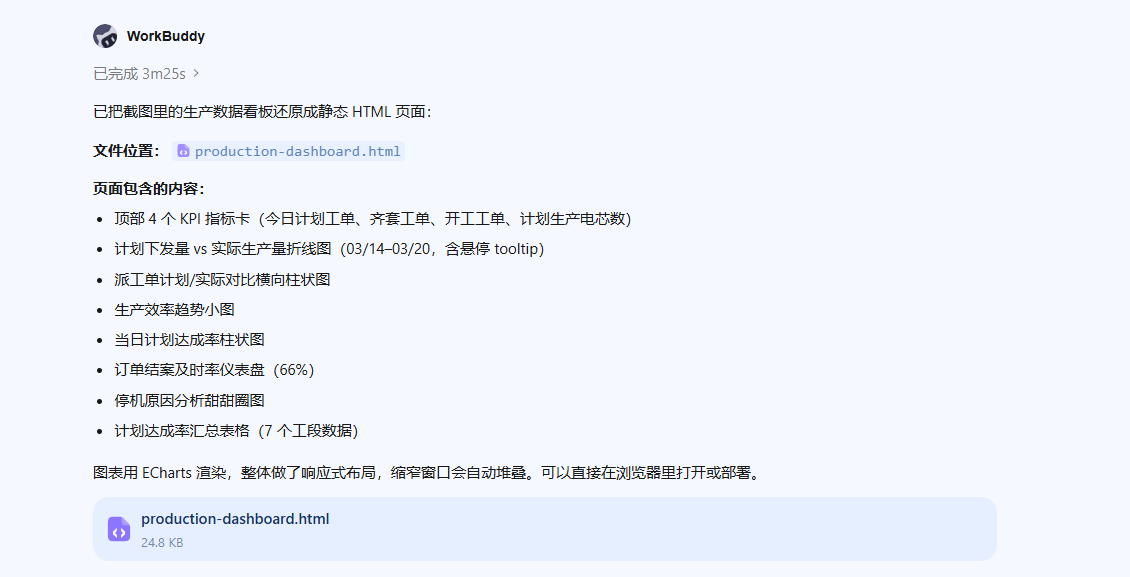
WorkBuddy工具把图片当中页面的元素解析的非常准确。针对图表模块使用了ECharts渲染。
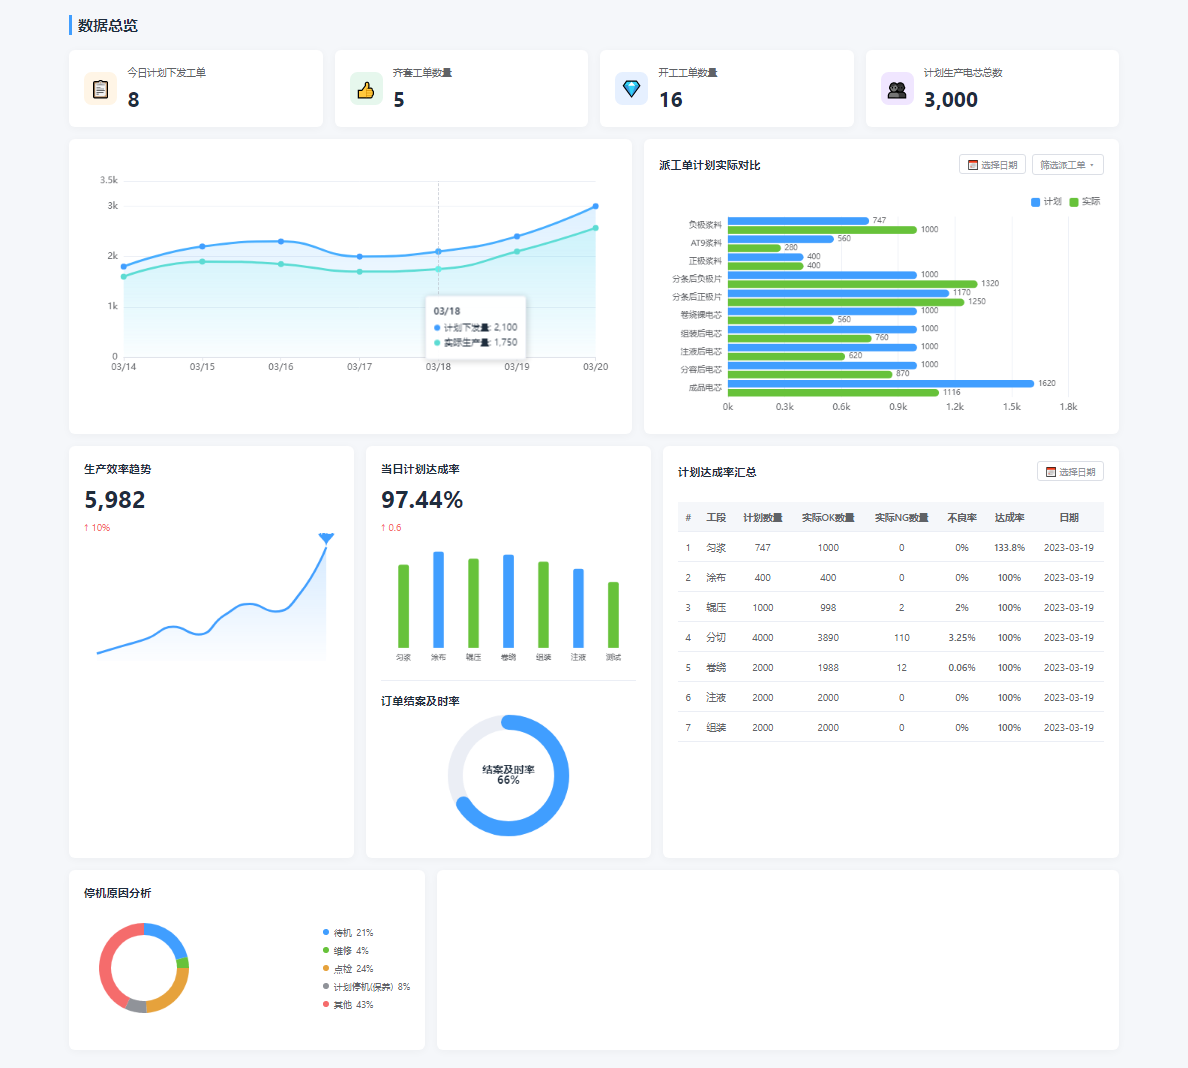
我们继续下一步操作,因为本地的项目是基于vue2开发的,接着把静态HTML页面转换为vue2代码。接着按照如下输入提示词继续工作。
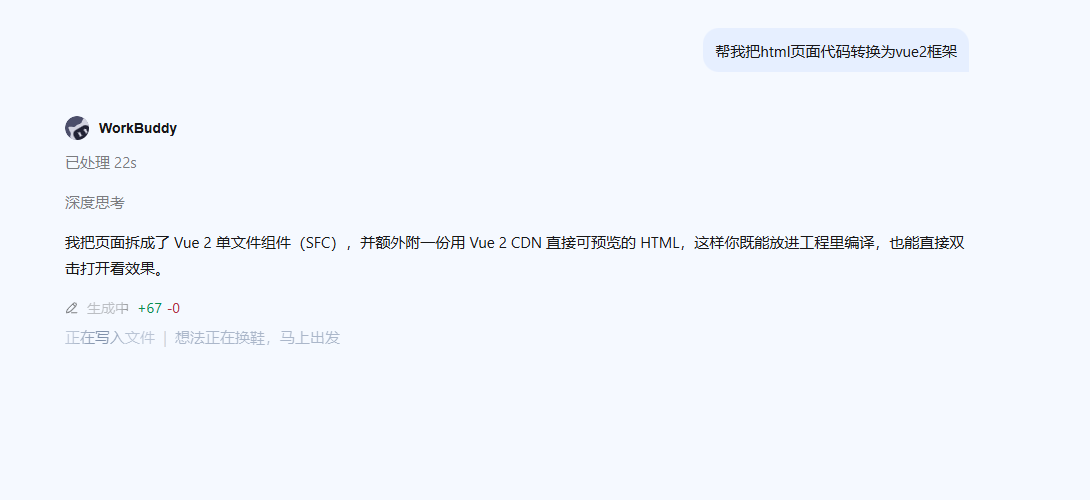
工具非常的贴心给出了Vue2单文件和Vue2 CDN可直接可预览的HTML。最终输出效果如下:
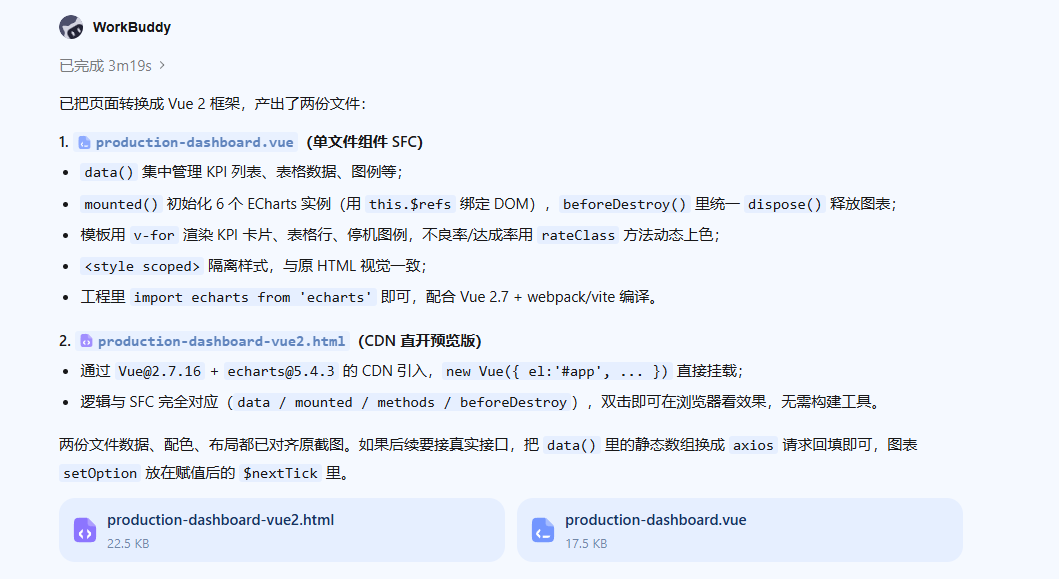
完整的production-dashboard.vue代码如下:
<template>
  <div class="dashboard-container">
    <div class="dashboard-title">数据总览</div>

    <!-- 顶部 KPI -->
    <div class="kpi-row">
      <div class="kpi-card" v-for="item in kpiList" :key="item.label">
        <div class="kpi-icon" :class="item.color">
          <span v-html="item.icon"></span>
        </div>
        <div>
          <div class="kpi-label">{{ item.label }}</div>
          <div class="kpi-value">{{ item.value }}</div>
        </div>
      </div>
    </div>

    <!-- 折线图 + 柱状图 -->
    <div class="chart-row">
      <div class="chart-card line-chart">
        <div ref="lineChart" class="chart"></div>
      </div>
      <div class="chart-card bar-chart">
        <div class="card-header" style="padding:0 0 10px 0;">
          <div class="card-title">派工单计划实际对比</div>
          <div class="card-tools">
            <span class="date-picker">📅 选择日期</span>
            <span class="select-box">筛选派工单 ▾</span>
          </div>
        </div>
        <div ref="barChart" class="chart"></div>
      </div>
    </div>

    <!-- 底部四模块 -->
    <div class="bottom-grid">
      <div class="card">
        <div class="card-title">生产效率趋势</div>
        <div class="metric-large">5,982</div>
        <div class="metric-sub up">10%</div>
        <div ref="trendChart" class="mini-chart"></div>
      </div>

      <div class="card">
        <div class="card-title">当日计划达成率</div>
        <div class="metric-large">97.44%</div>
        <div class="metric-sub up">0.6</div>
        <div ref="dailyChart" class="mini-chart"></div>

        <div style="margin-top: 16px; border-top: 1px solid #ebeef5; padding-top: 16px;">
          <div class="card-title">订单结案及时率</div>
          <div class="gauge-wrapper">
            <div ref="gaugeChart" class="gauge-chart"></div>
          </div>
        </div>
      </div>

      <div class="card">
        <div class="card-header" style="padding:0 0 12px 0;">
          <div class="card-title">计划达成率汇总</div>
          <span class="date-picker">📅 选择日期</span>
        </div>
        <table class="data-table">
          <thead>
            <tr>
              <th>#</th>
              <th>工段</th>
              <th>计划数量</th>
              <th>实际OK数量</th>
              <th>实际NG数量</th>
              <th>不良率</th>
              <th>达成率</th>
              <th>日期</th>
            </tr>
          </thead>
          <tbody>
            <tr v-for="row in tableData" :key="row.id">
              <td>{{ row.id }}</td>
              <td>{{ row.section }}</td>
              <td>{{ row.plan }}</td>
              <td>{{ row.ok }}</td>
              <td>{{ row.ng }}</td>
              <td :class="rateClass(row.badRate)">{{ row.badRate }}</td>
              <td :class="rateClass(row.achieve, true)">{{ row.achieve }}</td>
              <td>{{ row.date }}</td>
            </tr>
          </tbody>
        </table>
      </div>
    </div>

    <!-- 停机原因分析 -->
    <div class="row" style="margin-top: 16px;">
      <div class="card" style="flex: 1;">
        <div class="card-title">停机原因分析</div>
        <div class="donut-wrapper">
          <div ref="downtimeChart" class="donut-chart"></div>
          <div class="donut-legend">
            <div class="legend-item" v-for="item in downtimeLegend" :key="item.name">
              <span class="legend-dot" :style="{ background: item.color }"></span>
              {{ item.name }} <span>{{ item.value }}%</span>
            </div>
          </div>
        </div>
      </div>
      <div class="card" style="flex: 2;"></div>
    </div>
  </div>
</template>

<script>
import echarts from 'echarts'

export default {
  name: 'ProductionDashboard',
  data () {
    return {
      charts: {},
      colors: {
        blue: '#409eff',
        green: '#67c23a',
        cyan: '#5cdbd3',
        orange: '#e6a23c',
        red: '#f56c6c',
        gray: '#909399',
        purple: '#9254de'
      },
      kpiList: [
        { label: '今日计划下发工单', value: 8, icon: '📋', color: 'orange' },
        { label: '齐套工单数量', value: 5, icon: '👍', color: 'green' },
        { label: '开工工单数量', value: 16, icon: '💎', color: 'blue' },
        { label: '计划生产电芯总数', value: '3,000', icon: '👥', color: 'purple' }
      ],
      tableData: [
        { id: 1, section: '匀浆', plan: 747, ok: 1000, ng: 0, badRate: '0%', achieve: '133.8%', date: '2023-03-19' },
        { id: 2, section: '涂布', plan: 400, ok: 400, ng: 0, badRate: '0%', achieve: '100%', date: '2023-03-19' },
        { id: 3, section: '辊压', plan: 1000, ok: 998, ng: 2, badRate: '2%', achieve: '100%', date: '2023-03-19' },
        { id: 4, section: '分切', plan: 4000, ok: 3890, ng: 110, badRate: '3.25%', achieve: '100%', date: '2023-03-19' },
        { id: 5, section: '卷绕', plan: 2000, ok: 1988, ng: 12, badRate: '0.06%', achieve: '100%', date: '2023-03-19' },
        { id: 6, section: '注液', plan: 2000, ok: 2000, ng: 0, badRate: '0%', achieve: '100%', date: '2023-03-19' },
        { id: 7, section: '组装', plan: 2000, ok: 2000, ng: 0, badRate: '0%', achieve: '100%', date: '2023-03-19' }
      ],
      downtimeLegend: [
        { name: '待机', value: 21, color: '#409eff' },
        { name: '维修', value: 4, color: '#67c23a' },
        { name: '点检', value: 24, color: '#e6a23c' },
        { name: '计划停机(保养)', value: 8, color: '#909399' },
        { name: '其他', value: 43, color: '#f56c6c' }
      ]
    }
  },
  mounted () {
    this.initLineChart()
    this.initBarChart()
    this.initTrendChart()
    this.initDailyChart()
    this.initGaugeChart()
    this.initDowntimeChart()
    window.addEventListener('resize', this.handleResize)
  },
  beforeDestroy () {
    window.removeEventListener('resize', this.handleResize)
    Object.values(this.charts).forEach(chart => chart && chart.dispose())
  },
  methods: {
    rateClass (rate, isAchieve) {
      if (isAchieve) return 'rate-high'
      const num = parseFloat(rate)
      if (num === 0) return 'rate-normal'
      return num >= 1 ? 'rate-low' : 'rate-normal'
    },

    handleResize () {
      Object.values(this.charts).forEach(chart => chart && chart.resize())
    },

    initLineChart () {
      const chart = echarts.init(this.$refs.lineChart)
      chart.setOption({
        tooltip: {
          trigger: 'axis',
          backgroundColor: 'rgba(255,255,255,0.95)',
          borderColor: '#ebeef5',
          textStyle: { color: '#1f2d3d', fontSize: 12 },
          formatter: (params) => {
            let html = `<div style="font-weight:600;margin-bottom:4px;">${params[0].axisValue}</div>`
            params.forEach(p => {
              html += `<div style="display:flex;align-items:center;gap:6px;margin:2px 0;">
                <span style="width:8px;height:8px;border-radius:50%;background:${p.color};"></span>
                <span>${p.seriesName}: ${p.value.toLocaleString()}</span></div>`
            })
            return html
          }
        },
        grid: { left: '3%', right: '4%', bottom: '3%', top: '12%', containLabel: true },
        xAxis: {
          type: 'category',
          boundaryGap: false,
          data: ['03/14', '03/15', '03/16', '03/17', '03/18', '03/19', '03/20'],
          axisLine: { lineStyle: { color: '#dcdfe6' } },
          axisLabel: { color: '#606266' }
        },
        yAxis: {
          type: 'value',
          min: 0, max: 3500, interval: 1000,
          axisLine: { show: false },
          splitLine: { lineStyle: { color: '#ebeef5' } },
          axisLabel: { color: '#606266', formatter: v => v === 0 ? '0' : (v / 1000) + 'k' }
        },
        series: [
          {
            name: '计划下发量',
            type: 'line', smooth: true, symbol: 'circle', symbolSize: 8,
            data: [1800, 2200, 2300, 2000, 2100, 2400, 3000],
            itemStyle: { color: this.colors.blue },
            lineStyle: { width: 3 },
            areaStyle: {
              color: new echarts.graphic.LinearGradient(0, 0, 0, 1, [
                { offset: 0, color: 'rgba(64,158,255,0.25)' },
                { offset: 1, color: 'rgba(64,158,255,0.02)' }
              ])
            }
          },
          {
            name: '实际生产量',
            type: 'line', smooth: true, symbol: 'circle', symbolSize: 8,
            data: [1600, 1900, 1850, 1700, 1750, 2100, 2567],
            itemStyle: { color: this.colors.cyan },
            lineStyle: { width: 3 },
            areaStyle: {
              color: new echarts.graphic.LinearGradient(0, 0, 0, 1, [
                { offset: 0, color: 'rgba(92,219,211,0.25)' },
                { offset: 1, color: 'rgba(92,219,211,0.02)' }
              ])
            }
          }
        ]
      })
      this.charts.line = chart
    },

    initBarChart () {
      const chart = echarts.init(this.$refs.barChart)
      const categories = ['成品电芯', '分容后电芯', '注液后电芯', '组装后电芯', '卷绕裸电芯', '分条后正极片', '分条后负极片', '正极浆料', 'AT9浆料', '负极浆料']
      chart.setOption({
        tooltip: {
          trigger: 'axis', axisPointer: { type: 'shadow' },
          backgroundColor: 'rgba(255,255,255,0.95)',
          borderColor: '#ebeef5', textStyle: { color: '#1f2d3d', fontSize: 12 }
        },
        legend: {
          data: ['计划', '实际'], top: 0, right: 0,
          itemWidth: 12, itemHeight: 12, textStyle: { color: '#606266', fontSize: 12 }
        },
        grid: { left: '3%', right: '8%', bottom: '3%', top: '10%', containLabel: true },
        xAxis: {
          type: 'value',
          axisLine: { lineStyle: { color: '#dcdfe6' } },
          splitLine: { lineStyle: { color: '#ebeef5' } },
          axisLabel: { color: '#606266', formatter: v => (v / 1000) + 'k' }
        },
        yAxis: {
          type: 'category', data: categories,
          axisLine: { lineStyle: { color: '#dcdfe6' } },
          axisLabel: { color: '#606266', fontSize: 11 },
          axisTick: { show: false }
        },
        series: [
          {
            name: '计划', type: 'bar', data: [1620, 1000, 1000, 1000, 1000, 1170, 1000, 400, 560, 747],
            barWidth: 10, itemStyle: { color: this.colors.blue, borderRadius: [0, 5, 5, 0] },
            label: { show: true, position: 'right', color: '#606266', fontSize: 10, formatter: '{c}' }
          },
          {
            name: '实际', type: 'bar', data: [1116, 870, 620, 760, 560, 1250, 1320, 400, 280, 1000],
            barWidth: 10, itemStyle: { color: this.colors.green, borderRadius: [0, 5, 5, 0] },
            label: { show: true, position: 'right', color: '#606266', fontSize: 10, formatter: '{c}' }
          }
        ]
      })
      this.charts.bar = chart
    },

    initTrendChart () {
      const chart = echarts.init(this.$refs.trendChart)
      chart.setOption({
        grid: { left: 0, right: 0, top: '10%', bottom: '5%' },
        xAxis: { type: 'category', show: false, data: [1, 2, 3, 4, 5, 6, 7, 8, 9, 10] },
        yAxis: { type: 'value', show: false, min: 3000 },
        series: [{
          type: 'line', smooth: true, symbol: 'none',
          data: [3200, 3400, 3600, 3900, 3700, 4200, 4500, 4300, 4800, 5982],
          lineStyle: { color: this.colors.blue, width: 3 },
          areaStyle: {
            color: new echarts.graphic.LinearGradient(0, 0, 0, 1, [
              { offset: 0, color: 'rgba(64,158,255,0.3)' },
              { offset: 1, color: 'rgba(64,158,255,0.02)' }
            ])
          },
          markPoint: {
            data: [{ coord: [9, 5982], value: '3,421', itemStyle: { color: this.colors.blue } }],
            symbolSize: 40, label: { color: '#fff', fontSize: 10 }
          }
        }]
      })
      this.charts.trend = chart
    },

    initDailyChart () {
      const chart = echarts.init(this.$refs.dailyChart)
      chart.setOption({
        grid: { left: '2%', right: '2%', top: '10%', bottom: '15%' },
        xAxis: {
          type: 'category', data: ['匀浆', '涂布', '辊压', '卷绕', '组装', '注液', '测试'],
          axisLine: { show: false }, axisTick: { show: false },
          axisLabel: { color: '#606266', fontSize: 10 }
        },
        yAxis: { type: 'value', show: false },
        series: [{
          type: 'bar', data: [82, 95, 88, 92, 85, 78, 65], barWidth: 14,
          itemStyle: {
            color: (p) => p.dataIndex % 2 === 0 ? this.colors.green : this.colors.blue,
            borderRadius: [3, 3, 0, 0]
          }
        }]
      })
      this.charts.daily = chart
    },

    initGaugeChart () {
      const chart = echarts.init(this.$refs.gaugeChart)
      chart.setOption({
        series: [{
          type: 'gauge', startAngle: 90, endAngle: -270, radius: '90%',
          pointer: { show: false },
          progress: { show: true, overlap: false, roundCap: true, clip: false, itemStyle: { color: this.colors.blue } },
          axisLine: { lineStyle: { width: 20, color: [[1, '#ebeef5']] } },
          splitLine: { show: false }, axisTick: { show: false }, axisLabel: { show: false },
          data: [{ value: 66, name: '结案及时率\n66%' }],
          title: { offsetCenter: ['0%', '0%'], fontSize: 14, color: '#1f2d3d', fontWeight: 600 },
          detail: { show: false }
        }]
      })
      this.charts.gauge = chart
    },

    initDowntimeChart () {
      const chart = echarts.init(this.$refs.downtimeChart)
      chart.setOption({
        tooltip: { trigger: 'item', formatter: '{b}: {d}%' },
        series: [{
          type: 'pie', radius: ['55%', '75%'],
          avoidLabelOverlap: false, label: { show: false }, labelLine: { show: false },
          data: [
            { value: 21, name: '待机', itemStyle: { color: this.colors.blue } },
            { value: 4, name: '维修', itemStyle: { color: this.colors.green } },
            { value: 24, name: '点检', itemStyle: { color: this.colors.orange } },
            { value: 8, name: '计划停机(保养)', itemStyle: { color: this.colors.gray } },
            { value: 43, name: '其他', itemStyle: { color: this.colors.red } }
          ]
        }]
      })
      this.charts.downtime = chart
    }
  }
}
</script>

<style scoped>
.dashboard-container {
  max-width: 1400px;
  margin: 0 auto;
}
.dashboard-title {
  font-size: 20px;
  font-weight: 600;
  color: #1f2d3d;
  margin-bottom: 20px;
  padding-left: 8px;
  border-left: 4px solid #409eff;
}
.row { display: flex; gap: 16px; margin-bottom: 16px; }
.card {
  background: #fff;
  border-radius: 8px;
  box-shadow: 0 2px 12px rgba(0,0,0,0.04);
  padding: 20px;
  flex: 1;
}
.card-header { display: flex; justify-content: space-between; align-items: center; margin-bottom: 16px; }
.card-title { font-size: 15px; font-weight: 600; color: #1f2d3d; }
.card-tools { display: flex; gap: 8px; align-items: center; }
.date-picker {
  font-size: 12px; color: #909399; border: 1px solid #dcdfe6;
  border-radius: 4px; padding: 4px 10px; background: #fff; cursor: pointer;
}
.select-box {
  font-size: 12px; color: #909399; border: 1px solid #dcdfe6;
  border-radius: 4px; padding: 4px 10px; background: #fff; cursor: pointer;
}
.kpi-row { display: flex; gap: 16px; margin-bottom: 16px; }
.kpi-card {
  flex: 1; background: #fff; border-radius: 8px; padding: 20px;
  box-shadow: 0 2px 12px rgba(0,0,0,0.04);
  display: flex; align-items: center; gap: 14px;
}
.kpi-icon { width: 44px; height: 44px; border-radius: 10px; display: flex; align-items: center; justify-content: center; font-size: 22px; }
.kpi-icon.orange { background: #fff5e6; }
.kpi-icon.green { background: #e6f7ed; }
.kpi-icon.blue { background: #e6f0ff; }
.kpi-icon.purple { background: #f0e6ff; }
.kpi-label { font-size: 13px; color: #606266; margin-bottom: 6px; }
.kpi-value { font-size: 28px; font-weight: 700; color: #1f2d3d; }
.chart-row { display: flex; gap: 16px; margin-bottom: 16px; }
.chart-card { background: #fff; border-radius: 8px; box-shadow: 0 2px 12px rgba(0,0,0,0.04); padding: 20px; }
.chart-card.line-chart { flex: 1.2; }
.chart-card.bar-chart { flex: 1; }
.chart { width: 100%; height: 300px; }
.bottom-grid { display: grid; grid-template-columns: 1fr 1fr 1.6fr; gap: 16px; }
.bottom-grid .card { min-height: 260px; }
.mini-chart { width: 100%; height: 180px; }
.metric-large { font-size: 32px; font-weight: 700; color: #1f2d3d; margin: 8px 0; }
.metric-sub { font-size: 13px; color: #f56c6c; display: flex; align-items: center; gap: 4px; }
.metric-sub.up::before { content: "↑"; }
.data-table { width: 100%; border-collapse: collapse; font-size: 13px; }
.data-table th {
  background: #f5f7fa; color: #606266; font-weight: 600;
  padding: 10px 8px; text-align: center; border-bottom: 1px solid #ebeef5;
}
.data-table td {
  padding: 10px 8px; text-align: center; border-bottom: 1px solid #ebeef5; color: #606266;
}
.data-table tr:hover td { background: #f5f7fa; }
.rate-high { color: #67c23a; font-weight: 600; }
.rate-low { color: #f56c6c; font-weight: 600; }
.rate-normal { color: #606266; }
.donut-wrapper { display: flex; align-items: center; justify-content: space-between; height: 180px; }
.donut-chart { width: 160px; height: 160px; }
.donut-legend { display: flex; flex-direction: column; gap: 8px; font-size: 12px; color: #606266; }
.legend-item { display: flex; align-items: center; gap: 6px; }
.legend-dot { width: 8px; height: 8px; border-radius: 50%; }
.gauge-wrapper { display: flex; align-items: center; justify-content: center; height: 180px; }
.gauge-chart { width: 180px; height: 180px; }

@media (max-width: 1200px) {
  .chart-row, .kpi-row, .row { flex-direction: column; }
  .bottom-grid { grid-template-columns: 1fr; }
}
</style>
完整的production-dashboard-vue2.html代码如下:
<!DOCTYPE html>
<html lang="zh-CN">
<head>
<meta charset="UTF-8">
<meta name="viewport" content="width=device-width, initial-scale=1.0">
<title>生产数据总览看板 (Vue 2)</title>
<script src="https://cdn.jsdelivr.net/npm/vue@2.7.16/dist/vue.min.js"></script>
<script src="https://cdn.jsdelivr.net/npm/echarts@5.4.3/dist/echarts.min.js"></script>
<style>
* { margin: 0; padding: 0; box-sizing: border-box; }
body {
font-family: -apple-system, BlinkMacSystemFont, "Segoe UI", "PingFang SC", "Microsoft YaHei", sans-serif;
background: #f5f7fa; color: #1f2d3d; padding: 20px;
}
.dashboard-container { max-width: 1400px; margin: 0 auto; }
.dashboard-title { font-size: 20px; font-weight: 600; color: #1f2d3d; margin-bottom: 20px; padding-left: 8px; border-left: 4px solid #409eff; }
.row { display: flex; gap: 16px; margin-bottom: 16px; }
.card { background: #fff; border-radius: 8px; box-shadow: 0 2px 12px rgba(0,0,0,0.04); padding: 20px; flex: 1; }
.card-header { display: flex; justify-content: space-between; align-items: center; margin-bottom: 16px; }
.card-title { font-size: 15px; font-weight: 600; color: #1f2d3d; }
.card-tools { display: flex; gap: 8px; align-items: center; }
.date-picker { font-size: 12px; color: #909399; border: 1px solid #dcdfe6; border-radius: 4px; padding: 4px 10px; background: #fff; cursor: pointer; }
.select-box { font-size: 12px; color: #909399; border: 1px solid #dcdfe6; border-radius: 4px; padding: 4px 10px; background: #fff; cursor: pointer; }
.kpi-row { display: flex; gap: 16px; margin-bottom: 16px; }
.kpi-card { flex: 1; background: #fff; border-radius: 8px; padding: 20px; box-shadow: 0 2px 12px rgba(0,0,0,0.04); display: flex; align-items: center; gap: 14px; }
.kpi-icon { width: 44px; height: 44px; border-radius: 10px; display: flex; align-items: center; justify-content: center; font-size: 22px; }
.kpi-icon.orange { background: #fff5e6; }
.kpi-icon.green { background: #e6f7ed; }
.kpi-icon.blue { background: #e6f0ff; }
.kpi-icon.purple { background: #f0e6ff; }
.kpi-label { font-size: 13px; color: #606266; margin-bottom: 6px; }
.kpi-value { font-size: 28px; font-weight: 700; color: #1f2d3d; }
.chart-row { display: flex; gap: 16px; margin-bottom: 16px; }
.chart-card { background: #fff; border-radius: 8px; box-shadow: 0 2px 12px rgba(0,0,0,0.04); padding: 20px; }
.chart-card.line-chart { flex: 1.2; }
.chart-card.bar-chart { flex: 1; }
.chart { width: 100%; height: 300px; }
.bottom-grid { display: grid; grid-template-columns: 1fr 1fr 1.6fr; gap: 16px; }
.bottom-grid .card { min-height: 260px; }
.mini-chart { width: 100%; height: 180px; }
.metric-large { font-size: 32px; font-weight: 700; color: #1f2d3d; margin: 8px 0; }
.metric-sub { font-size: 13px; color: #f56c6c; display: flex; align-items: center; gap: 4px; }
.metric-sub.up::before { content: "↑"; }
.data-table { width: 100%; border-collapse: collapse; font-size: 13px; }
.data-table th { background: #f5f7fa; color: #606266; font-weight: 600; padding: 10px 8px; text-align: center; border-bottom: 1px solid #ebeef5; }
.data-table td { padding: 10px 8px; text-align: center; border-bottom: 1px solid #ebeef5; color: #606266; }
.data-table tr:hover td { background: #f5f7fa; }
.rate-high { color: #67c23a; font-weight: 600; }
.rate-low { color: #f56c6c; font-weight: 600; }
.rate-normal { color: #606266; }
.donut-wrapper { display: flex; align-items: center; justify-content: space-between; height: 180px; }
.donut-chart { width: 160px; height: 160px; }
.donut-legend { display: flex; flex-direction: column; gap: 8px; font-size: 12px; color: #606266; }
.legend-item { display: flex; align-items: center; gap: 6px; }
.legend-dot { width: 8px; height: 8px; border-radius: 50%; }
.gauge-wrapper { display: flex; align-items: center; justify-content: center; height: 180px; }
.gauge-chart { width: 180px; height: 180px; }
@media (max-width: 1200px) {
.chart-row, .kpi-row, .row { flex-direction: column; }
.bottom-grid { grid-template-columns: 1fr; }
}
</style>
</head>
<body>
<div id="app" class="dashboard-container">
<div class="dashboard-title">数据总览</div>
<!-- 顶部 KPI -->
<div class="kpi-row">
<div class="kpi-card" v-for="item in kpiList" :key="item.label">
<div class="kpi-icon" :class="item.color"><span v-html="item.icon"></span></div>
<div>
<div class="kpi-label">{{ item.label }}</div>
<div class="kpi-value">{{ item.value }}</div>
</div>
</div>
</div>
<!-- 折线图 + 柱状图 -->
<div class="chart-row">
<div class="chart-card line-chart">
<div ref="lineChart" class="chart"></div>
</div>
<div class="chart-card bar-chart">
<div class="card-header" style="padding:0 0 10px 0;">
<div class="card-title">派工单计划实际对比</div>
<div class="card-tools">
<span class="date-picker">📅 选择日期</span>
<span class="select-box">筛选派工单 ▾</span>
</div>
</div>
<div ref="barChart" class="chart"></div>
</div>
</div>
<!-- 底部四模块 -->
<div class="bottom-grid">
<div class="card">
<div class="card-title">生产效率趋势</div>
<div class="metric-large">5,982</div>
<div class="metric-sub up">10%</div>
<div ref="trendChart" class="mini-chart"></div>
</div>
<div class="card">
<div class="card-title">当日计划达成率</div>
<div class="metric-large">97.44%</div>
<div class="metric-sub up">0.6</div>
<div ref="dailyChart" class="mini-chart"></div>
<div style="margin-top: 16px; border-top: 1px solid #ebeef5; padding-top: 16px;">
<div class="card-title">订单结案及时率</div>
<div class="gauge-wrapper">
<div ref="gaugeChart" class="gauge-chart"></div>
</div>
</div>
</div>
<div class="card">
<div class="card-header" style="padding:0 0 12px 0;">
<div class="card-title">计划达成率汇总</div>
<span class="date-picker">📅 选择日期</span>
</div>
<table class="data-table">
<thead>
<tr>
<th>#</th><th>工段</th><th>计划数量</th><th>实际OK数量</th>
<th>实际NG数量</th><th>不良率</th><th>达成率</th><th>日期</th>
</tr>
</thead>
<tbody>
<tr v-for="row in tableData" :key="row.id">
<td>{{ row.id }}</td>
<td>{{ row.section }}</td>
<td>{{ row.plan }}</td>
<td>{{ row.ok }}</td>
<td>{{ row.ng }}</td>
<td :class="rateClass(row.badRate)">{{ row.badRate }}</td>
<td :class="rateClass(row.achieve, true)">{{ row.achieve }}</td>
<td>{{ row.date }}</td>
</tr>
</tbody>
</table>
</div>
</div>
<!-- 停机原因分析 -->
<div class="row" style="margin-top: 16px;">
<div class="card" style="flex: 1;">
<div class="card-title">停机原因分析</div>
<div class="donut-wrapper">
<div ref="downtimeChart" class="donut-chart"></div>
<div class="donut-legend">
<div class="legend-item" v-for="item in downtimeLegend" :key="item.name">
<span class="legend-dot" :style="{ background: item.color }"></span>
{{ item.name }} <span>{{ item.value }}%</span>
</div>
</div>
</div>
</div>
<div class="card" style="flex: 2;"></div>
</div>
</div>
<script>
new Vue({
el: '#app',
data: {
charts: {},
colors: {
blue: '#409eff', green: '#67c23a', cyan: '#5cdbd3',
orange: '#e6a23c', red: '#f56c6c', gray: '#909399', purple: '#9254de'
},
kpiList: [
{ label: '今日计划下发工单', value: 8, icon: '📋', color: 'orange' },
{ label: '齐套工单数量', value: 5, icon: '👍', color: 'green' },
{ label: '开工工单数量', value: 16, icon: '💎', color: 'blue' },
{ label: '计划生产电芯总数', value: '3,000', icon: '👥', color: 'purple' }
],
tableData: [
{ id: 1, section: '匀浆', plan: 747, ok: 1000, ng: 0, badRate: '0%', achieve: '133.8%', date: '2023-03-19' },
{ id: 2, section: '涂布', plan: 400, ok: 400, ng: 0, badRate: '0%', achieve: '100%', date: '2023-03-19' },
{ id: 3, section: '辊压', plan: 1000, ok: 998, ng: 2, badRate: '2%', achieve: '100%', date: '2023-03-19' },
{ id: 4, section: '分切', plan: 4000, ok: 3890, ng: 110, badRate: '3.25%', achieve: '100%', date: '2023-03-19' },
{ id: 5, section: '卷绕', plan: 2000, ok: 1988, ng: 12, badRate: '0.06%', achieve: '100%', date: '2023-03-19' },
{ id: 6, section: '注液', plan: 2000, ok: 2000, ng: 0, badRate: '0%', achieve: '100%', date: '2023-03-19' },
{ id: 7, section: '组装', plan: 2000, ok: 2000, ng: 0, badRate: '0%', achieve: '100%', date: '2023-03-19' }
],
downtimeLegend: [
{ name: '待机', value: 21, color: '#409eff' },
{ name: '维修', value: 4, color: '#67c23a' },
{ name: '点检', value: 24, color: '#e6a23c' },
{ name: '计划停机(保养)', value: 8, color: '#909399' },
{ name: '其他', value: 43, color: '#f56c6c' }
]
},
mounted () {
this.initLineChart();
this.initBarChart();
this.initTrendChart();
this.initDailyChart();
this.initGaugeChart();
this.initDowntimeChart();
window.addEventListener('resize', this.handleResize);
},
beforeDestroy () {
window.removeEventListener('resize', this.handleResize);
Object.values(this.charts).forEach(c => c && c.dispose());
},
methods: {
rateClass (rate, isAchieve) {
if (isAchieve) return 'rate-high';
const num = parseFloat(rate);
if (num === 0) return 'rate-normal';
return num >= 1 ? 'rate-low' : 'rate-normal';
},
handleResize () {
Object.values(this.charts).forEach(c => c && c.resize());
},
initLineChart () {
const chart = echarts.init(this.$refs.lineChart);
chart.setOption({
tooltip: {
trigger: 'axis',
backgroundColor: 'rgba(255,255,255,0.95)',
borderColor: '#ebeef5',
textStyle: { color: '#1f2d3d', fontSize: 12 },
formatter: (params) => {
let html = '<div style="font-weight:600;margin-bottom:4px;">' + params[0].axisValue + '</div>';
params.forEach(p => {
html += '<div style="display:flex;align-items:center;gap:6px;margin:2px 0;">' +
'<span style="width:8px;height:8px;border-radius:50%;background:' + p.color + ';"></span>' +
'<span>' + p.seriesName + ': ' + p.value.toLocaleString() + '</span></div>';
});
return html;
}
},
grid: { left: '3%', right: '4%', bottom: '3%', top: '12%', containLabel: true },
xAxis: {
type: 'category', boundaryGap: false,
data: ['03/14','03/15','03/16','03/17','03/18','03/19','03/20'],
axisLine: { lineStyle: { color: '#dcdfe6' } },
axisLabel: { color: '#606266' }
},
yAxis: {
type: 'value', min: 0, max: 3500, interval: 1000,
axisLine: { show: false },
splitLine: { lineStyle: { color: '#ebeef5' } },
axisLabel: { color: '#606266', formatter: v => v === 0 ? '0' : (v / 1000) + 'k' }
},
series: [
{
name: '计划下发量', type: 'line', smooth: true, symbol: 'circle', symbolSize: 8,
data: [1800, 2200, 2300, 2000, 2100, 2400, 3000],
itemStyle: { color: this.colors.blue }, lineStyle: { width: 3 },
areaStyle: {
color: new echarts.graphic.LinearGradient(0, 0, 0, 1, [
{ offset: 0, color: 'rgba(64,158,255,0.25)' },
{ offset: 1, color: 'rgba(64,158,255,0.02)' }
])
}
},
{
name: '实际生产量', type: 'line', smooth: true, symbol: 'circle', symbolSize: 8,
data: [1600, 1900, 1850, 1700, 1750, 2100, 2567],
itemStyle: { color: this.colors.cyan }, lineStyle: { width: 3 },
areaStyle: {
color: new echarts.graphic.LinearGradient(0, 0, 0, 1, [
{ offset: 0, color: 'rgba(92,219,211,0.25)' },
{ offset: 1, color: 'rgba(92,219,211,0.02)' }
])
}
}
]
});
this.charts.line = chart;
},
initBarChart () {
const chart = echarts.init(this.$refs.barChart);
const categories = ['成品电芯','分容后电芯','注液后电芯','组装后电芯','卷绕裸电芯','分条后正极片','分条后负极片','正极浆料','AT9浆料','负极浆料'];
chart.setOption({
tooltip: {
trigger: 'axis', axisPointer: { type: 'shadow' },
backgroundColor: 'rgba(255,255,255,0.95)',
borderColor: '#ebeef5', textStyle: { color: '#1f2d3d', fontSize: 12 }
},
legend: {
data: ['计划','实际'], top: 0, right: 0,
itemWidth: 12, itemHeight: 12, textStyle: { color: '#606266', fontSize: 12 }
},
grid: { left: '3%', right: '8%', bottom: '3%', top: '10%', containLabel: true },
xAxis: {
type: 'value',
axisLine: { lineStyle: { color: '#dcdfe6' } },
splitLine: { lineStyle: { color: '#ebeef5' } },
axisLabel: { color: '#606266', formatter: v => (v / 1000) + 'k' }
},
yAxis: {
type: 'category', data: categories,
axisLine: { lineStyle: { color: '#dcdfe6' } },
axisLabel: { color: '#606266', fontSize: 11 },
axisTick: { show: false }
},
series: [
{
name: '计划', type: 'bar', data: [1620,1000,1000,1000,1000,1170,1000,400,560,747],
barWidth: 10, itemStyle: { color: this.colors.blue, borderRadius: [0,5,5,0] },
label: { show: true, position: 'right', color: '#606266', fontSize: 10, formatter: '{c}' }
},
{
name: '实际', type: 'bar', data: [1116,870,620,760,560,1250,1320,400,280,1000],
barWidth: 10, itemStyle: { color: this.colors.green, borderRadius: [0,5,5,0] },
label: { show: true, position: 'right', color: '#606266', fontSize: 10, formatter: '{c}' }
}
]
});
this.charts.bar = chart;
},
initTrendChart () {
const chart = echarts.init(this.$refs.trendChart);
chart.setOption({
grid: { left: 0, right: 0, top: '10%', bottom: '5%' },
xAxis: { type: 'category', show: false, data: [1,2,3,4,5,6,7,8,9,10] },
yAxis: { type: 'value', show: false, min: 3000 },
series: [{
type: 'line', smooth: true, symbol: 'none',
data: [3200,3400,3600,3900,3700,4200,4500,4300,4800,5982],
lineStyle: { color: this.colors.blue, width: 3 },
areaStyle: {
color: new echarts.graphic.LinearGradient(0, 0, 0, 1, [
{ offset: 0, color: 'rgba(64,158,255,0.3)' },
{ offset: 1, color: 'rgba(64,158,255,0.02)' }
])
},
markPoint: {
data: [{ coord: [9, 5982], value: '3,421', itemStyle: { color: this.colors.blue } }],
symbolSize: 40, label: { color: '#fff', fontSize: 10 }
}
}]
});
this.charts.trend = chart;
},
initDailyChart () {
const chart = echarts.init(this.$refs.dailyChart);
chart.setOption({
grid: { left: '2%', right: '2%', top: '10%', bottom: '15%' },
xAxis: {
type: 'category', data: ['匀浆','涂布','辊压','卷绕','组装','注液','测试'],
axisLine: { show: false }, axisTick: { show: false },
axisLabel: { color: '#606266', fontSize: 10 }
},
yAxis: { type: 'value', show: false },
series: [{
type: 'bar', data: [82,95,88,92,85,78,65], barWidth: 14,
itemStyle: {
color: (p) => p.dataIndex % 2 === 0 ? this.colors.green : this.colors.blue,
borderRadius: [3,3,0,0]
}
}]
});
this.charts.daily = chart;
},
initGaugeChart () {
const chart = echarts.init(this.$refs.gaugeChart);
chart.setOption({
series: [{
type: 'gauge', startAngle: 90, endAngle: -270, radius: '90%',
pointer: { show: false },
progress: { show: true, overlap: false, roundCap: true, clip: false, itemStyle: { color: this.colors.blue } },
axisLine: { lineStyle: { width: 20, color: [[1, '#ebeef5']] } },
splitLine: { show: false }, axisTick: { show: false }, axisLabel: { show: false },
data: [{ value: 66, name: '结案及时率\n66%' }],
title: { offsetCenter: ['0%','0%'], fontSize: 14, color: '#1f2d3d', fontWeight: 600 },
detail: { show: false }
}]
});
this.charts.gauge = chart;
},
initDowntimeChart () {
const chart = echarts.init(this.$refs.downtimeChart);
chart.setOption({
tooltip: { trigger: 'item', formatter: '{b}: {d}%' },
series: [{
type: 'pie', radius: ['55%','75%'],
avoidLabelOverlap: false, label: { show: false }, labelLine: { show: false },
data: [
{ value: 21, name: '待机', itemStyle: { color: this.colors.blue } },
{ value: 4, name: '维修', itemStyle: { color: this.colors.green } },
{ value: 24, name: '点检', itemStyle: { color: this.colors.orange } },
{ value: 8, name: '计划停机(保养)', itemStyle: { color: this.colors.gray } },
{ value: 43, name: '其他', itemStyle: { color: this.colors.red } }
]
}]
});
this.charts.downtime = chart;
}
}
});
</script>
</body>
</html>3、总结
总的来说,用 WorkBuddy 把原型图转成能直接用的前端页面,体验还是相当顺手的。实际跑下来,上传一张设计稿,它就能把页面结构、样式甚至交互逻辑先搭出个雏形,你再针对性改几处就能交付,省掉从零手敲的大量重复劳动。
不止前端页面,写代码、日常办公、产品设计这些场景它也都能顶上:写脚本、理文档、画原型思路,基本都能落地。
对我这种既要写代码又要兼顾杂活的人,效率提升肉眼可见。工具终究是工具,把需求想清楚最关键。希望这次分享能给大家一点实际的帮助,也欢迎一起交流玩法!
原创声明:本文系作者授权腾讯云开发者社区发表,未经许可,不得转载。
如有侵权,请联系 cloudcommunity@tencent.com 删除。
目录
腾讯云开发者

Copyright © 2013 - 2026 Tencent Cloud. All Rights Reserved. 腾讯云 版权所有
深圳市腾讯计算机系统有限公司 ICP备案/许可证号:粤B2-20090059  粤公网安备44030502008569号
腾讯云计算(北京)有限责任公司 京ICP证150476号 | 京ICP备11018762号