
是否有办法在php中更改日期格式?
是否有办法在php中更改日期格式?
提问于 2020-09-16 15:40:06
我有一个图表,显示了
'm-d-Y H:i:s'sql表中的日期是这样的,但我需要它们在图表上显示为d-m-y。
我的模特:
class chartData extends Entity
{
    public static function findBy(
        \DateTime $StartDate,
        \DateTime $EndDate
    ): array
    {
        $params = [
            $StartDate->format('m-d-Y H:i:s'),
            $EndDate->format('m-d-Y H:i:s'),
        ];
        return self::hydrate(DB::select('EXEC Table @StartDate = ?, @EndDate = ?',
            $params
        ));
    }

}
我的控制器:
public function index (Request $request)
{
    if (!$request->input('StartDate') && !$request->input('EndDate')) {
        $StartTime = Carbon::now()->subDays(7);
        $EndTime = Carbon::now();
    } else {
        $StartTime = Carbon::parse($request->input('StartDate'));
        $EndTime = Carbon::parse($request->input('EndDate'));
    }


    $Activity = chartData::findBy(
        Carbon::parse($StartTime),
        Carbon::parse($EndTime)
    );
我不能简单地做一个->format(‘do’),因为我会被抛出错误。是否有人知道如何将此格式重新格式化,以便将日期显示为日/月/年?
更新:
考虑到建议,我已经更改了图表,以包括所建议的日期格式:
  var ctx = document.getElementById("Chart").getContext('2d');
 var recentActivityChart = new Chart(ctx, {
     type: 'bar',
     data: {
         labels: [],
         datasets: [{
             label: 'hours',
             data: [],
             barThickness: 12,
             fill: true,
             backgroundColor: "rgba(54, 162, 235, 1)",
             borderColor: "rgba(54, 162, 235, 1)",
             borderWidth: 1,
         }]
     },
     options: {
         animation: {
             duration: 1000,
             easing: "linear",
         },
         responsive: true,
         maintainAspectRatio: true,
         legend: {
             display: false,
             position: 'bottom',
             usePointStyle: true,
             labels: {
                 fontColor: "grey",
                 usePointStyle: true,
             },
         },
         scales: {
             yAxes: [{
                 gridLines: {
                     display: true,
                     borderDash: [8, 4],
                 },
                 scaleLabel: {
                     display: true,
                     labelString: 'hours',
                 },
                 ticks: {
                     beginAtZero: false,
                 }
             }],
             xAxes: [{
                 type: 'time',
                 time: {
                     parser: 'labels', // define date format that matches the php data
                     unit: 'day',
                     displayFormats: {
                         day: 'DD-MM-YYYY'
                     },
                     tooltipFormat: 'DD-MM-YYYY'
                 },
                 gridLines: {
                     scaleShowVerticalLines: false,
                     display: false,
                 },
                 ticks: {
                     beginAtZero: false,


                 }
             }]
         },
     }
 });
这是因为日期现在出现在dd-mm。然而,图表现在开始于1970年,而不是sql表中的数据实际开始的时候。
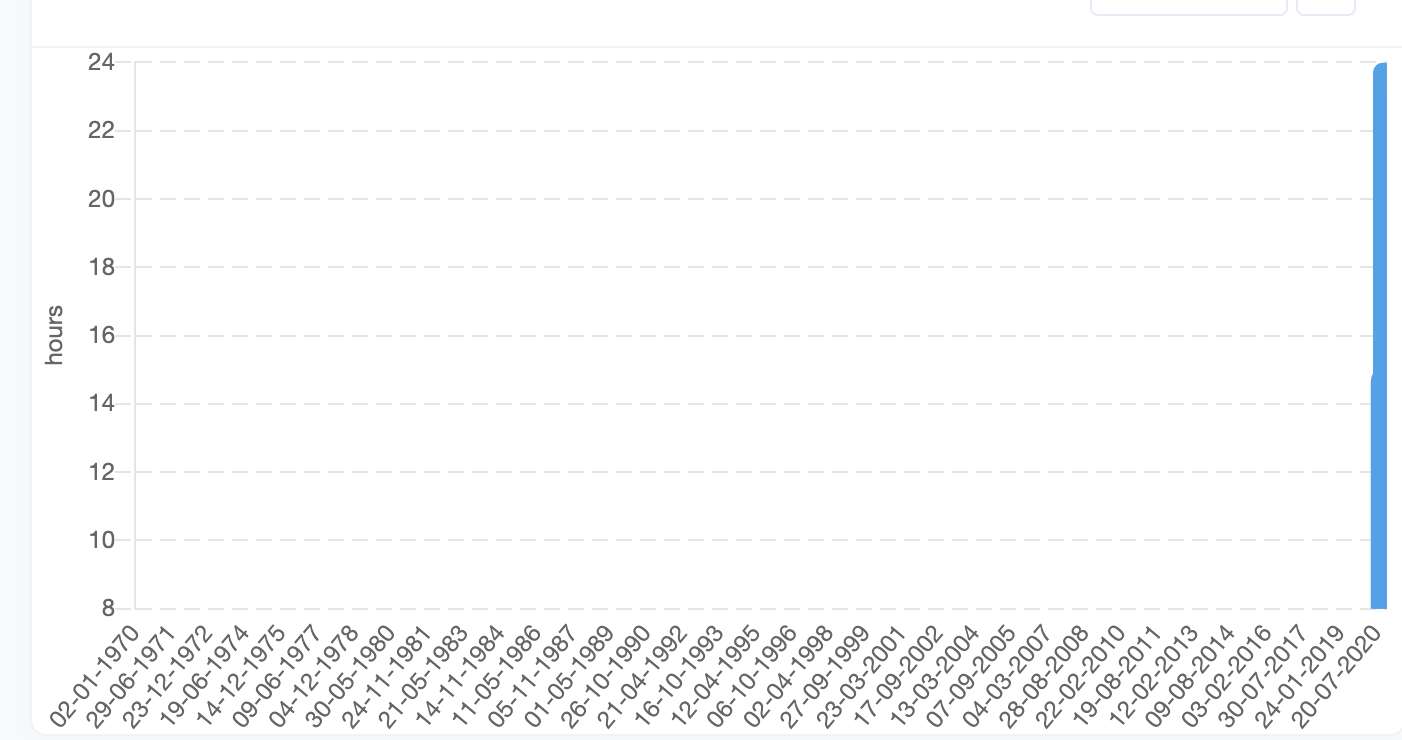
知道怎么解决这个问题吗?
回答 2
Stack Overflow用户
回答已采纳
发布于 2020-09-17 06:56:56
这个问题最好在前端处理,而不是在后端处理。
您应该将xAxis定义为时间笛卡尔轴,如下所示。
options: {
  ...
  scales: {
    xAxes: [{
      type: 'time',
      time: {
        parser: '', // define date format that matches the php data
        unit: 'day',
        displayFormats: {
          day: 'D-M-YYYY'
        },
        tooltipFormat: 'D-M-YYYY'
      }
      ...
    }]
  }
  ...
}请参阅Moment.js以了解可用于time.parser、time.displayFormats和time.tooltipFormat的格式字符串。
注意,Chart.js内部使用Moment.js作为时间轴的功能。因此,您应该使用捆绑版本 of Chart.js,它在单个文件中包含Moment.js。
Stack Overflow用户
发布于 2020-09-17 09:26:06
更新:我已设法使它正确显示!这是更新后的图表:我不需要解析器,它理解时不需要传递什么。
  var ctx = document.getElementById("recentChart").getContext('2d');
 var recentChart = new Chart(ctx, {
     type: 'bar',
     data: {
         labels: [],
         datasets: [{
             label: 'hours',
             data: [],
             barThickness: 12,
             fill: true,
             backgroundColor: "rgba(54, 162, 235, 1)",
             borderColor: "rgba(54, 162, 235, 1)",
             borderWidth: 1,
         }]
     },
     options: {
         animation: {
             duration: 1000,
             easing: "linear",
         },
         responsive: true,
         maintainAspectRatio: true,
         legend: {
             display: false,
             position: 'bottom',
             usePointStyle: true,
             labels: {
                 fontColor: "grey",
                 usePointStyle: true,
             },
         },
         scales: {
             yAxes: [{
                 gridLines: {
                     display: true,
                     borderDash: [8, 4],
                 },
                 scaleLabel: {
                     display: true,
                     labelString: 'hours',
                 },
                 ticks: {
                     beginAtZero: false,
                 }
             }],
             xAxes: [{
                 type: 'time',
                 time: {
                     unit: 'day',
                     displayFormats: {
                                 day: 'DD-MM-YYYY'
                             },
                 },
                 gridLines: {
                     scaleShowVerticalLines: false,
                     display: false,
                 },
                 ticks: {
                     beginAtZero: true,

                 }
             }]
         },
     }
 });
日期现在显示正确,而不是从1970年开始。
页面原文内容由Stack Overflow提供。腾讯云小微IT领域专用引擎提供翻译支持
原文链接:
https://stackoverflow.com/questions/63923531
复制相关文章
相似问题
腾讯云开发者
