Before using Performance Insight, R&D teams often faced the issue of scattered R&D data, leading to incomplete or inaccurate data affecting R&D investment decisions. Additionally, there was a lack of talent within the team with data analysis skills, resulting in an awareness of metrics but no way to start.
Performance Insight can help R&D teams improve business processes and increase production efficiency. It provides Template View, Template Chart, Chart Data Drill-down features, which help R&D teams identify business bottlenecks and find inefficient segments; gain insights into business processes and resource usage, avoid resource waste and unreasonable allocation; track Key Business Indicators to timely identify problems and opportunities and make corresponding adjustments and optimizations.
What are the scenarios for Performance Insight?
Performance Insight has the following scenarios:
R&D Process Review Scenario: View project progress at any time.
Post-project Review Scenario: Summary and review after the project lifecycle ends.
Team Performance Goal Setting Scenario: Scientifically set team performance goal reports before the project begins, so that subsequent work indicators have reference and guidance.
Digital Operation Analysis Scenario: Performance Insight can be widely used for work analysis, project review, and other work scenarios requiring statistical analysis.
What is the difference between a View and a Chart?
A View is like a dashboard that displays multiple charts in a concentrated manner.
A Chart is an individual statistical window used to display data within a specific statistical project.
What should I do if I cannot see Performance Insight on the homepage?
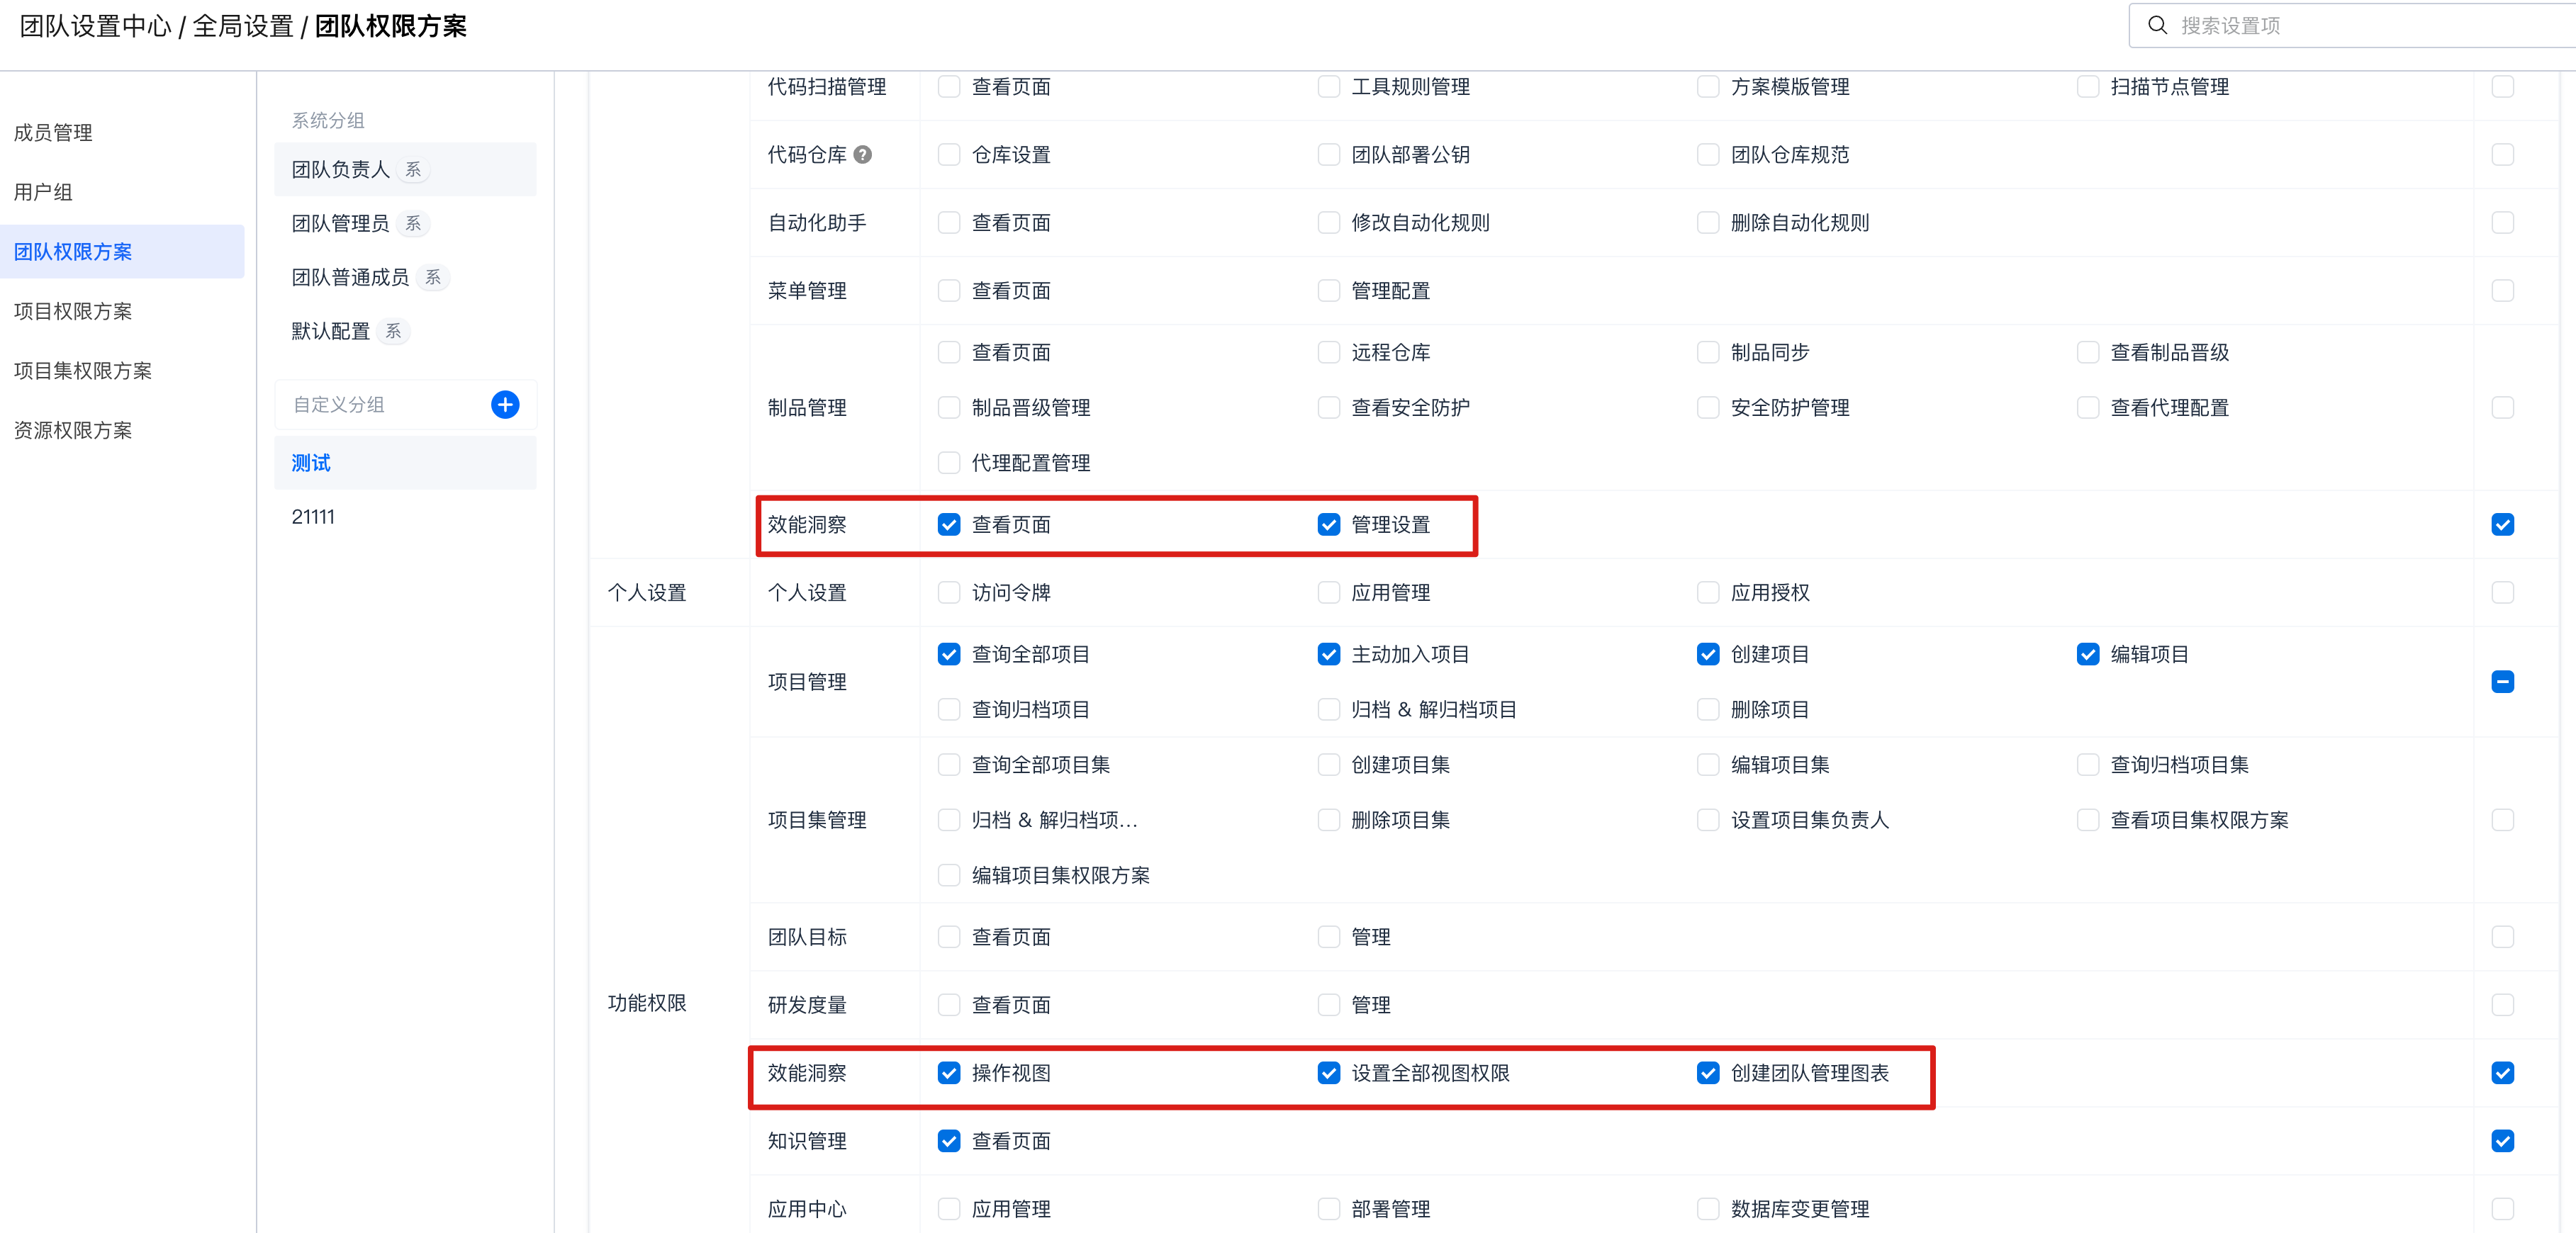
This may be because the current team members do not have access privileges for Performance Insight. Please contact the Team Administrator and refer to the Permission Configuration documentation to add team members to the user group with "View Page" privileges for Performance Insight.
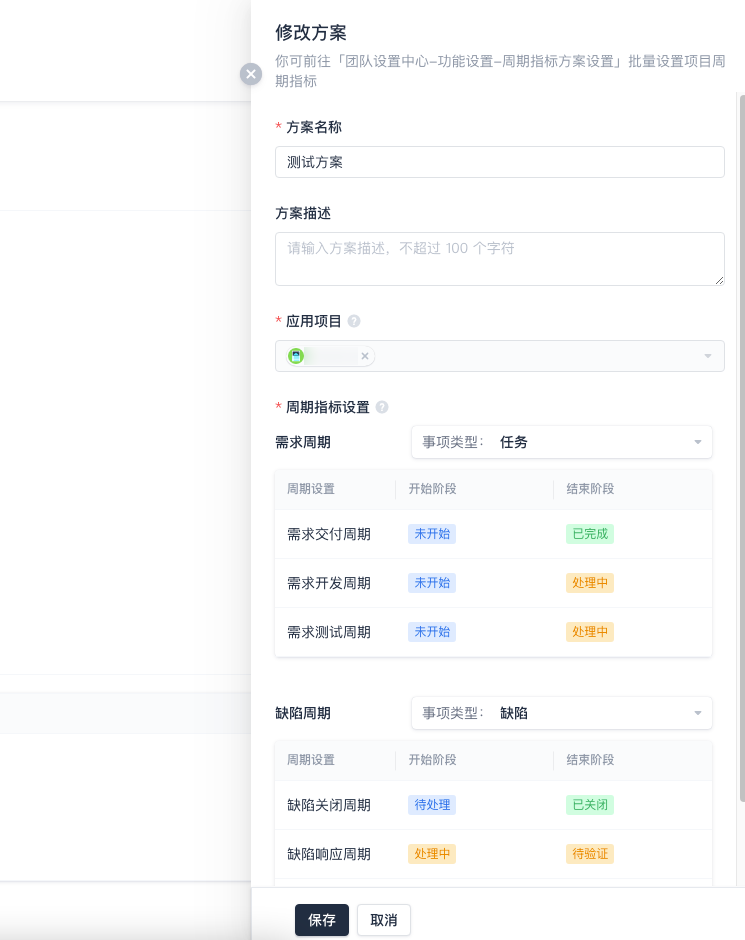
How to add a Cycle Indicator Scheme?
Only the following six types of charts support adding indicator schemes:
In the top right corner of the View Template page, click Add. After adding a chart, use one of the above chart types, select the project scope, and then click View Scheme.
You can use it after specifying the scheme's statistical scope and configuring the parameters.