集群级分布式限流
适用于 Pulsar 专业集群。Pulsar 生产者和消费者以极高的速度生产/消费大量消息,从而消耗服务端资源,造成 CPU、内存、网络磁盘 IO 等饱和。因此 Pulsar 设计限流方案,按照实例规格设置不同的限流阈值,对集群进行自我保护,避免因为资源消耗过高影响集群质量,造成全局稳定性风险。
限流机制说明
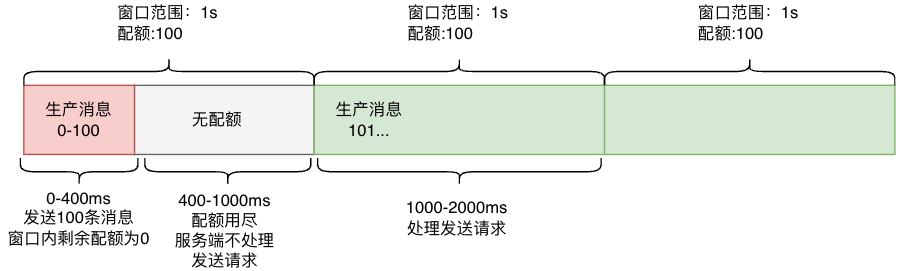
Pulsar 生产限流机制是采用延迟回包的方式。限流的统计窗口是 1s。
以生产 TPS 限流为例,举例如下:
假设生产TPS设置为 100,当用户在 1s 中的前 400ms 发送了 100 个消息,那么第 101 个消息发送的请求会需要等待 600ms 后才能被处理。
从生产者的角度看,当出现生产限流的时候,发送消息的耗时会增加甚至出现发送超时的情况。
从消费者的角度看,当发生消费限流的时候,消息从生产到消费的整体链路时延会增加,可能出现消息堆积的情况。
限流原理描述
生产端:
限流的统计窗口为 1s,当统计窗口内的配额被用尽,服务端会将生产者的 channel 全部关闭,停止接受消息发送请求,直到下一个时间窗口,重新打开生产者的 channel,处理消息发送请求。
消费端:
限流的统计窗口为 1s,当统计窗口内的配额被用尽,服务端会停止推送消息到消费者,直到下一个时间窗口。
注意:
怎么理解生产端限流后关闭 channel?
当生产出现限流后,服务端会将生产者对应的 tcp 连接通道关闭,关闭后服务端就不再接受对应 tcp 连接的请求,直到 tcp 连接通道被再次打开。
Pulsar 分布式限流的实践教程
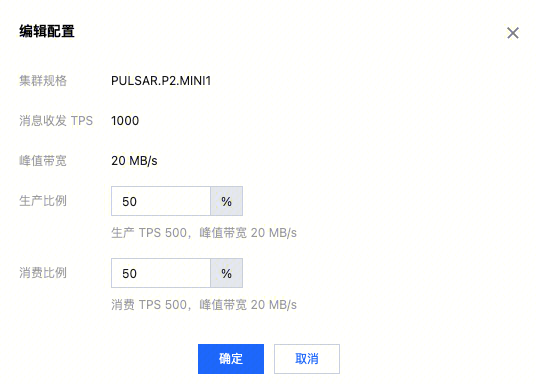
1. 建议用户按照业务实际的峰值生产/消费量进行选购集群规格,根据生产消费的扇出比例,设置限流的生产/消费分配比例。建议正式上线前做好压测,提前评估集群容量是否满足。
2. 如果是非延迟消息,不要设置延迟消息字段。因为一旦发送端设置了延迟消息字段,无论设置的延迟时间是多久,服务端都会按照延迟消息统计速率。一种典型的情况:以 Java 为例(GO 等其他 SDK 也类似),只要在发送消息的时候,设置了
deliverAfter或者deliverAt,就会认为是延迟消息,即使里面的值为 0 或者小于当前时间。3. 配置集群的生产/消费的速率和带宽的告警,当集群的生产/消费的速率和带宽超过设置规格的 80%,建议及时升配专业版实例规格,避免限流带来的耗时增加的风险。
4. 配置生产/消费的限流次数的告警,当出现限流的时候,表示在秒级的窗口内存在生产/消费超限的情况。建议及时升配专业版实例的规格,避免限流带来耗时增加的风险。
常见现象说明
问题1:为什么生产/消费低于规格时会触发限流?
如上面限流原理所述,限流是以 秒(s) 为单位的,控制台监控平台数据是按分钟(min)维度采集上报。监控平台上的生产/消费的统计值的计算公式是 [1min内消息量/60]。当客户端生产消费的量在 1min 内分布不均衡的时候,可能集中在 1min 内的 1 秒或者几秒的时间窗口内生产/消费量很高,超过限流窗口中的配额,其他时间远低于限流窗口配额,这种情况下,监控到的生产/消费低于实例规格,但是触发了限流。
问题2:为什么生产/消费峰值会高于实例规格?
情况1:Pulsar 是分布式系统,一个 Pulsar 节点由多个 broker 节点组成,同一个时间点(一个限流窗口内),限流是由各个节点进行的,每个节点的限流阈值是当前集群剩余阈值。例如集群限流阈值 1000,broker 节点数量为5,当实际使用量为 750 的时候(假设此时每个节点的使用量均匀,都是 150),每个节点此时的限流阈值是 400(150 + 1000-750)。此时,实际上瞬时能达到的流量可能到 2000(400*5),这样,一个限流窗口内可能出现超过规格的情况。
情况2:如上面限流原理所述,当出现限流后,会将写的通道关闭,但是当前的请求(即使已经超过了限流阈值)还是会继续处理,所以,当并发请求较高的情况下,可能出现一个统计窗口内超过限流阈值的情况。
问题3:如何判断 Pulsar 是否发生限流?
在 Pulsar 专业版控制台的集群监控页面查看集群监控信息,当限流次数大于0,证明发生过限流。
主题分区限流
适用于所有类型的 Pulsar 集群。
限流原理说明
生产端
服务端限流逻辑描述:生产端限流是非精确的,依赖内部的定时任务(默认 50ms 执行一轮)检查每个分区在 1s 的窗口内,生产的量是否超过配额。
服务端限流后的行为:生产端采用的是软限流方式,当出现限流后,关闭主题对应生产者的读 channel,不再处理生产请求。至多等待 1s 后恢复生产者的读channel,可以继续处理发送消息的请求,直到再次出现限流。
发生限流后客户端的表现:当出现限流后,发送耗时会增加,可能出现发送超时的情况。
消费端
服务端限流逻辑描述:消费端限流是非精确的,统计 1s 的时间窗口内,消费的 TPS 和带宽是否超过配额。
服务端限流后的行为:服务端 1s 内停止推送消息到消费者。
发生限流后客户端的表现:当出现限流后,消息从生产端到消费端的整体时延会增加,可能出现消息堆积的情况。
Pulsar 主题分区限流的实践教程
1. 单主题分区有生产 / 消费的tps和带宽限制,如果主题的 TPS / 带宽并发比较大,需要适当扩容分区。
2. 配置主题的生产 / 消费的速率和流量已使用配额百分百的告警,当超过 80%,建议扩容分区数量,避免触发单主题分区限流。
常见现象说明
问题1:为什么分区的生产/消费流量可以超过限流阈值?
如上面限流原理所述,主题分区的限流采用的是非精确软限制的限流算法,结合生产端和消费端的限流逻辑,生产和消费都可能出现流量超过限流阈值的情况。


