The content of this page has been automatically translated by AI. If you encounter any problems while reading, you can view the corresponding content in Chinese.
Leverage the operational analysis feature to perform statistical analysis on the activation, active, and online device data of all products within the project; and to perform statistical analysis on the geographical distribution of active and activated devices of the product.
Prerequisites
There are activated devices, online devices, and devices connected to the platform.
Device Overview
Device overview allows you to view related data of all products or view the activation, online, and active data of a specific product through filtering, as well as information on daily activated devices, daily active devices, and online device data.
Operation Steps
1. Log in to the IoT Explorer console, select "China" as the region, click on a project to enter the project details page, click Operational Analysis, and click Device Overview to enter the device overview interface.
2. Select the product you want to view. The page will display the total number of activated devices, number of online devices, number of activations yesterday, number of active sessions yesterday, number of activations in the last 7 days, number of active sessions in the last 7 days, number of activations in the previous 7 days, and number of active sessions in the previous 7 days.
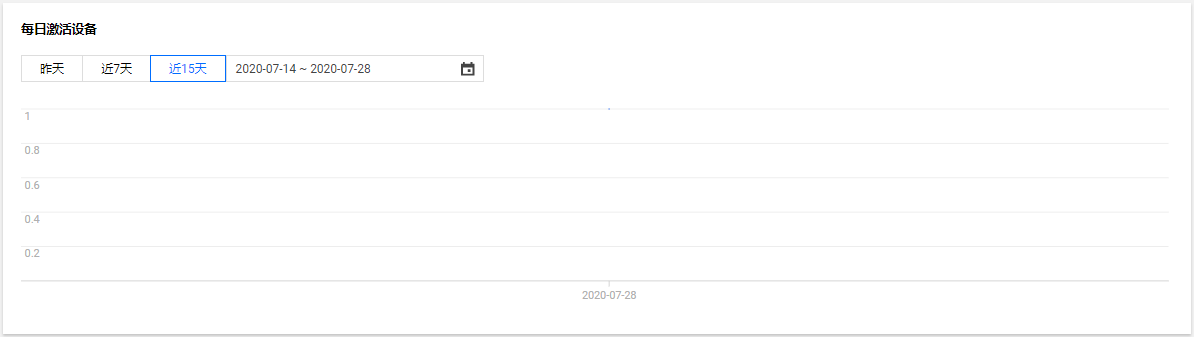
3. Select the time period for which you want to view activated devices. The system will show the daily activated device count of the product in the specified filtering time in the form of a chart.
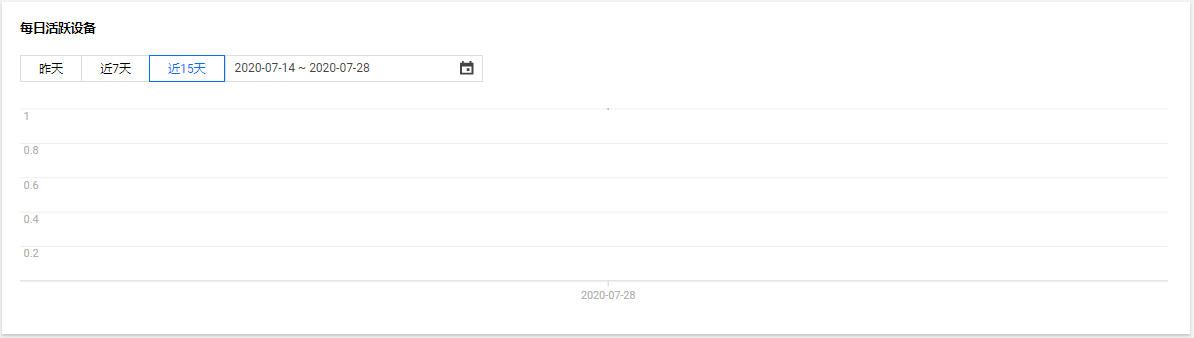
4. Select the time period for which you want to view the number of active devices (the device must be connected to Tencent Cloud IoT Platform). The system will show the daily number of active devices of the product in the selected time period in the form of a chart.
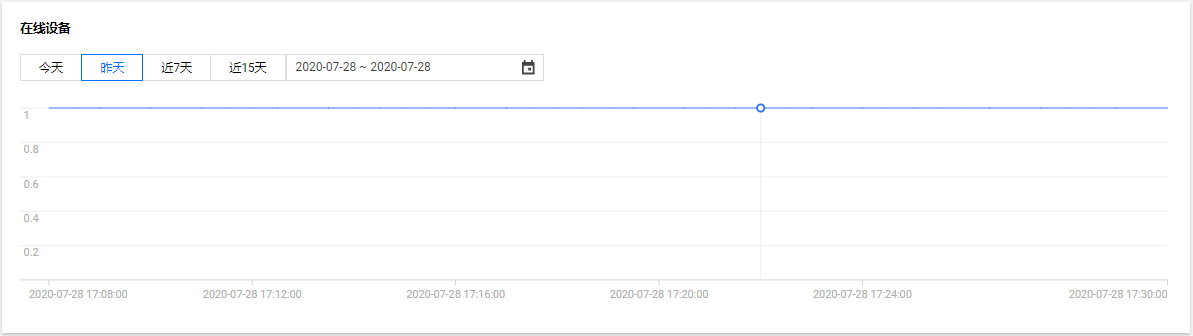
5. Select the time period for which you want to view online devices. The system will show the daily number of online devices of the product in the selected filtering time period in the form of a chart.
Device Distribution
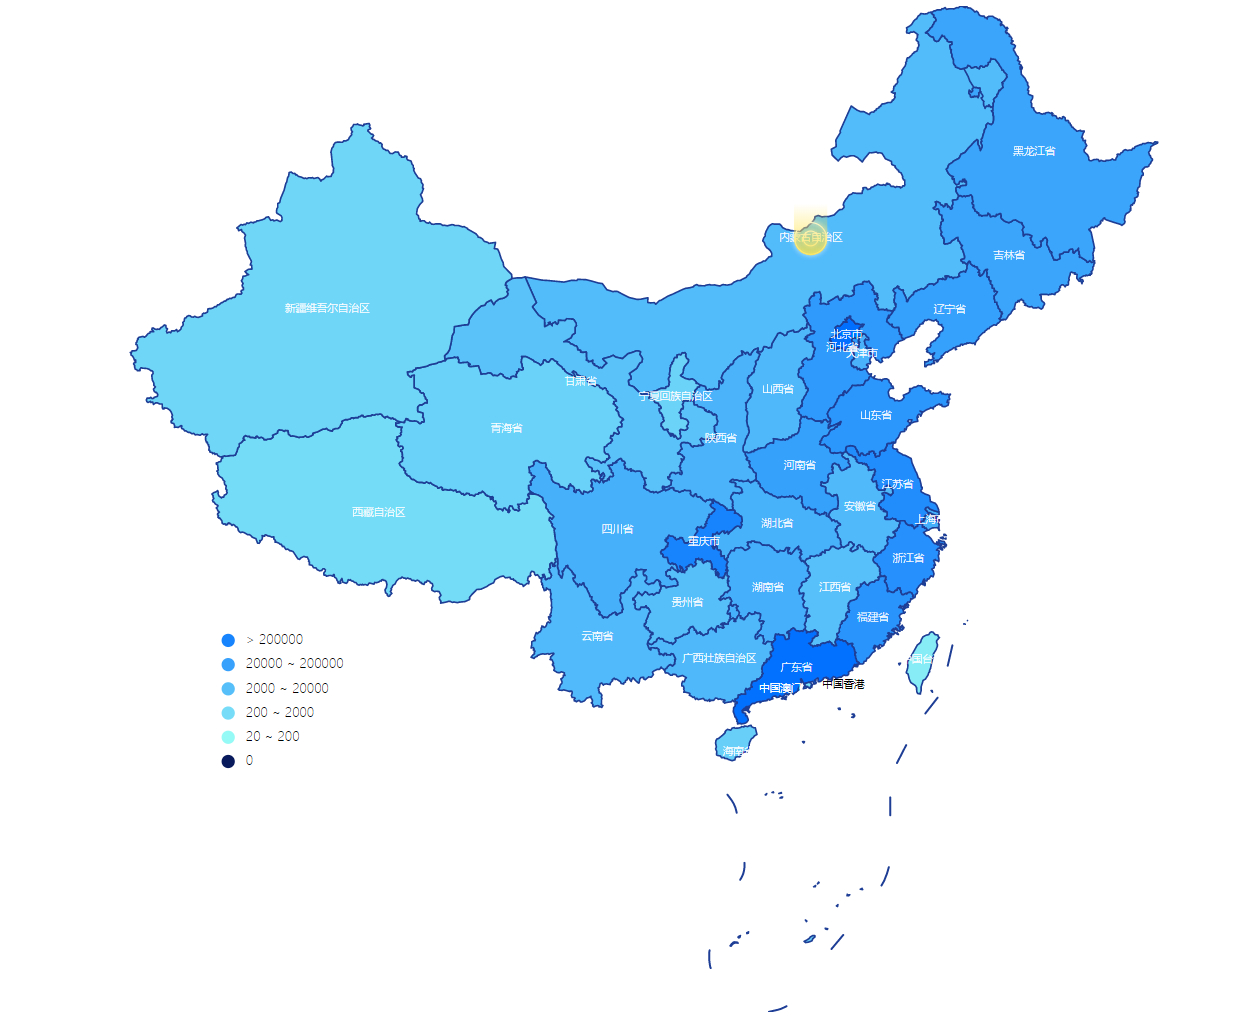
Device distribution allows you to view all products, or filter a specific product to view the number of active and activated devices in different regions within a set time. The system provides two display methods: map and table.
Operation Steps
1. Log in to the IoT Explorer console, select "China" as the region, click on a project to enter the project details page, click Operational Analysis, and click Device Distribution to enter the device distribution interface.
2. Select the product, time period, and device type to view.
3. The system will display the number of devices distributed in different regions on the map according to the product, time period, device type and other information selected by the user, and intuitively show the user the number of devices distributed in each region.
4. The system provides a table display method. Users can view detailed information such as the detailed quantity and proportion of each province and city through the table.