为方便用户查看和掌握实例的运行信息,云数据库 MySQL 提供了丰富的性能监控项与便捷的监控功能(自定义视图、时间对比、合并监控项等)。用户可登录 云数据库 MySQL 控制台,进入实例管理页的实例监控查看。
说明:
您可以通过腾讯云可观测平台 API 中的 拉取指标监控数据、云数据库 MySQL 监控指标 来获取实例的监控指标。
您也可以为监控指标 创建 Dashboard,动态分析指标监控数据。
单个实例的表数量超过30万后,可能会影响数据库监控,请合理规范表的数量,控制单个实例表数量不超过30万。
支持监控的实例类型
云数据库 MySQL 支持主实例(包括读写节点)、只读实例(包括只读节点与只读分析引擎)、灾备实例,以及数据库代理节点的监控,并为每个实例提供独立的监控视图供查询。
监控分类
云数据库 MySQL 包括资源监控、引擎监控(普通)、引擎监控(扩展)、部署监控4种监控类型,通过查看不同监控类型的指标,可快速、准确地了解实例性能及运行状况。
说明:
云数据库 MySQL 单节点云盘版实例支持的监控类型包括资源监控和引擎监控(普通),暂不支持引擎监控(扩展)和部署监控。
资源监控:提供 CPU、内存、磁盘及网络相关的监控数据。
引擎监控(普通):提供连接数、锁信息、热点表、慢查询等相关的监控数据,方便您诊断故障及性能优化。
引擎监控(扩展):提供更为丰富引擎相关的监控指标,协助您最大限度发现数据库存在或潜在的健康问题。
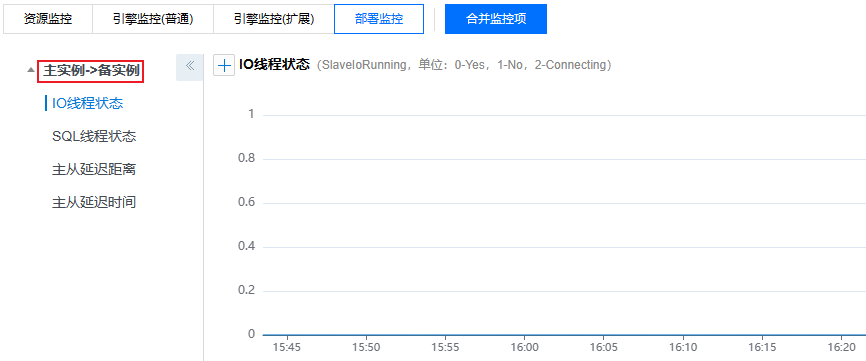
部署监控:提供主从延迟相关的监控指标。部署监控分为主机和备机:
若实例为主实例,则实例部署监控的对象是主实例与其隐藏备机之间的链路,部署监控展示为隐藏备机的 IO、SQL 线程状态,主从延迟距离和主从延迟时间指的是主实例与其隐藏备机之间。
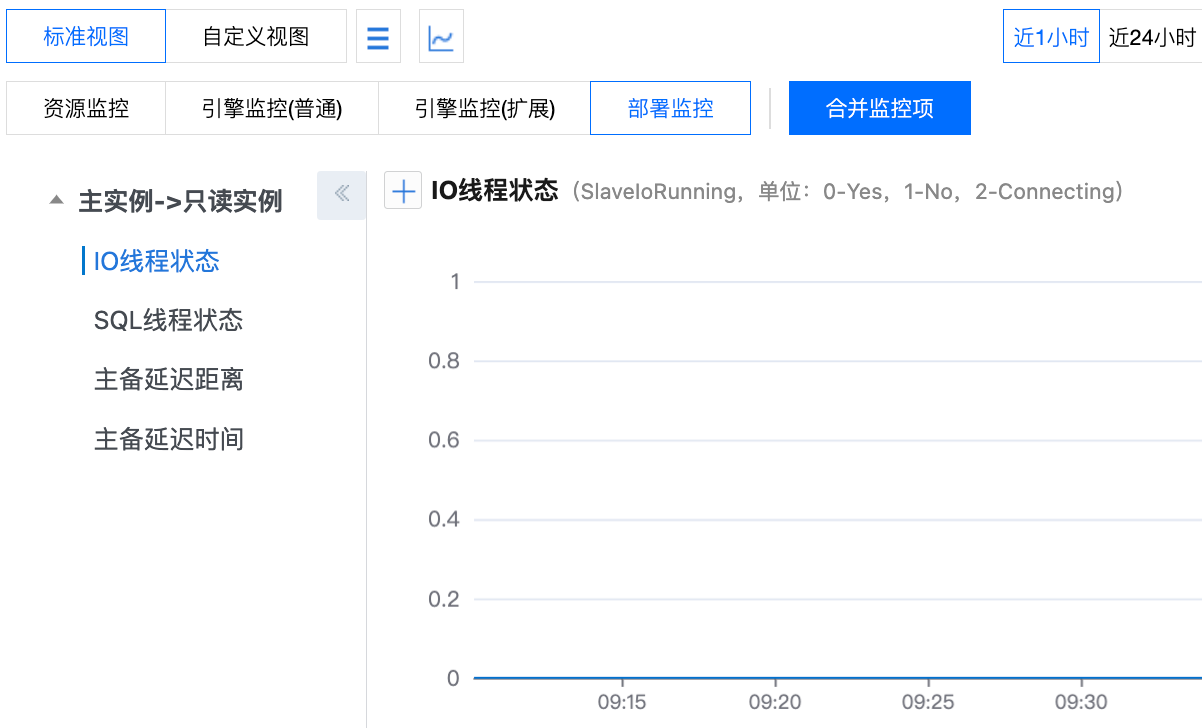
若实例为只读实例,则实例部署监控的对象是主实例与只读实例之间的链路,部署监控展示为只读实例的 IO、SQL 线程状态,主从延迟距离和主从延迟时间指的是只读实例与主实例之间。
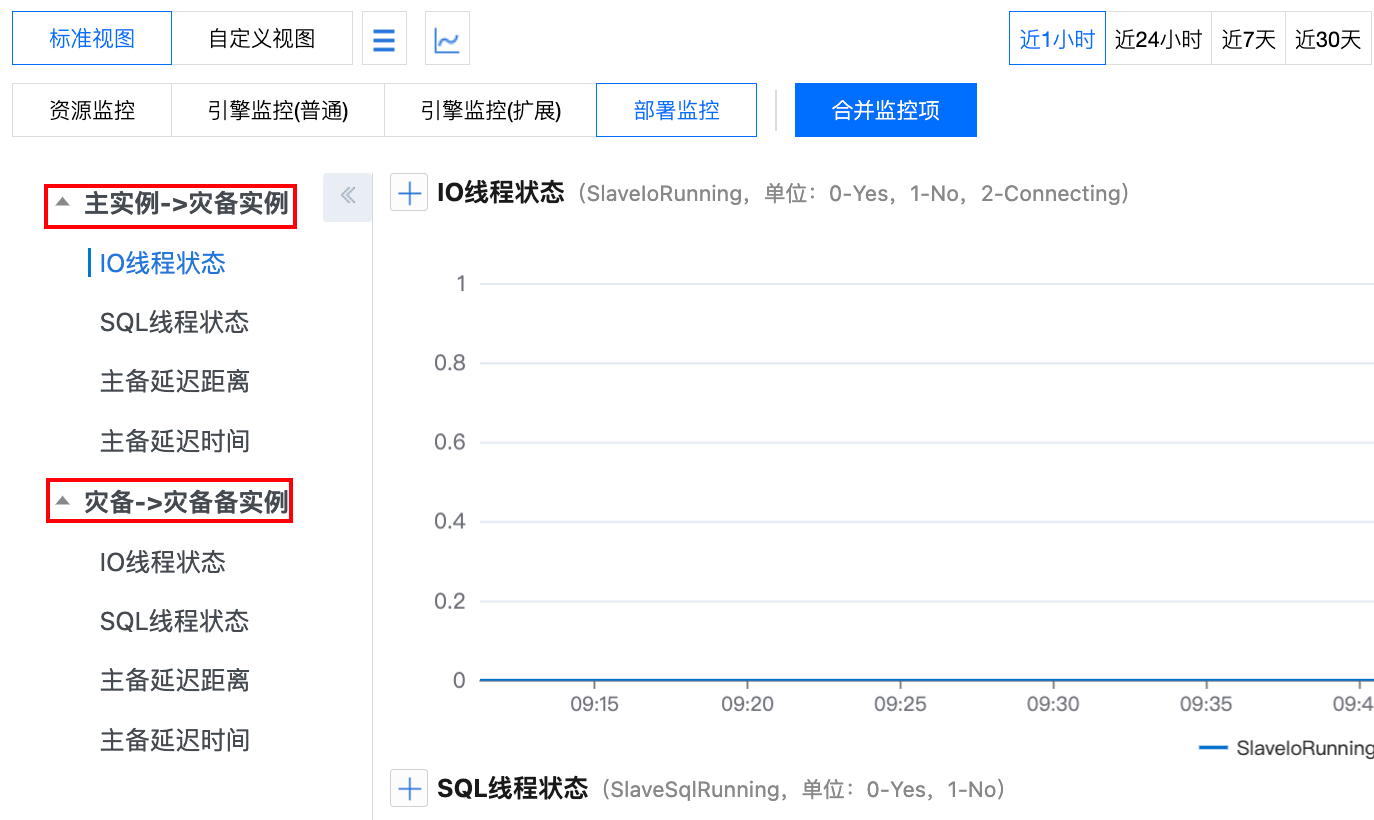
若实例为灾备实例:
灾备实例部署监控的对象是灾备实例与主实例之间的链路,部署监控展示为灾备实例的 IO、SQL 线程状态,主从延迟距离和主从延迟时间指的是灾备实例与主实例之间。
灾备实例部署监控的对象是灾备实例与其隐藏备机之间的链路,部署监控展示为其隐藏备机的 IO、SQL 线程状态,主从延迟距离和主从延迟时间指的是灾备实例与其隐藏备机之间。
监控粒度
自2018年08月11日起,云数据库 MySQL 监控粒度实行自适应策略,暂不支持监控粒度的自定义选择。监控粒度自适应策略如下:
时间跨度 | 监控粒度 | 自适应说明 | 保留时长 |
(0h, 4h] | 5s | 时间跨度在4小时内,监控粒度为5秒 | 1天 |
(4h, 2d] | 1min | 时间跨度超过4小时,但在2天内,监控粒度调整为1分钟 | 15天 |
(2d, 10d] | 5min | 时间跨度超过2天,但在10天内,监控粒度调整为5分钟 | 31天 |
(10d, 30d] | 1h | 时间跨度超过10天,但在30天内,监控粒度调整为1小时 | 62天 |
(30d,180d] | 1天 | 时间跨度超过30天,但在180天内,监控粒度调整为1天 | 180天 |
说明:
目前云数据库 MySQL 最长支持查看180天内的监控数据。
监控指标
腾讯云可观测平台从实例维度为云数据库 MySQL 实例提供丰富的监控指标,具体请参见下表。
除了通过监控指标来掌握实例的运行状况,云数据库 MySQL 也支持监控事件和事件告警,通过设置事件规则、事件目标及推送用户,当检测到异常事件,事件告警将通过多种可选的方式向用户发送告警通知,帮助用户更全面地掌控实例的运行信息。
详细了解事件告警,请参见 事件总线。
详细了解支持的监控事件,请参见 云数据库 MySQL 事件列表。
只读分析引擎的监控指标,请参见 监控告警。
说明:
通过 API 调用获取监控数据时,调用参数项使用的监控指标名称请以下表中的“可调用指标名称”列为准。
监控指标名称 | 可调用指标名称 | 单位 | 指标说明 |
CPU 利用率 | CpuUseRate | % | 允许闲时超用,CPU 利用率可能大于100%。 |
内存利用率 | MemoryUseRate | % | 允许闲时超用,内存利用率可能大于100%。 |
内存占用 | MemoryUse | MB | 允许闲时超用,实际内存占用可能大于购买规格。 |
磁盘利用率 | VolumeRate | % | 未加入白名单:磁盘利用率 = 数据使用空间 / 实例购买空间。 添加白名单:磁盘利用率 =(数据使用空间 + 日志使用空间)/ 实例购买空间。 说明: |
数据文件使用空间 | RealCapacity | MB | 数据文件的大小。 |
磁盘占用空间 | Capacity | MB | 数据文件、日志文件和临时文件的大小。 |
IOPS | Iops | 次/秒 | 每秒的输入输出量。 |
IOPS 利用率 | IopsUseRate | % | IOPS 利用率。 |
内网出流量 | BytesSent | Byte/秒 | 每秒发送的字节数。 |
内网入流量 | BytesReceived | Byte/秒 | 每秒接收的字节数。 |
每秒执行操作数 | Qps | 次/秒 | 数据库每秒执行的 SQL 数(含 insert、select、update、delete、replace),QPS 指标主要体现云数据库实例的实际处理能力。 |
每秒执行事务数 | Tps | 次/秒 | 数据库每秒传输的事务处理个数。 |
连接数利用率 | ConnectionUseRate | % | 当前打开连接数/最大连接数。 |
最大连接数 | MaxConnections | 个 | 最大连接数。 |
当前打开连接数 | ThreadsConnected | 个 | 当前打开的连接的数量。 |
慢查询数 | SlowQueries | 次 | 查询时间超过 long_query_time 秒的查询个数。 |
全表扫描数 | SelectScan | 次/秒 | 执行全表搜索查询的数量。 |
查询数 | SelectCount | 次/秒 | 每秒查询数。 |
更新数 | ComUpdate | 次/秒 | 每秒更新数。 |
删除数 | ComDelete | 次/秒 | 每秒删除数。 |
插入数 | ComInsert | 次/秒 | 每秒插入数。 |
覆盖数 | ComReplace | 次/秒 | 每秒覆盖数。 |
总请求数 | Queries | 次/秒 | 所有执行的 SQL 语句,包括 set,show 等。 |
查询使用率 | QueryRate | % | 每秒执行操作数 QPS/推荐每秒操作数。 |
临时表数量 | CreatedTmpTables | 个/秒 | 内存临时表数量。 |
等待表锁次数 | TableLocksWaited | 次/秒 | 需要等待的表锁数。 |
缓存命中率 | InnodbCacheHitRate | % | InnoDB 缓存命中率。 |
缓存使用率 | InnodbCacheUseRate | % | InnoDB 缓存使用率。 |
读磁盘数量 | InnodbOsFileReads | 次/秒 | InnoDB 读磁盘数量。 |
写磁盘数量 | InnodbOsFileWrites | 次/秒 | InnoDB 写磁盘数量。 |
fsync 数量 | InnodbOsFsyncs | 次/秒 | InnodbFsync 数量。 |
当前 InnoDB 打开表的数量 | InnodbNumOpenFiles | 个 | 当前 InnoDB 打开表的数量。 |
缓存命中率 | KeyCacheHitRate | % | MyISAM 缓存命中率。 |
缓存使用率 | KeyCacheUseRate | % | MyISAM 缓存使用率。 |
提交数 | ComCommit | 次/秒 | 每秒提交次数。 |
回滚数 | ComRollback | 次/秒 | 每秒回滚次数。 |
已创建的线程数 | ThreadsCreated | 次/秒 | 已创建的线程数。 |
运行的线程数 | ThreadsRunning | 个 | 运行的线程数。 |
磁盘临时表数量 | CreatedTmpDiskTables | 次/秒 | 磁盘临时表数量。 |
临时文件数量 | CreatedTmpFiles | 次/秒 | 临时文件数量。 |
读下一行请求数 | HandlerReadRndNext | 次/秒 | 读下一行请求数。 |
内部回滚数 | HandlerRollback | 次/秒 | 每秒事务被回滚的次数。 |
内部提交数 | HandlerCommit | 次/秒 | 内部提交数。 |
InnoDB 空页数 | InnodbBufferPoolPagesFree | 个 | InnoDB 空页数。 |
InnoDB 总页数 | InnodbBufferPoolPagesTotal | 个 | InnoDB 总页数。 |
InnoDB 逻辑读 | InnodbBufferPoolReadRequests | 次/秒 | InnoDB 缓冲池预读页次数。 |
InnoDB 物理读 | InnodbBufferPoolReads | 次/秒 | InnoDB 磁盘读页次数。 |
InnoDB 读取量 | InnodbDataRead | Byte/秒 | InnoDB 读取量。 |
InnoDB 总读取量 | InnodbDataReads | 次/秒 | InnoDB 总读取量。 |
InnoDB 总写入量 | InnodbDataWrites | 次/秒 | InnoDB 总写入量。 |
InnoDB 写入量 | InnodbDataWritten | Byte/秒 | InnoDB 引擎每秒已经完成写数据的字节数。 |
InnoDB 行删除量 | InnodbRowsDeleted | 次/秒 | InnoDB 引擎每秒删除的行数。 |
InnoDB 行插入量 | InnodbRowsInserted | 次/秒 | InnoDB 引擎每秒插入的行数。 |
InnoDB 行更新量 | InnodbRowsUpdated | 次/秒 | InnoDB 引擎每秒更新的行数。 |
InnoDB 行读取量 | InnodbRowsRead | 次/秒 | InnoDB 引擎每秒读取的行数。 |
InnoDB 平均获取行锁时间 | InnodbRowLockTimeAvg | 毫秒 | InnoDB 引擎行锁定的平均时长。 |
InnoDB 等待行锁次数 | InnodbRowLockWaits | 次/秒 | InnoDB 引擎每秒等待行锁定的次数。 |
键缓存内未使用的块数量 | KeyBlocksUnused | 个 | MyISAM 引擎未使用键缓存块的个数。 |
键缓存内使用的块数量 | KeyBlocksUsed | 个 | MyISAM 引擎已使用键缓存块的个数。 |
键缓存读取数据块次数 | KeyReadRequests | 次/秒 | MyISAM 引擎每秒读取键缓存块的次数。 |
硬盘读取数据块次数 | KeyReads | 次/秒 | MyISAM 引擎每秒读取硬盘数据块的次数。 |
数据块写入键缓冲次数 | KeyWriteRequests | 次/秒 | MyISAM 引擎每秒写键缓存块的次数。 |
数据块写入磁盘次数 | KeyWrites | 次/秒 | MyISAM 引擎每秒写硬盘数据块的次数。 |
已经打开的表数 | OpenedTables | 个 | 实例维度已经打开的表数。 |
立即释放的表锁数 | TableLocksImmediate | 次/秒 | 立即释放的表锁数。 |
打开文件总数 | OpenFiles | 个 | 打开文件总数。 |
日志使用量 | LogCapacity | MB | 日志使用空间。 |
IO 线程状态 | SlaveIoRunning | 状态值: 0 - Yes 1 - No 2 - Connecting | 主实例 IO 线程状态。 说明: 状态值中,0表示“运行”,1表示“断开”,2表示“建联中”。 |
SQL 线程状态 | SlaveSqlRunning | 状态值: 0 - Yes 1 - No | 主实例 SQL 线程状态。 说明: 状态值中,0表示“运行”,1表示“断开”。 |
主备延迟距离 | MasterSlaveSyncDistance | MB | 主备不同步的距离。 |
主备延迟时间 | SecondsBehindMaster | 秒 | 主备差距时间。 |
热点问题
如何配置主从延迟监控?
配置主从延迟监控分为以下两种场景,您可根据实际场景对应操作。
场景一:为主实例配置主从延迟监控
1. 登录 腾讯云可观测平台控制台,在左侧导航选择告警管理,然后选择告警配置 > 新建策略。
2. 在告警策略页,策略类型项选择:云数据库 > MySQL > 备机监控。
说明:
为主实例配置主从延迟监控,策略类型要选择备机监控,监控的是备机到主机的延迟信息。
3. 在配置告警规则下完成对监控项“主从延迟距离”和“主从延迟时间”的触发条件设置,然后根据您的需要完成其他配置项的设置,单击完成。
4. 设置完成后,当“主从延迟距离”和“主从延迟时间”监控项满足触发条件时即可触发告警。
场景二:为 RO 和灾备实例配置主从延迟监控
1. 登录 腾讯云可观测平台控制台,在左侧导航选择告警管理,然后选择告警配置 > 新建策略。
2. 在告警策略页,策略类型项选择:云数据库 > MySQL > 主机监控。
说明:
为 RO 实例配置主从延迟监控,策略类型只能选主机监控,监控的是 RO 实例到其主实例的延迟信息。
为灾备实例配置主从延迟监控,策略类型若选择主机监控,则监控的是灾备实例到其主实例的延迟信息,若选择备机监控,则监控的是灾备实例的备机到灾备实例的延迟信息。
3. 在配置告警规则下完成对监控项“主从延迟距离”和“主从延迟时间”的触发条件设置,然后根据您的需要完成其他配置项的设置,单击完成。
4. 设置完成后,当“主从延迟距离”和“主从延迟时间”监控项满足触发条件时即可触发告警。


