The content of this page has been automatically translated by AI. If you encounter any problems while reading, you can view the corresponding content in Chinese.
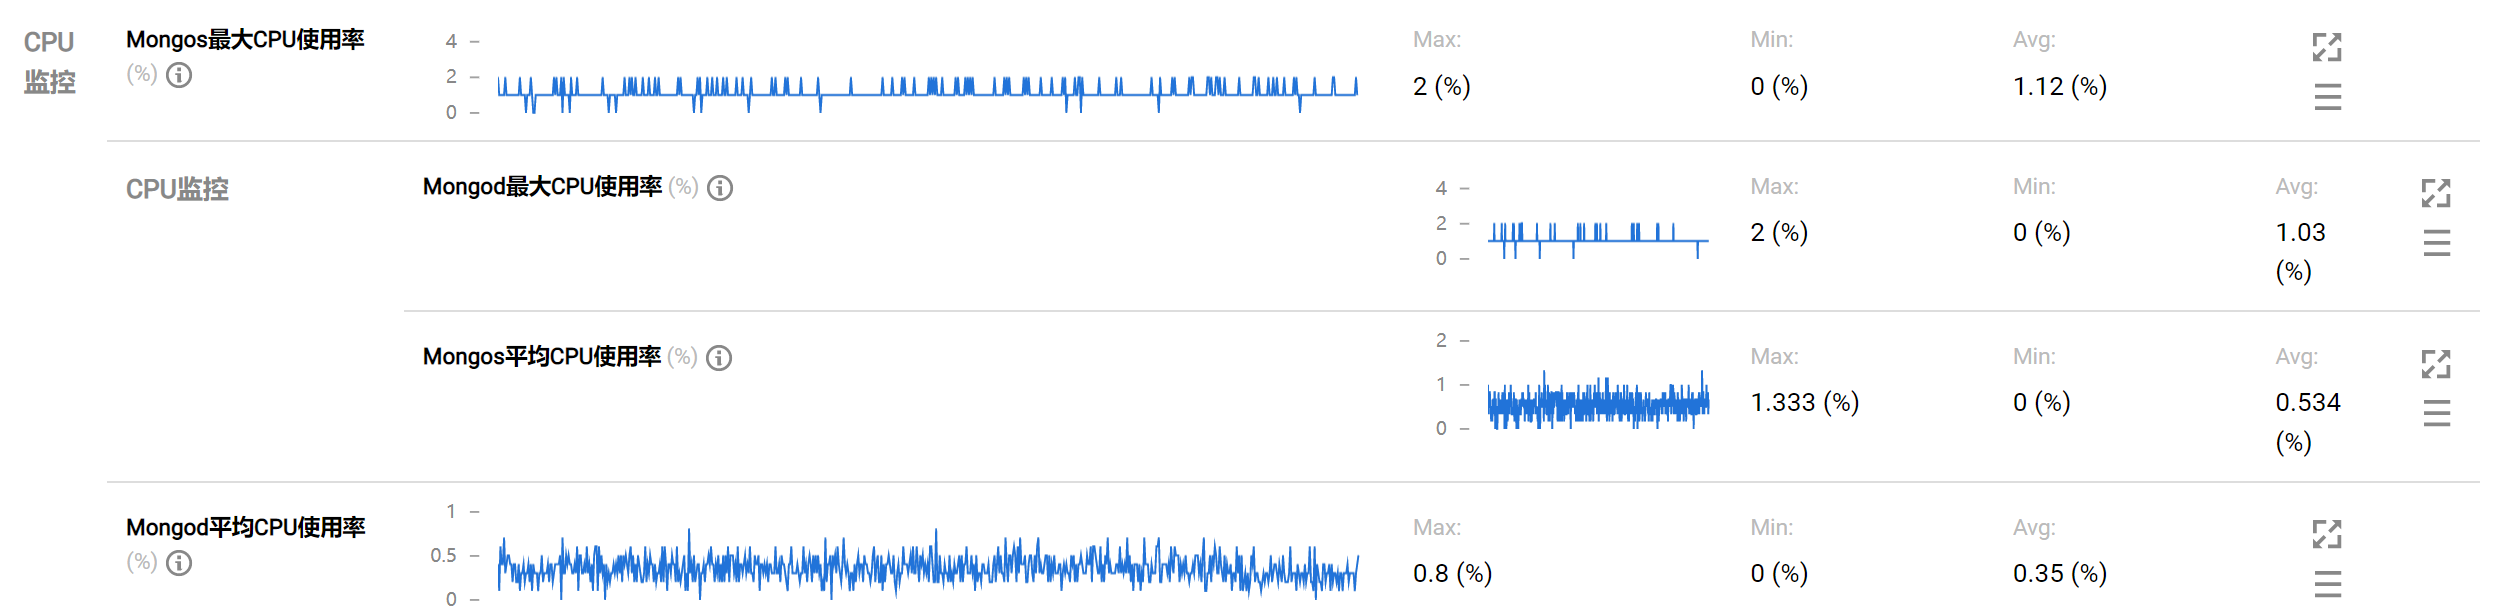
For daily operation and maintenance, log in to the TencentDB for MongoDB console, click the instance ID to enter the Instance Details page, select the System Monitoring tab, check the monitoring metrics details of the instance, and find that the database CPU monitoring metrics stay significantly high.
Cause Analysis and Solutions
No.
Possible Causes
Analysis of Causes
Troubleshooting Methods
Solution
1
Frequent Short Connections
The instance's large resource consumption in handling frequent short connections leads to high CPU utilization and a high number of connections, yet the QPS (queries per second) is not meeting expectations.
Utilize the Diagnosis and optimization feature of TencentDB for DBbrain to analyze the real-time session statistics and data of the database instance, confirming whether there is a phenomenon of sudden increase in connections. For the specific query method, please refer to Real-Time Session.
Adjust non-persistent connections to persistent connections. For more parameter information on different language types, please refer to MongoDB Official Website.
2
There are many unexpected requests on the business side, and requests take a long time.
Many unexpected requests or being maliciously requested may cause excessive CPU resource waste.
Please use the DBbrain (TencentDB for DBbrain, DBbrain) Diagnosis and optimization feature to troubleshoot all client requests on the business side on the Real-Time Session page to determine whether it is actually needed for the business.
For unexpected requests, you can directly perform the Kill operation on the DBbrain
(TencentDB for DBbrain, DBbrain)
Diagnosis and optimization page, in the Real-Time Session section for cleanup. For detailed operations, refer to Real-Time Session.
In the DBbrain (TencentDB for DBbrain, DBbrain) Diagnosis and optimization page, create SQL throttling tasks in the SQL Throttling section. You can set the SQL type, maximum concurrency, throttling duration, and SQL keywords to control the database request volume and SQL concurrency, ensuring service availability. For detailed operations and application cases, refer to SQL Throttling.
3
There are high complexity requests.
High complexity requests may cause excessive CPU resource consumption for the following reasons.
Sorting operation: Sorting during the query process itself consumes significant CPU resources.
Full table scan: If the database does not use indexes, the request may perform a full table scan, putting significant pressure on CPU and IO resources, leading to performance degradation.
Unreasonable indexes: This may result in a large number of physical reads and logical reads, occupying significant CPU resources due to insufficient covered fields or unreasonable order of index fields.
High complexity query requests are usually time-consuming and may generate slow logs. You can use the DBbrain's diagnosis and optimization feature for Slow SQL Analysis. In the slow log information list, check for relevant keywords. For specific operations, see Slow SQL Analysis.
Sorting related keywords: Sort, hasSortStage, etc.
Full table scan keywords
COLLSCAN: indicates that a full-collection scan is performed for the query.
docsExamined: represents document scan entries. The larger the docsExamined value, the more document entries are scanned, consuming more CPU resources.
Unreasonable index keywords
IXSCAN: indicates that an index scan is performed.
keysExamined: specifies index scan entries. The larger the keysExamined value, the more entries are scanned, consuming more CPU resources.
Increase in business volume, data scale growth, insufficient CPU specifications of the current instance.
Log in to the MongoDB console, click Instance ID to enter the instance details page, select the system monitoring tab, and view the instance's total request metrics QPS to check if the requests per second for the node are significantly high.