An instance provided by Tencent Cloud ES consists of an ES cluster and a Kibana console. The ES cluster can be accessed via the VPC VIP address and port within your VPC, and the Kibana console provides a public network address for browser access. Currently, you can only connect your data source to the ES cluster by yourself.
The following describes how to import your logs into ES and access Kibana from a browser to perform query and analysis, using the most typical log analysis architectures Filebeat + Elasticsearch + Kibana and Logstash + Elasticsearch + Kibana as examples.
Filebeat + Elasticsearch + Kibana
Deploying Filebeat
1. Download the Filebeat package and decompress it
Note
The Filebeat version should be compatible with the ES version.
This example uses Nginx logs as the input source, with the output configured to the intranet VIP address and port of the ES cluster. If you are using a platinum cluster, you need to add username and password authentication in the output.
Enter the filebeat-6.4.3-linux-x86_64 directory and modify the filebeat.yml configuration file as follows:
filebeat.inputs:
- type: log
enabled: true
paths:
- /var/log/nginx/access.log
output.elasticsearch:
hosts: ["10.0.130.91:9200"]# Private VIP address and port of the ES cluster
protocol: "http"# ES communication mode, http or https
username: "elastic"# username
password: "test"# password
3. Execute Filebeat
In the filebeat-6.4.3-linux-x86_64 directory, execute:
nohup ./filebeat -c filebeat.yml 2>&1>/dev/null &
Querying logs.
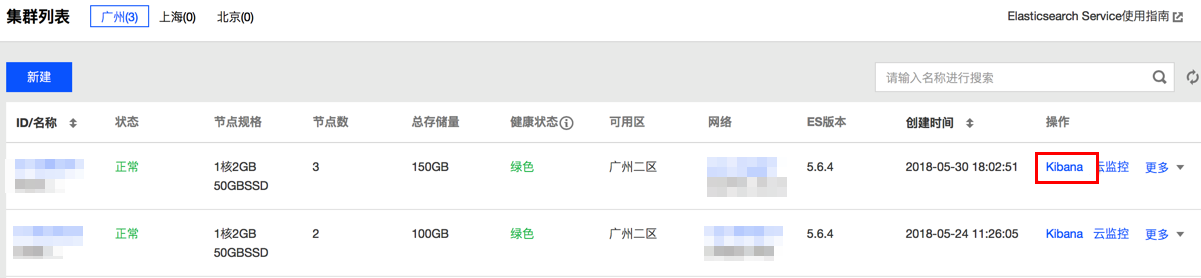
1. In the ES console cluster list page, select Operation > Kibana to enter the Kibana console.
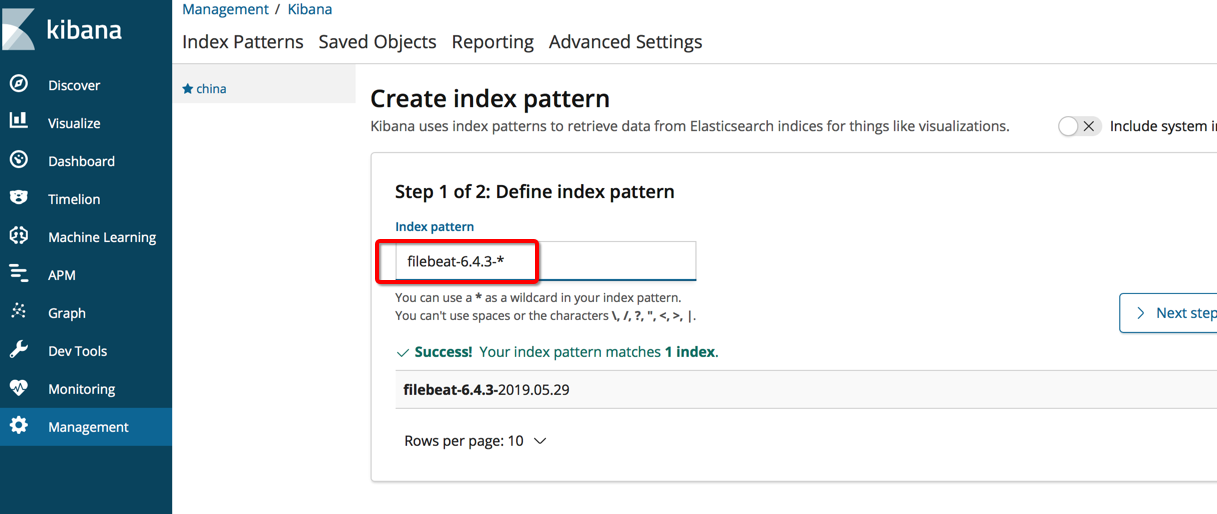
2. Enter Management > Index Patterns and add an index pattern named filebeat-6.4.3-*.
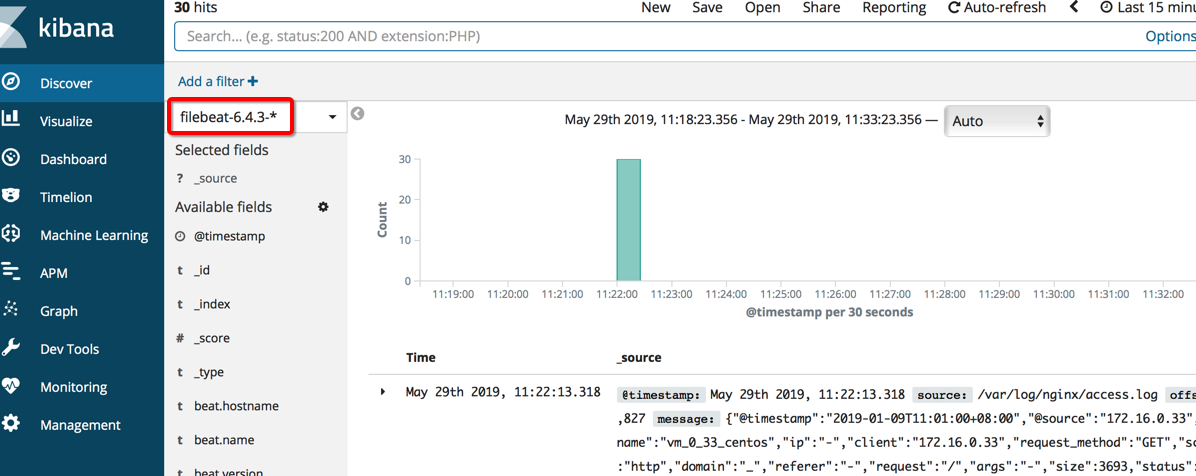
3. Click Discover and select the filebeat-6.4.3-* index item to retrieve nginx access logs.
Logstash + Elasticsearch + Kibana
Environment Preparation
You need to create one or more CVM instances as needed in the same VPC as the ES cluster and deploy the Logstash component on them.
The CVM needs to have more than 2 GB of memory.
Install Java 8 or a later version in the created CVM.
Deploying Logstash
1. Download the Logstash package and decompress it
Note
The Logstash version should be compatible with the ES version.
2. Configure Logstash
In this example, the input source is the Nginx log, and the output item is configured to the private network VIP address and port of the ES cluster. Create the test.conf configuration file with the following content:
input {
file{
path =>"/var/log/nginx/access.log"# Path to the NGINX access log
start_position =>"beginning"# Read the log from the beginning of the file. If this parameter is not set, the log will be read when data is written to the file, just like tail -f
}
}
filter {
}
output {
elasticsearch {
hosts =>["http://172.16.0.145:9200"]# Private VIP address and port of the ES cluster
index =>"nginx_access-%{+YYYY.MM.dd}"# Index name. Indices are automatically created on a daily basis
user =>"elastic"# Username
password =>"yinan_test"# Password
}
}
The ES cluster is configured to automatically create an index by default. The nginx_access-%{+YYYY.MM.dd} index in the above test.conf configuration file will be automatically created, and unless you need to set the mapping of the fields in the index in advance, you don't need to additionally call the API of ES to create indices.
3. Start Logstash
Enter the Logstash compressed package extraction directory logstash-6.4.3, and execute the following command to run Logstash in the background, filling the configuration file path with your created path.
Check the logs directory under the logstash-6.4.3 directory to confirm that Logstash has started normally. If it starts normally, it will log the following:
Sending Logstash logs to /root/logstash-6.4.3/logs which is now configured via log4j2.properties
[2019-05-29T12:20:27,125][WARN ][logstash.config.source.multilocal] Ignoring the 'pipelines.yml'file because modules or command line options are specified
[2019-05-29T12:20:27,167][INFO ][logstash.agent ] No persistent UUID file found. Generating new UUID {:uuid=>"2e19b294-2b69-4da1-b87f-f4cb4a171b9c", :path=>"/root/logstash-6.4.3/data/uuid"}
[2019-05-29T12:20:30,871][INFO ][logstash.outputs.elasticsearch] Elasticsearch pool URLs updated {:changes=>{:removed=>[], :added=>[http://elastic:xxxxxx@10.0.130.91:10880/]}}
[2019-05-29T12:20:30,901][INFO ][logstash.outputs.elasticsearch] Running health check to see if an Elasticsearch connection is working {:healthcheck_url=>http://elastic:xxxxxx@10.0.130.91:10880/, :path=>"/"}
[2019-05-29T12:20:31,449][WARN ][logstash.outputs.elasticsearch] Restored connection to ES instance {:url=>"http://elastic:xxxxxx@10.0.130.91:10880/"}
[2019-05-29T12:20:31,567][INFO ][logstash.outputs.elasticsearch] ES Output version determined {:es_version=>6}
[2019-05-29T12:20:31,574][WARN ][logstash.outputs.elasticsearch] Detected a 6.x and above cluster: the type event field won't be used to determine the document _type {:es_version=>6}
[2019-05-29T12:20:31,670][INFO ][logstash.outputs.elasticsearch] New Elasticsearch output {:class=>"LogStash::Outputs::ElasticSearch", :hosts=>["http://10.0.130.91:10880"]}
[2019-05-29T12:20:31,749][INFO ][logstash.outputs.elasticsearch] Using mapping template from {:path=>nil}
[2019-05-29T12:20:32,094][INFO ][logstash.outputs.elasticsearch] Installing elasticsearch template to _template/logstash
[2019-05-29T12:20:33,242][INFO ][logstash.inputs.file ] No sincedb_path set, generating one based on the "path" setting {:sincedb_path=>"/root/logstash-6.4.3/data/plugins/inputs/file/.sincedb_d883144359d3b4f516b37dba51fab2a2", :path=>["/var/log/nginx/access.log"]}
[2019-05-29T12:20:33,329][INFO ][logstash.pipeline ] Pipeline started successfully {:pipeline_id=>"main", :thread=>"#<Thread:0x12bdd65 run>"}