本文介绍腾讯云 Elasticsearch Service 集群运行日志的使用说明。用户可以通过集群的运行日志,了解集群的运行状况,定位问题,辅助集群的应用开发和运维。
日志查询
1. 登录 Elasticsearch Service 控制台,单击集群 ID/名称,进入集群详情页。
2. 选择日志页签,可查看集群的运行日志。
ES 共有四种类型的日志:主日志、搜索慢日志、索引慢日志和 GC 日志,日志内容包括日志时间、日志级别,以及具体信息等。
ES 默认提供集群7天内的运行日志,按时间倒序展示,用户可以按时间和关键字进行查询。此外,用户也可调用 ES API 调整日志相关配置,例如对于慢日志,设定查询或索引数据时,认为响应较慢的时间阈值。
3. 在日志页面的搜索框,可以按照时间范围和关键字查询相关日志,关键字查询语法同 Lucene 查询语法一致。
输入关键词查询,例如:“YELLOW”。
指定字段设置关键词,例如:
message:YELLOW。多个条件组合:
level:INFO and ip:10.0.1.1,可以查询相关日志。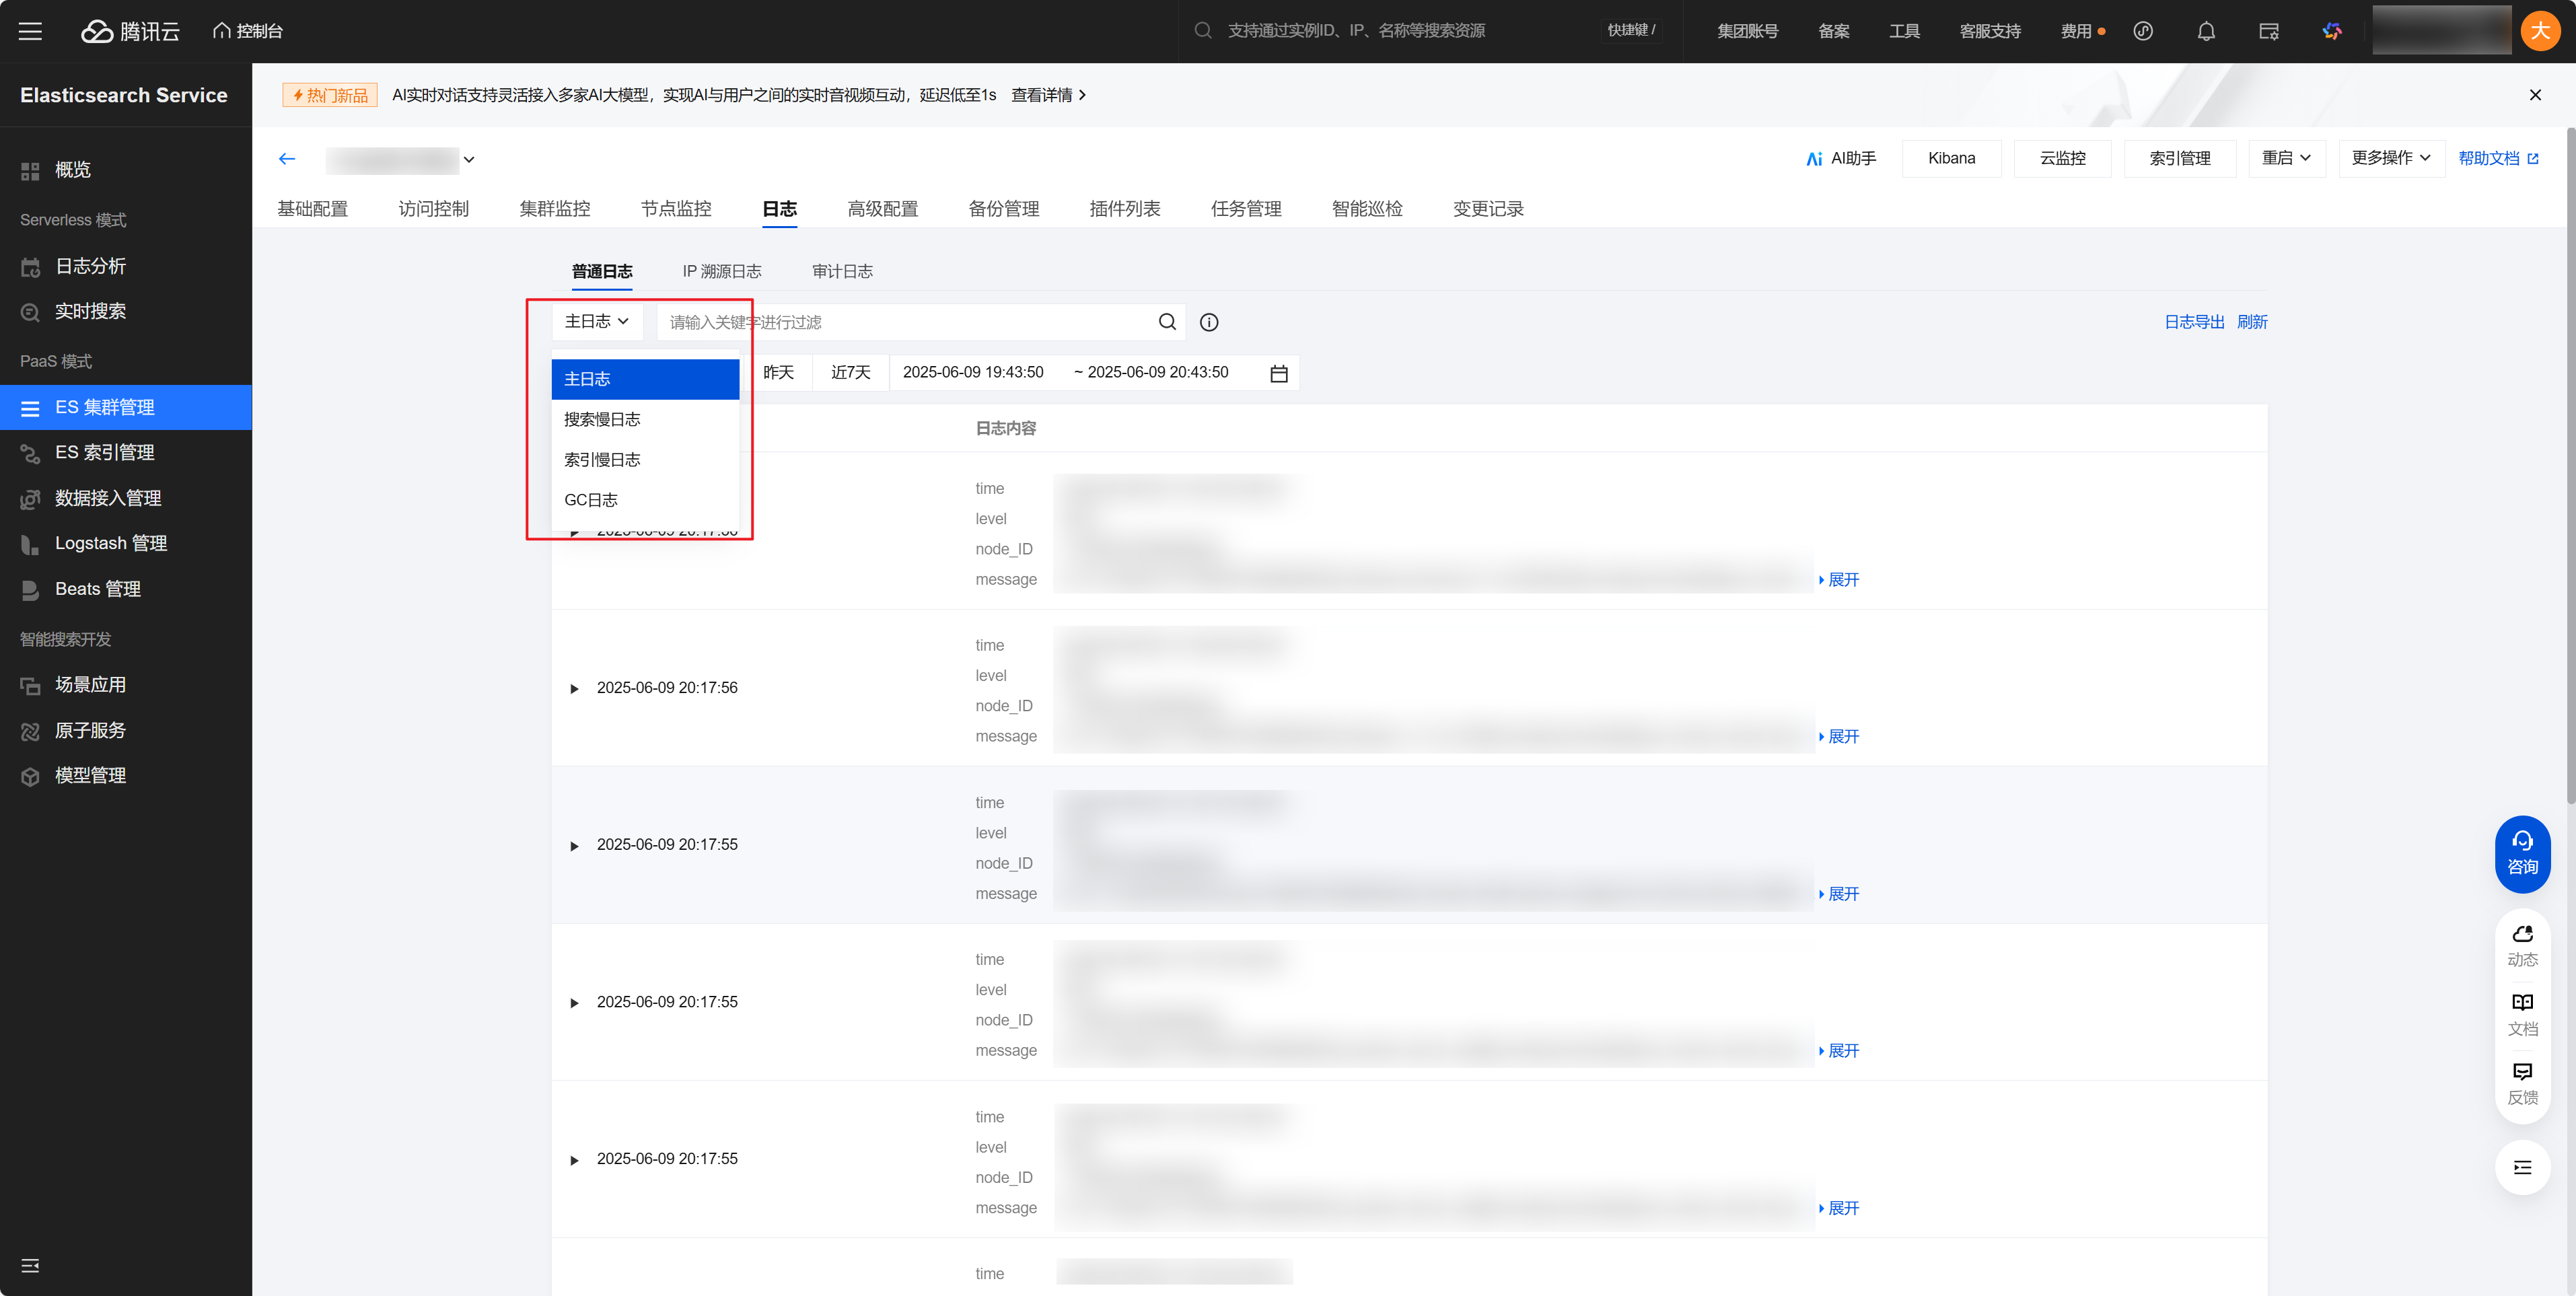
日志说明
主日志
展示集群运行产生日志的时间、级别、信息等,有 INFO、WARN、DEBUG 等不同级别。
2019-2-14 08:00:00 10.0****INFO[o.e.c.r.a.AllocationService] [1550199698000783811] Cluster health status changed from [YELLOW] to [GREEN] (reason: [shards started [[filebeat-2019.02.19][2]] ...]).2019-2-14 02:30:02 10.0****DEBUG[o.e.a.a.i.d.TransportDeleteIndexAction] [1550199698000783811] failed to delete indices [[[filebeat-2019.02.09/7VZM6Fa-Twmj8pVaAyyrxg]]]org.elasticsearch.index.IndexNotFoundException: no such indexat org.elasticsearch.cluster.metadata.MetaData.getIndexSafe(MetaData.java:475) ~[elasticsearch-5.6.4.jar:5.6.4]at org.elasticsearch.cluster.metadata.MetaDataDeleteIndexService.lambda$deleteIndices$0(MetaDataDeleteIndexService.jav
慢日志
慢日志的目的是捕获超过指定时间阈值的查询和索引请求,用于跟踪分析由用户产生的很慢的请求。
2018-10-28 12:04:17WARN[index.indexing.slowlog.index] [1540298502000001009] [pmc/wCALr6BfRm-sr3qOQuGXXw] took[18.6ms], took_millis[18], type[articles], id[AWa41-J9c0s1mOPvR6F3], routing[] , source[]
开启和调整慢日志
默认情况,慢日志不开启。开启慢日志需要定义具体动作(query、fetch 或 index)、期望的事件记录等级(INFO、WARN、DEBUG 等)、以及时间阈值。用户可以根据业务场景,开启和调整相关配置。
如需开启慢日志,可在集群详情页的右上角单击 Kibana 进入 Kibana 页面,通过 Dev Tools 调用 Elasticsearch 相关 API,或通过客户端调用配置修改 API。
配置所有索引:
PUT */_settings{"index.indexing.slowlog.threshold.index.debug" : "5ms","index.indexing.slowlog.threshold.index.info" : "50ms","index.indexing.slowlog.threshold.index.warn" : "100ms","index.search.slowlog.threshold.fetch.debug" : "10ms","index.search.slowlog.threshold.fetch.info" : "50ms","index.search.slowlog.threshold.fetch.warn" : "100ms","index.search.slowlog.threshold.query.debug" : "100ms","index.search.slowlog.threshold.query.info" : "200ms","index.search.slowlog.threshold.query.warn" : "1s"}
配置单个索引:
PUT /my_index/_settings{"index.indexing.slowlog.threshold.index.debug" : "5ms","index.indexing.slowlog.threshold.index.info" : "50ms","index.indexing.slowlog.threshold.index.warn" : "100ms","index.search.slowlog.threshold.fetch.debug" : "10ms","index.search.slowlog.threshold.fetch.info" : "50ms","index.search.slowlog.threshold.fetch.warn" : "100ms","index.search.slowlog.threshold.query.debug" : "100ms","index.search.slowlog.threshold.query.info" : "200ms","index.search.slowlog.threshold.query.warn" : "1s"}
GC 日志
ES 默认开启 GC 日志,以下两条具体的 GC 日志,分别展示日志的时间、节点 IP、日志级别等。
2019-2-14 20:48:2210.0.***INFO[o.e.m.j.JvmGcMonitorService] [1550199698000783711] [gc][380573] overhead, spent [307ms] collecting in the last [1s]2019-2-14 10:04:0910.0.***WARN[o.e.m.j.JvmGcMonitorService] [1550199698000784111] [gc][341943] overhead, spent [561ms] collecting in the last [1s]
日志导出
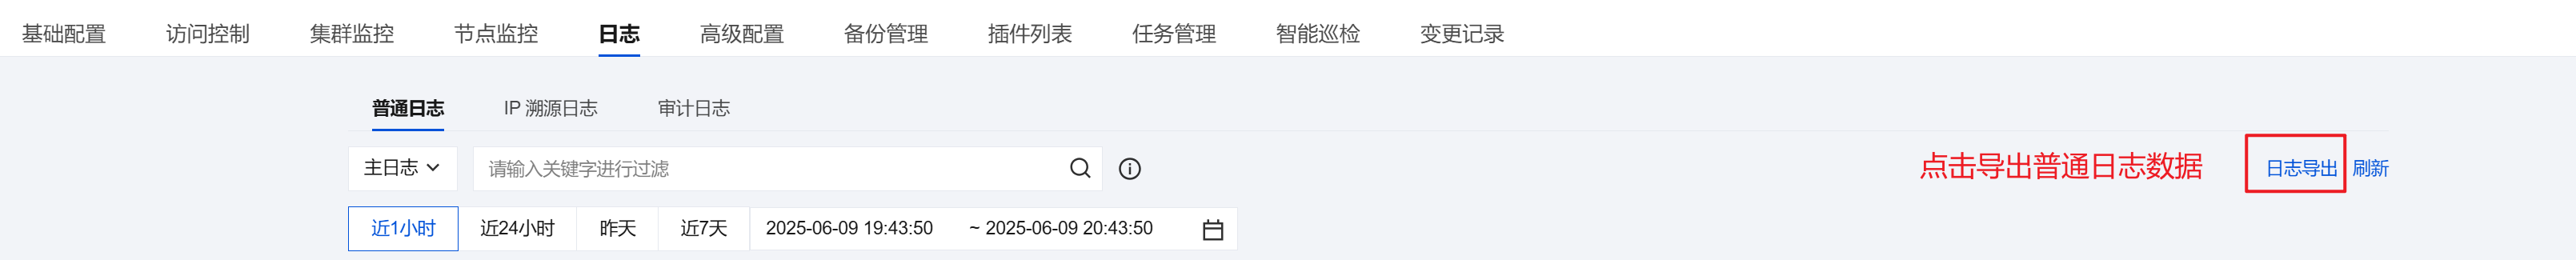
普通日志的导出功能可在日志页签下选择普通日志界面的右侧单击使用。日志导出操作会产生一定的数据写入,可能对集群性能产生轻微影响,用户可在非业务高峰期选择使用,以尽量降低对业务的负面影响。目前日志导出功能支持 Elasticsearch 6.8.0及以上的版本,但不支持开源版和开启内网访问 HTTPS 协议功能。
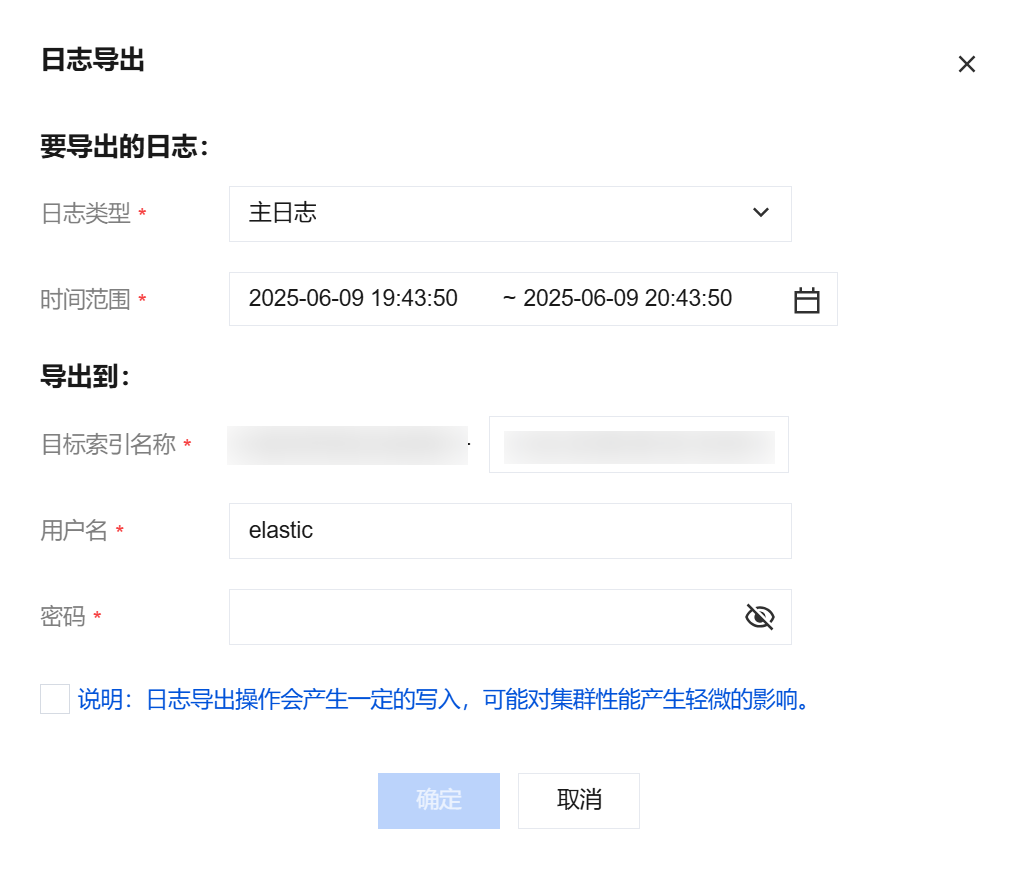
在弹出的日志导出界面中设置导出的日志类型和时间范围,然后配置导出的目标索引名称,输入密码后单击确定。
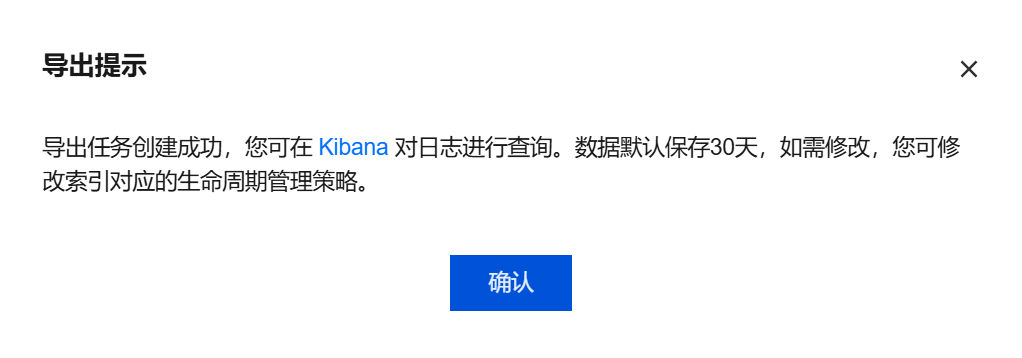
单击确定后会出现如下提示,表明导出任务已经创建完成。