The content of this page has been automatically translated by AI. If you encounter any problems while reading, you can view the corresponding content in Chinese.
2. In the top menu bar, select Region. Currently, the Beijing, Shanghai, Guangzhou, Nanjing, and Hong Kong (China) regions are supported.
3. In the left sidebar under Serverless mode, select Log Analysis.
Create Project Space
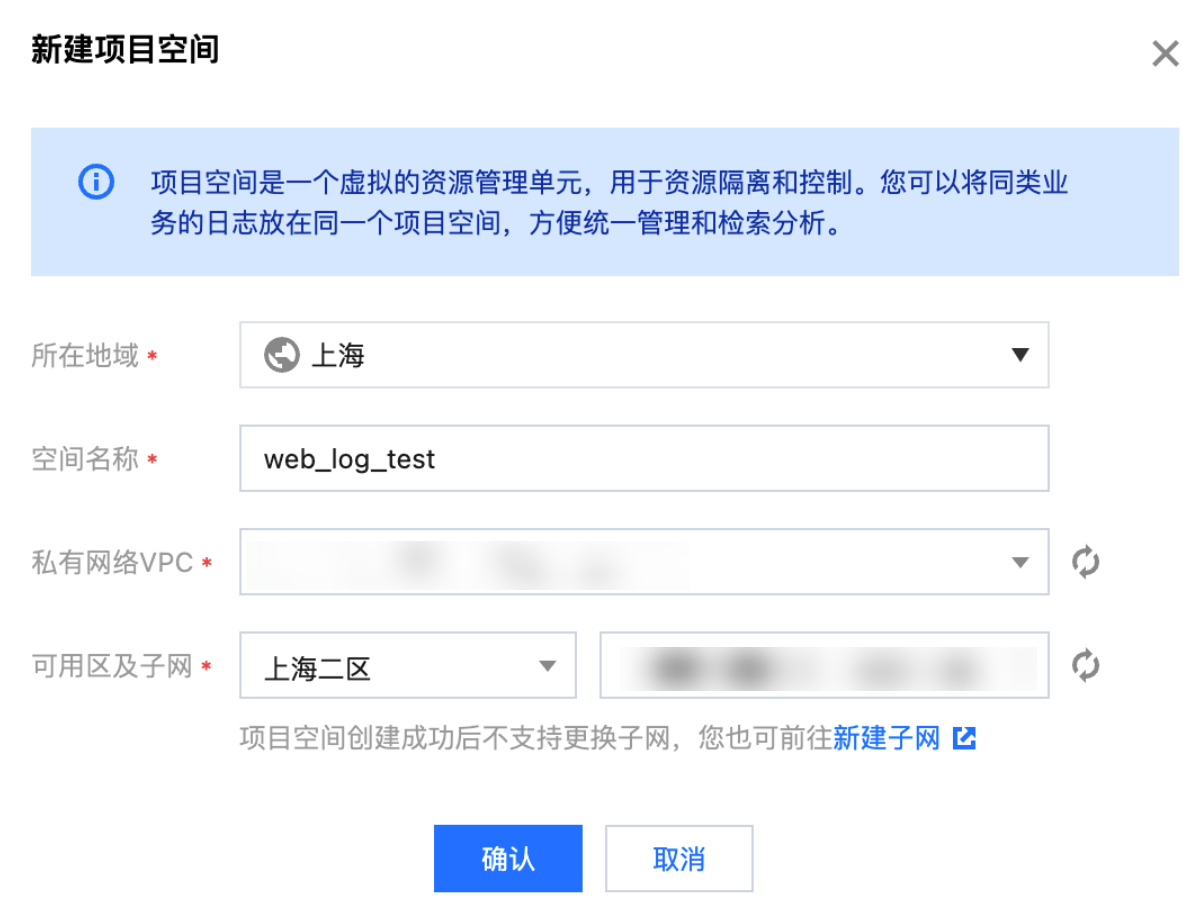
1. click Create a new space.
2. Enter the project space name , supporting 1 - 20 Chinese characters, English letters, numbers, underscores, or the separator "-".
3. click Confirm. If the verification is correct, the project space will be successfully created.
Search for the required CAM policy as needed, and click to complete policy association.
Note:
In ES Serverless Log Analysis, you can only create index and then write data via API or access data sources such as CVM or TKE on the corresponding index's "Data Access" tab. You can also access data while creating the index, achieving one-stop CVM log access and TKE log access. Below is an introduction to one-stop TKE log access operations.
TKE TKE Log access
On the ES Serverless Log Analysis homepage, select TKE TKE to enter the TKE log access page.
Search for the required CAM policy as needed, and click to complete policy association.
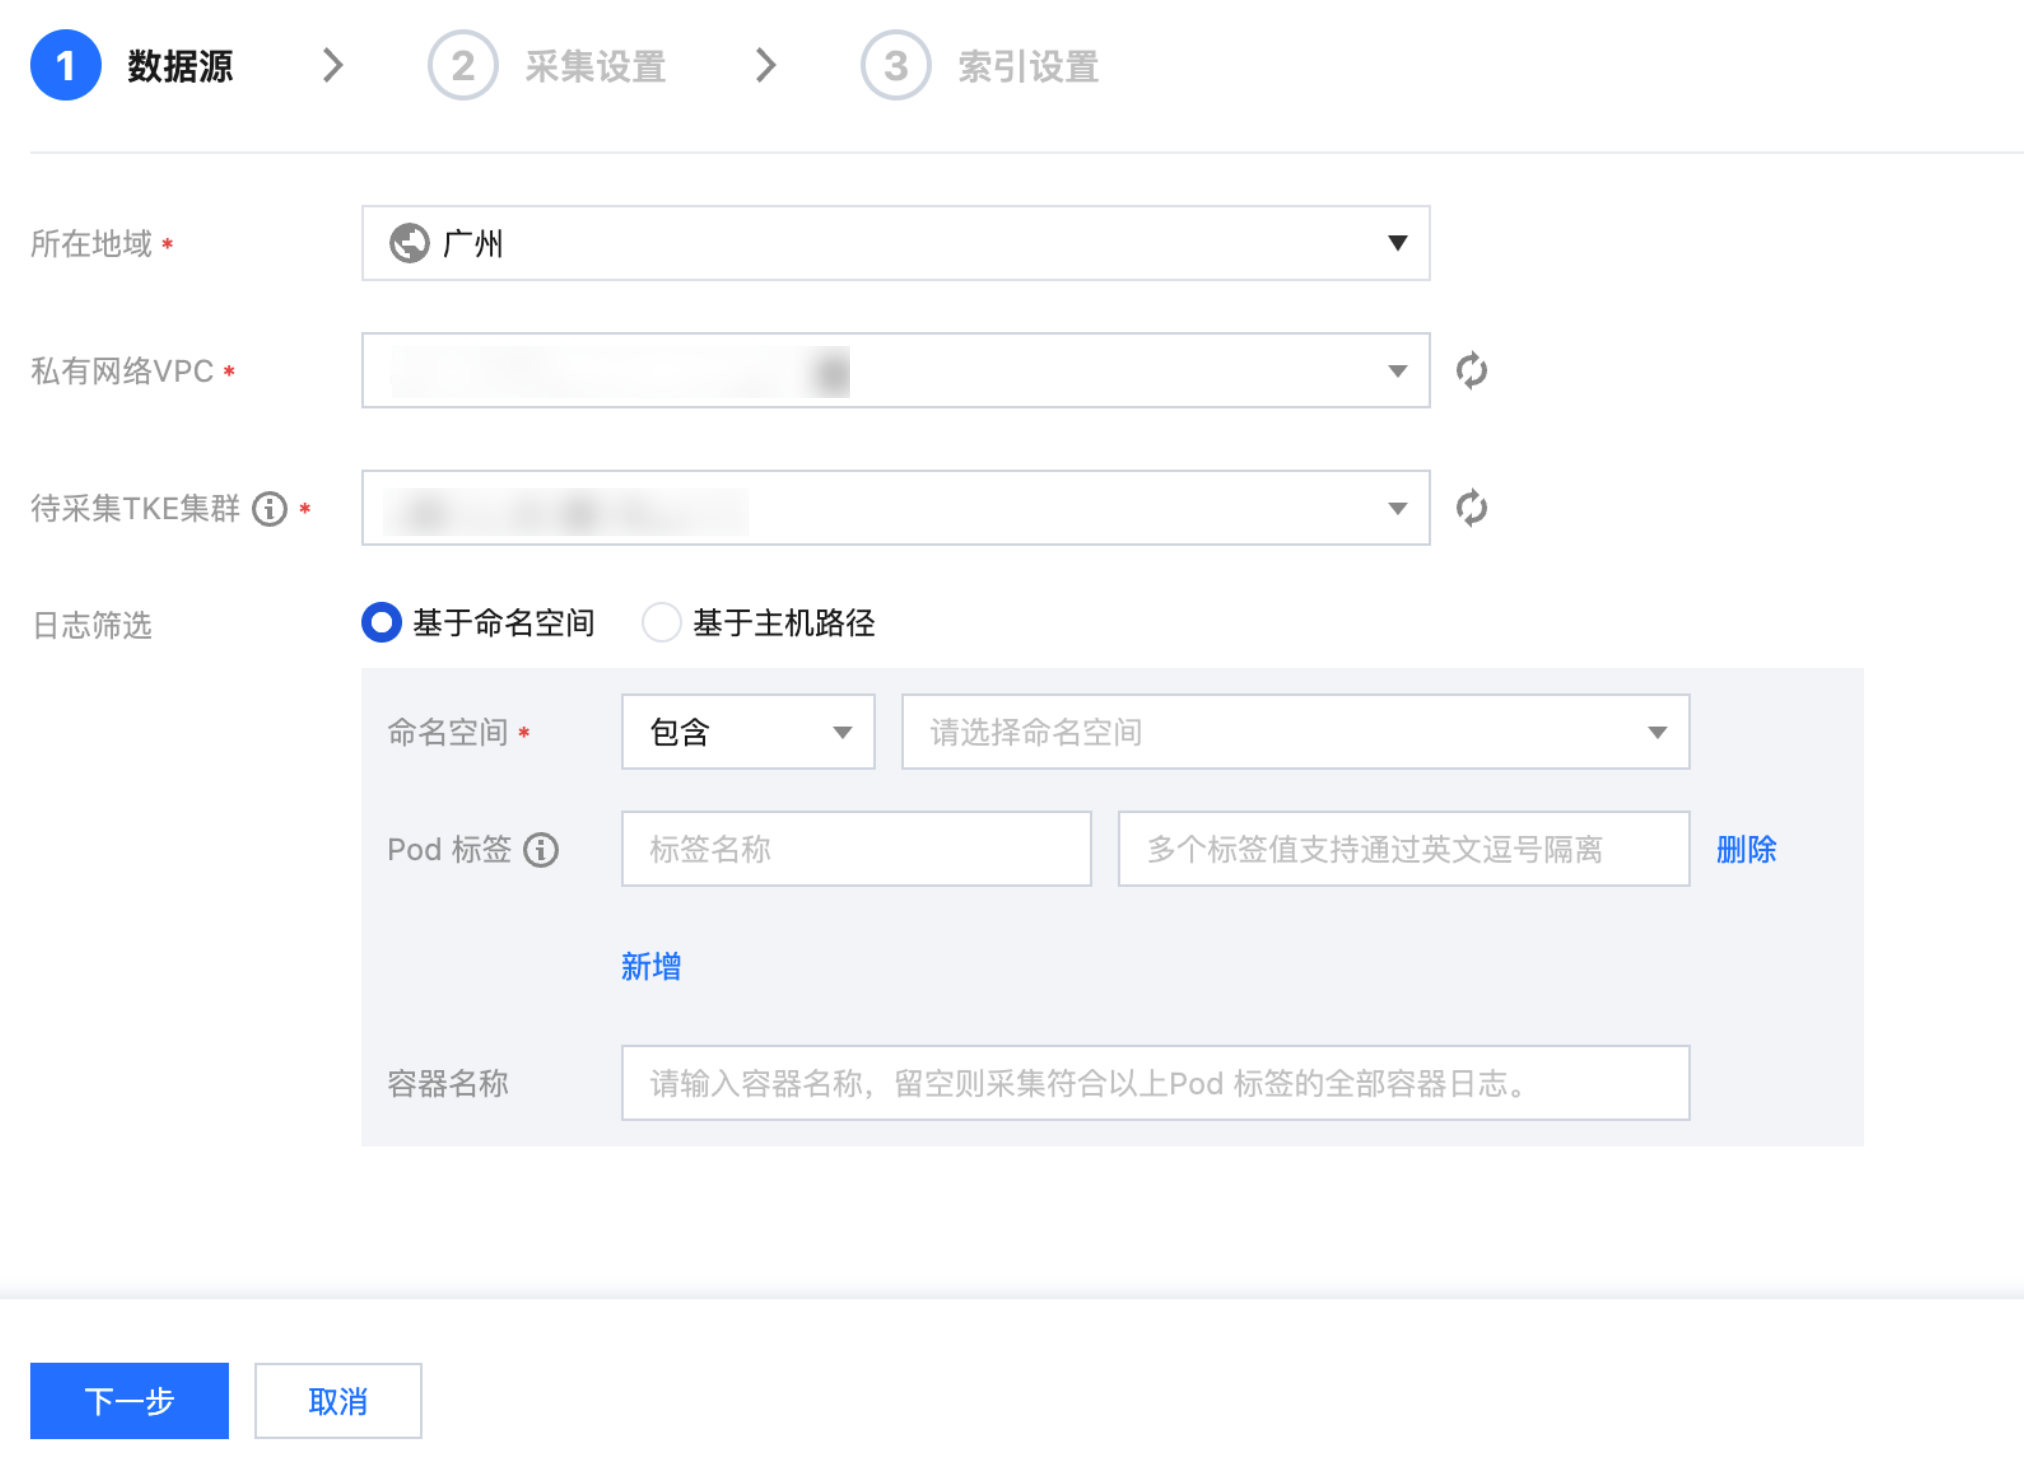
Data Source Settings
Region: The region where the TKE cluster is located.
VPC VPC: Mandatory. The VPC where the TKE cluster is located.
Collecting TKE Cluster ID: Mandatory. The ID of the TKE cluster to be collected. The TKE cluster must be in running status and be a standard cluster. If you need to collect logs from a Serverless Cluster (EKS), please contact us through a Ticket.
Based on namespace/host path: Mandatory. Namespace: The first dropdown allows you to select Include/Exclude, the second dropdown allows you to select the namespace. Multiple selections are supported, but you cannot select to exclude all namespaces. Based on the host path, please enter the host's absolute path, for example, /var/log/*.log.
Pod Tag: Optional. Supports creating multiple Pod Tags, with a logical AND relationship between Tags.
Container Name: Optional. The filled container name must be under the target cluster and namespace. If empty, Filebeat will collect all containers under the namespace that meet the Pod Tag requirements.
Search for the required CAM policy as needed, and click to complete policy association.
Collection Settings
Basic Settings
Collection Strategy: Supports full and incremental collections. Once created, the collection strategy cannot be modified. Full collection will collect historical logs as well as logs generated after the Filebeat configuration takes effect. Incremental collection will only collect logs generated after the Filebeat configuration takes effect.
Collection Parsing
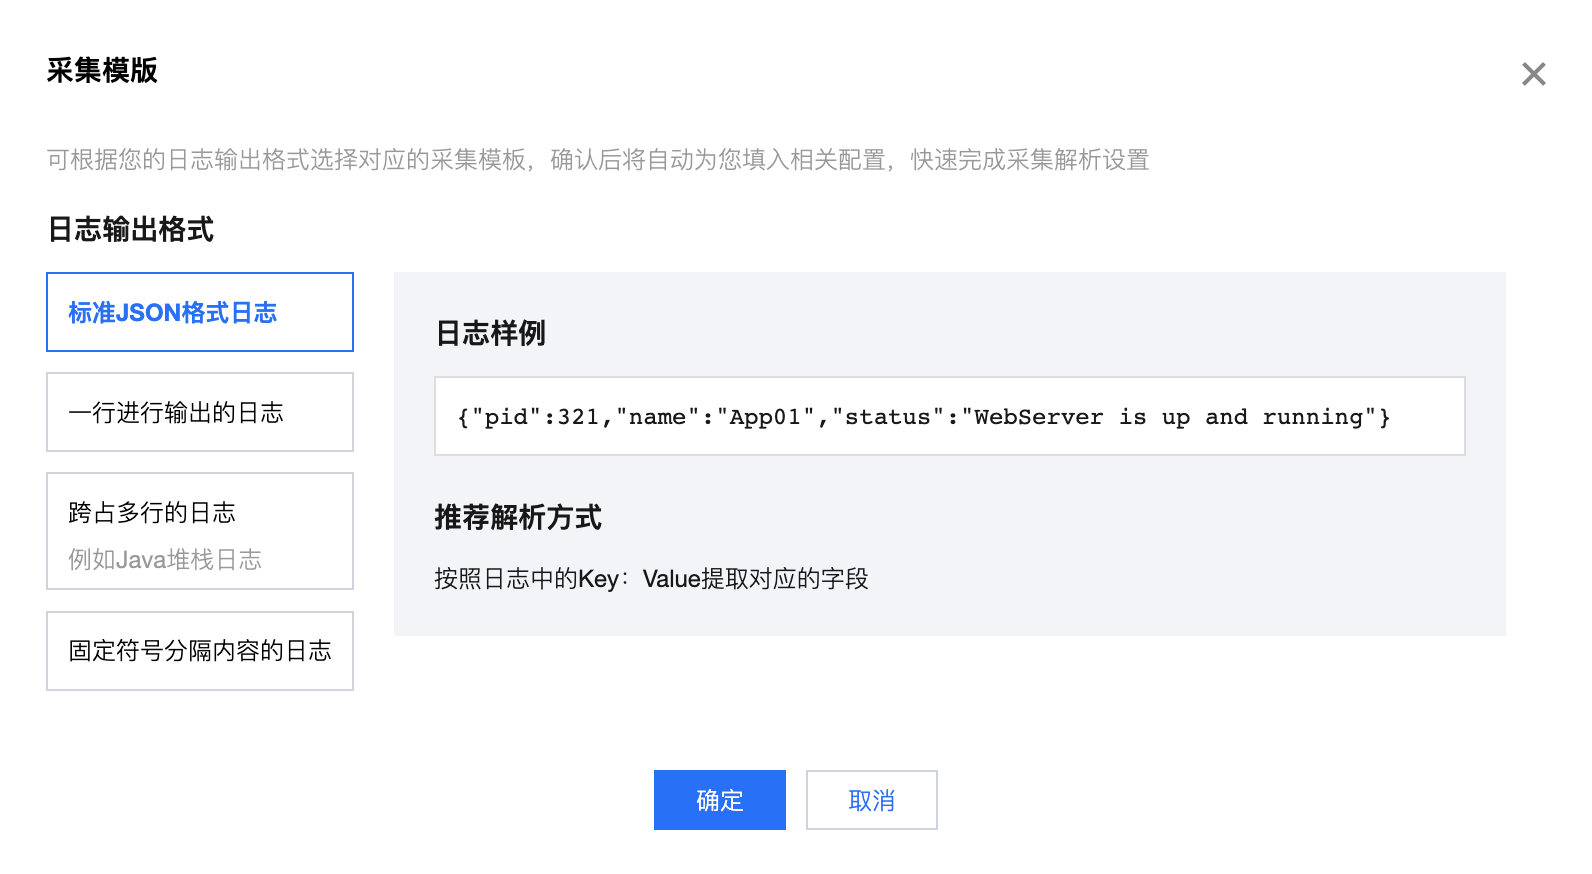
Collection Template: If you need to set up quickly or experience, you can select the appropriate collection template based on your log's output format. After confirming, you can return to the interface, update the log sample to the actual log data, and quickly complete the collection parsing settings.
Search for the required CAM policy as needed, and click to complete policy association.
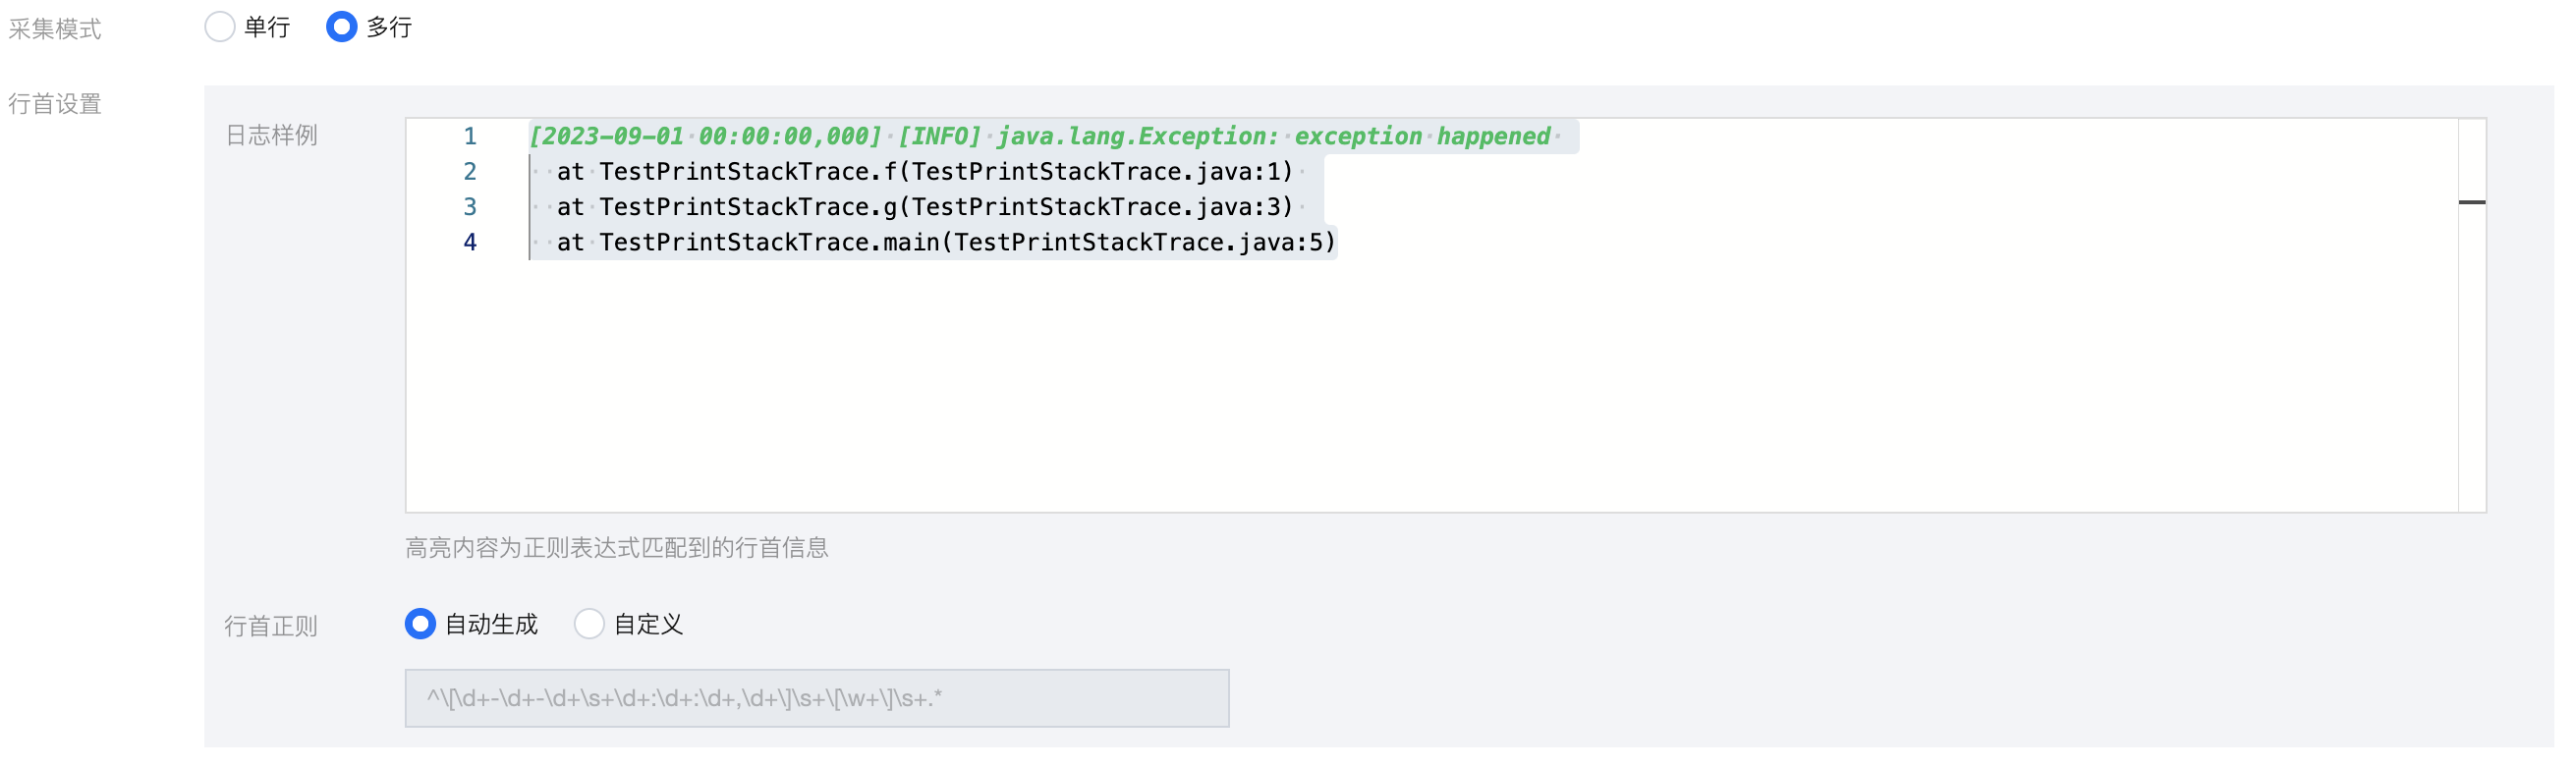
Collection Mode: Supports single-line and multi-line. Once created, the collection mode cannot be changed.
Single Line Text Log: Each line of log content is a separate log entry, separated by line breaks in the log file.
Multiline Text Log: A log entry consists of multiple lines, such as Java stack logs. In this mode, you need to configure log samples and regular expressions at the beginning of a line. Filebeat matches the beginning of a log entry using the regular expression for the line start, confirming the start of a log entry, and considers unmatched portions as part of the log entry until the next line start appears. After inputting the log sample, the system will automatically generate a regular expression for the line start. You can also choose to generate it from Definition. The highlighted content in the input box is the information matched by the regular expression for the line start.
Note:
Be sure to use logs from actual scenarios to facilitate the automatic extraction of regular expressions for the line start.
Search for the required CAM policy as needed, and click to complete policy association.
Extraction Settings: Support setting the extraction mode to full text log, JSON format, delimiter. Once created, the extraction mode cannot be modified. Details are as follows:
Full Text Log
JSON
Separator
No key-value extraction is performed on the log data; the log content will be stored in a field named "message", and you can perform search and analysis using automatic word segmentation capabilities.
For example, the raw data of a single-line log is as follows:
Tue Jan 01 00:00:00 CST 2023 Running: Content of processing something
The data collected into the index is as follows:
massage:Tue Tue Jan 01 00:00:00 CST 2023 Running: Content of processing something
For logs in standard JSON format, we can extract the corresponding fields according to the Key:Value pairs in the log.
Assume that one of your JSON log raw data is:
{"pid":321,"name":"App01","status":"WebServer is up and running"}
After structured processing, the log will become as follows:
{
    "pid":321,
    "name":"App01",
    "status":"WebServer is up and running"
}
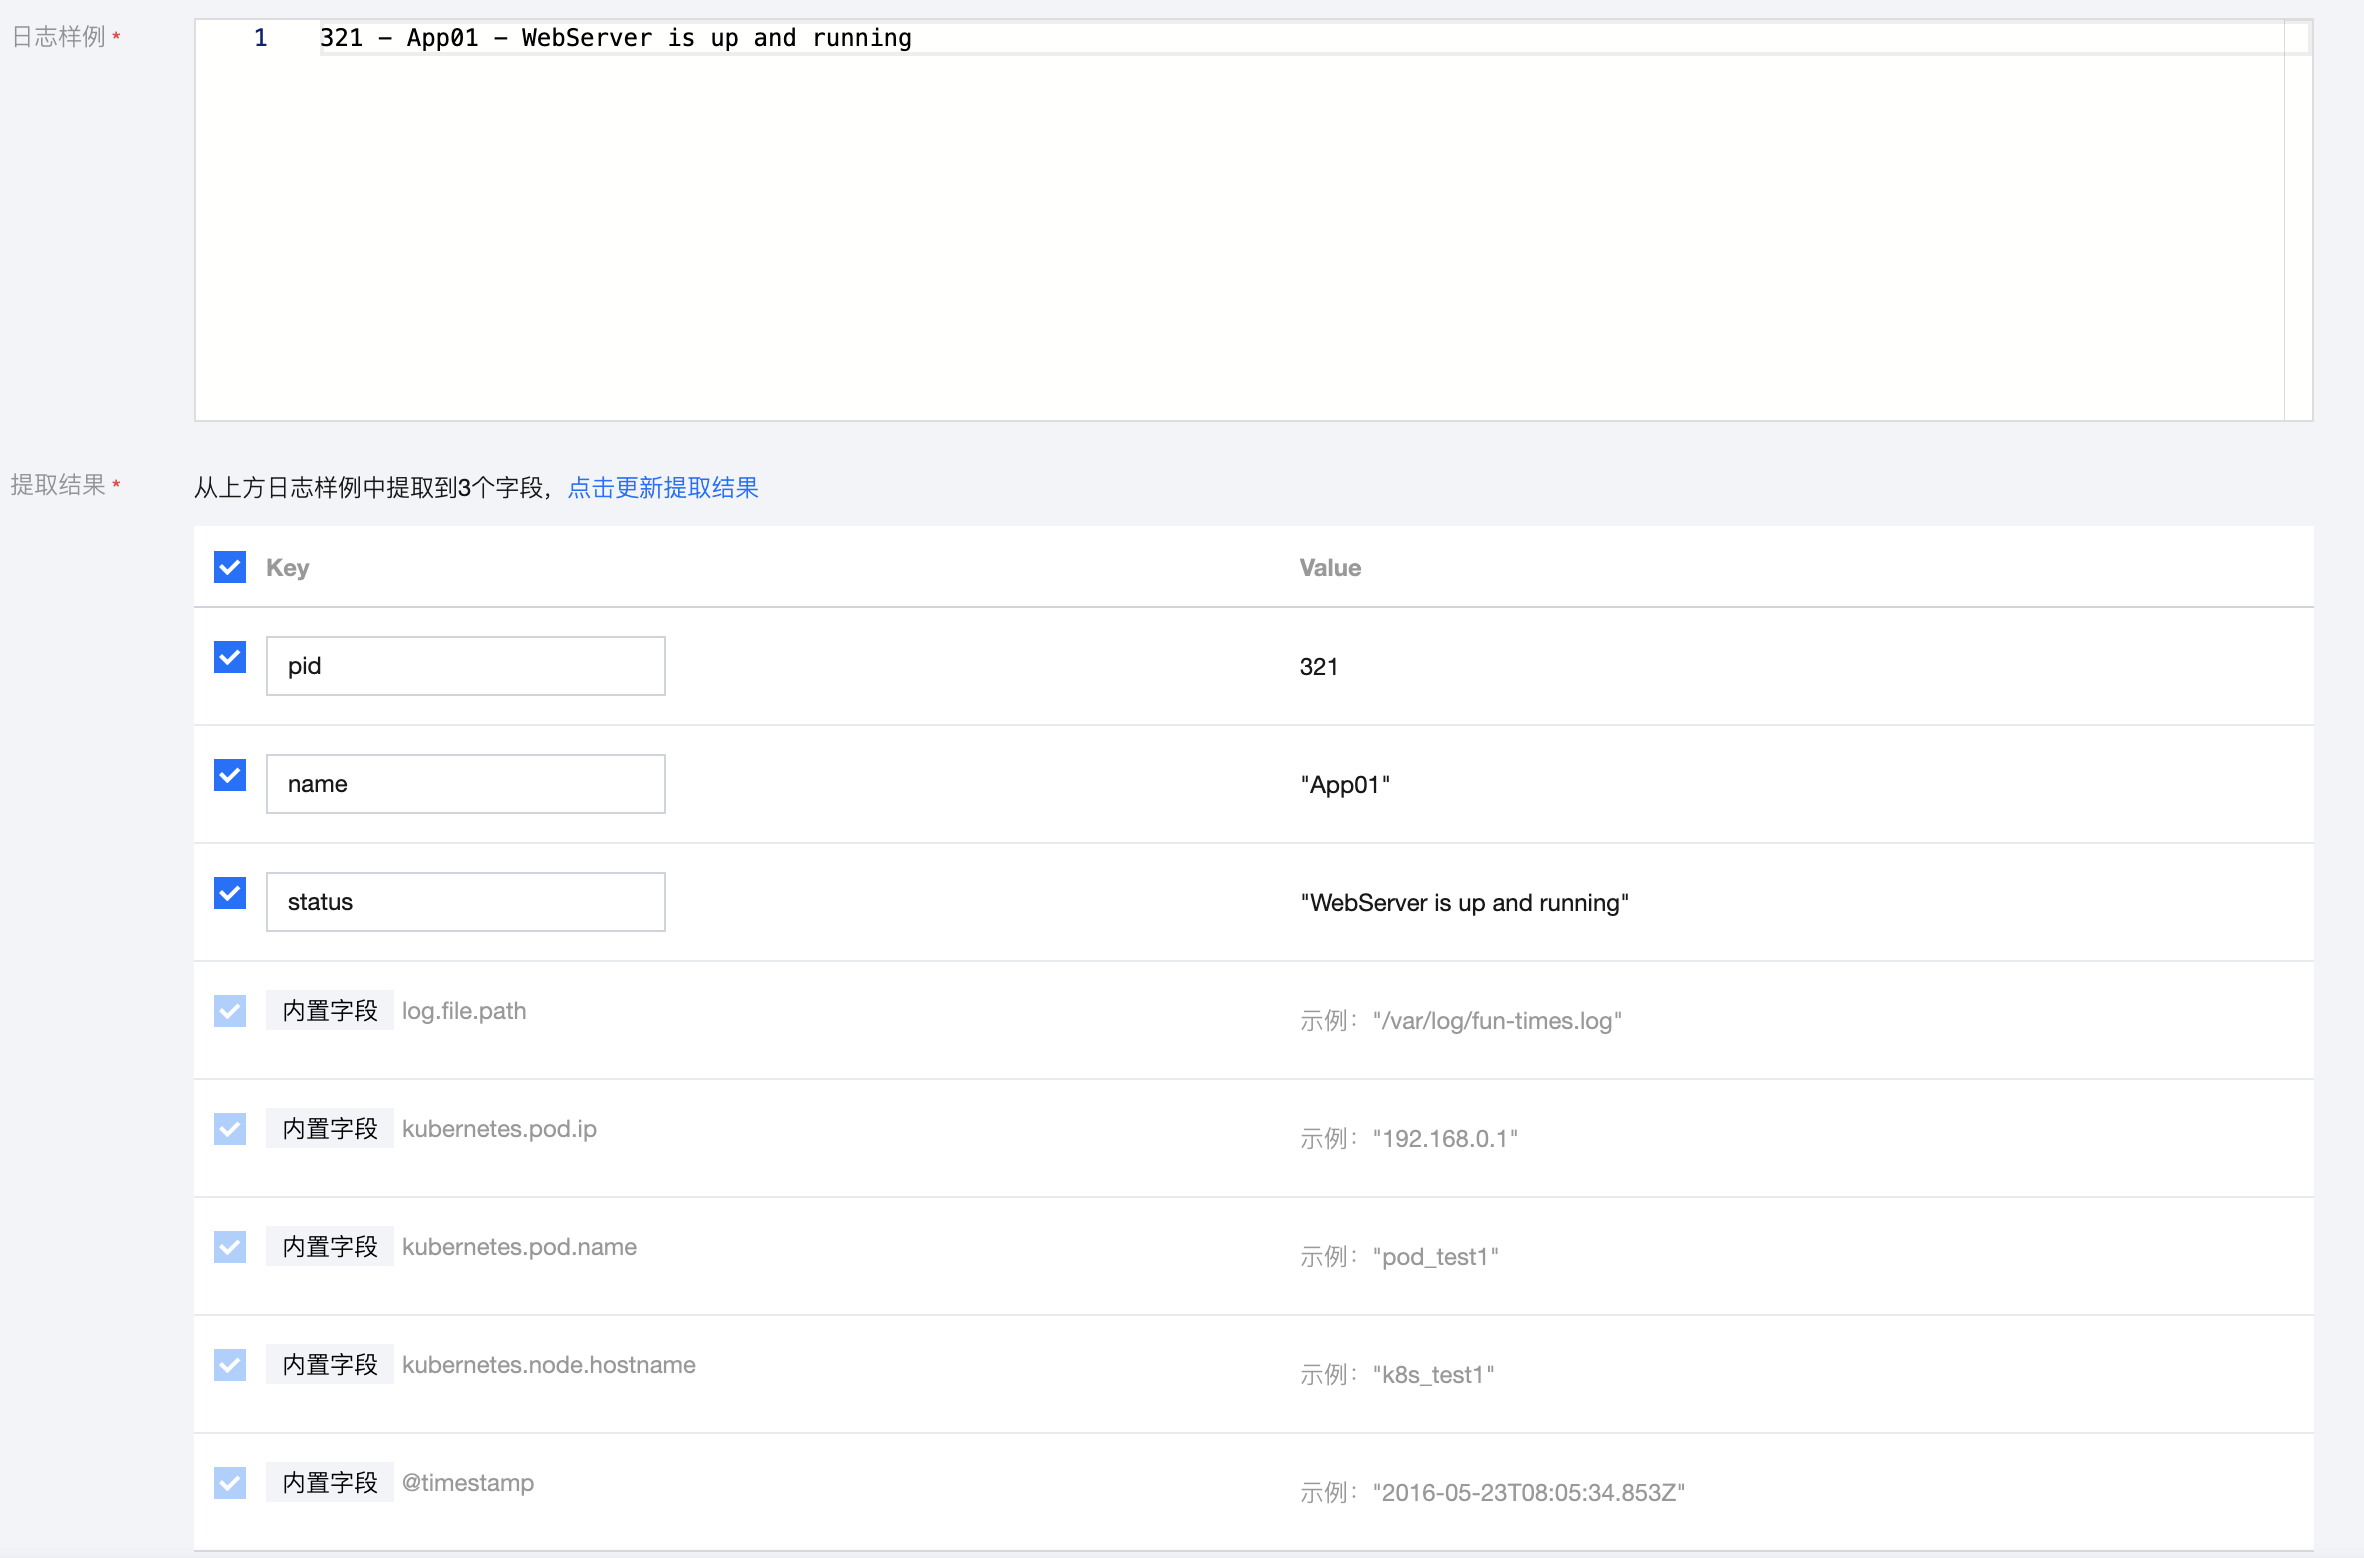
For logs with fixed separator content, we can extract key-value pairs from the log using the specified separator. The separator can be a single character or a string, and can be selected or entered in the console.
Assume that one of your log raw data is:
321 - App01 - WebServer is up and running
If the separator is specified as "-", the log will be split into 3 fields. We can assign unique keys to these 3 fields in the extraction results, as shown below:
pid: pid
name: App01
status: WebServer is up and running
Extraction results: If the extraction mode is selected as "JSON format" or "Separator", we can input a log sample, and the system will automatically extract the sample:
If the extraction mode is JSON format, the system will automatically fill in the extracted Key and Value. If unchecked, the corresponding fields will not be written into the index.
If the extraction mode is Separator, the system will automatically fill in the extracted Value. You can assign unique keys to each Value. If unchecked, the corresponding fields will not be written into the index.
Built-in Fields: When configuring TKE log collection in the console, Filebeat will write information such as log source, timestamp, etc., into the log in Key-Value pairs. These fields are built-in fields. If the Key names in your business logs overlap with the built-in field names, the content of the business log fields will take precedence, and the corresponding built-in fields will not be written into the index. The meanings of the built-in fields are as follows:
Built-in Field Name
Meaning
log.file.path
Path where the logs are stored
kubernetes.pod.ip
IP address of the pod where the log resides
kubernetes.pod.name
Name of the pod where the log resides
kubernetes.node.hostname
Name of the host where the log resides
@timestamp
Time when the log was collected
Search for the required CAM policy as needed, and click to complete policy association.
Retain Raw Logs : If checked, the raw log content before parsing extraction will be retained in this field.
Record parsing error: If the extraction mode is "delimiter", you can choose whether to record parsing errors. When checked, if parsing fails, the error message will be uploaded as the value (Value) to this field.
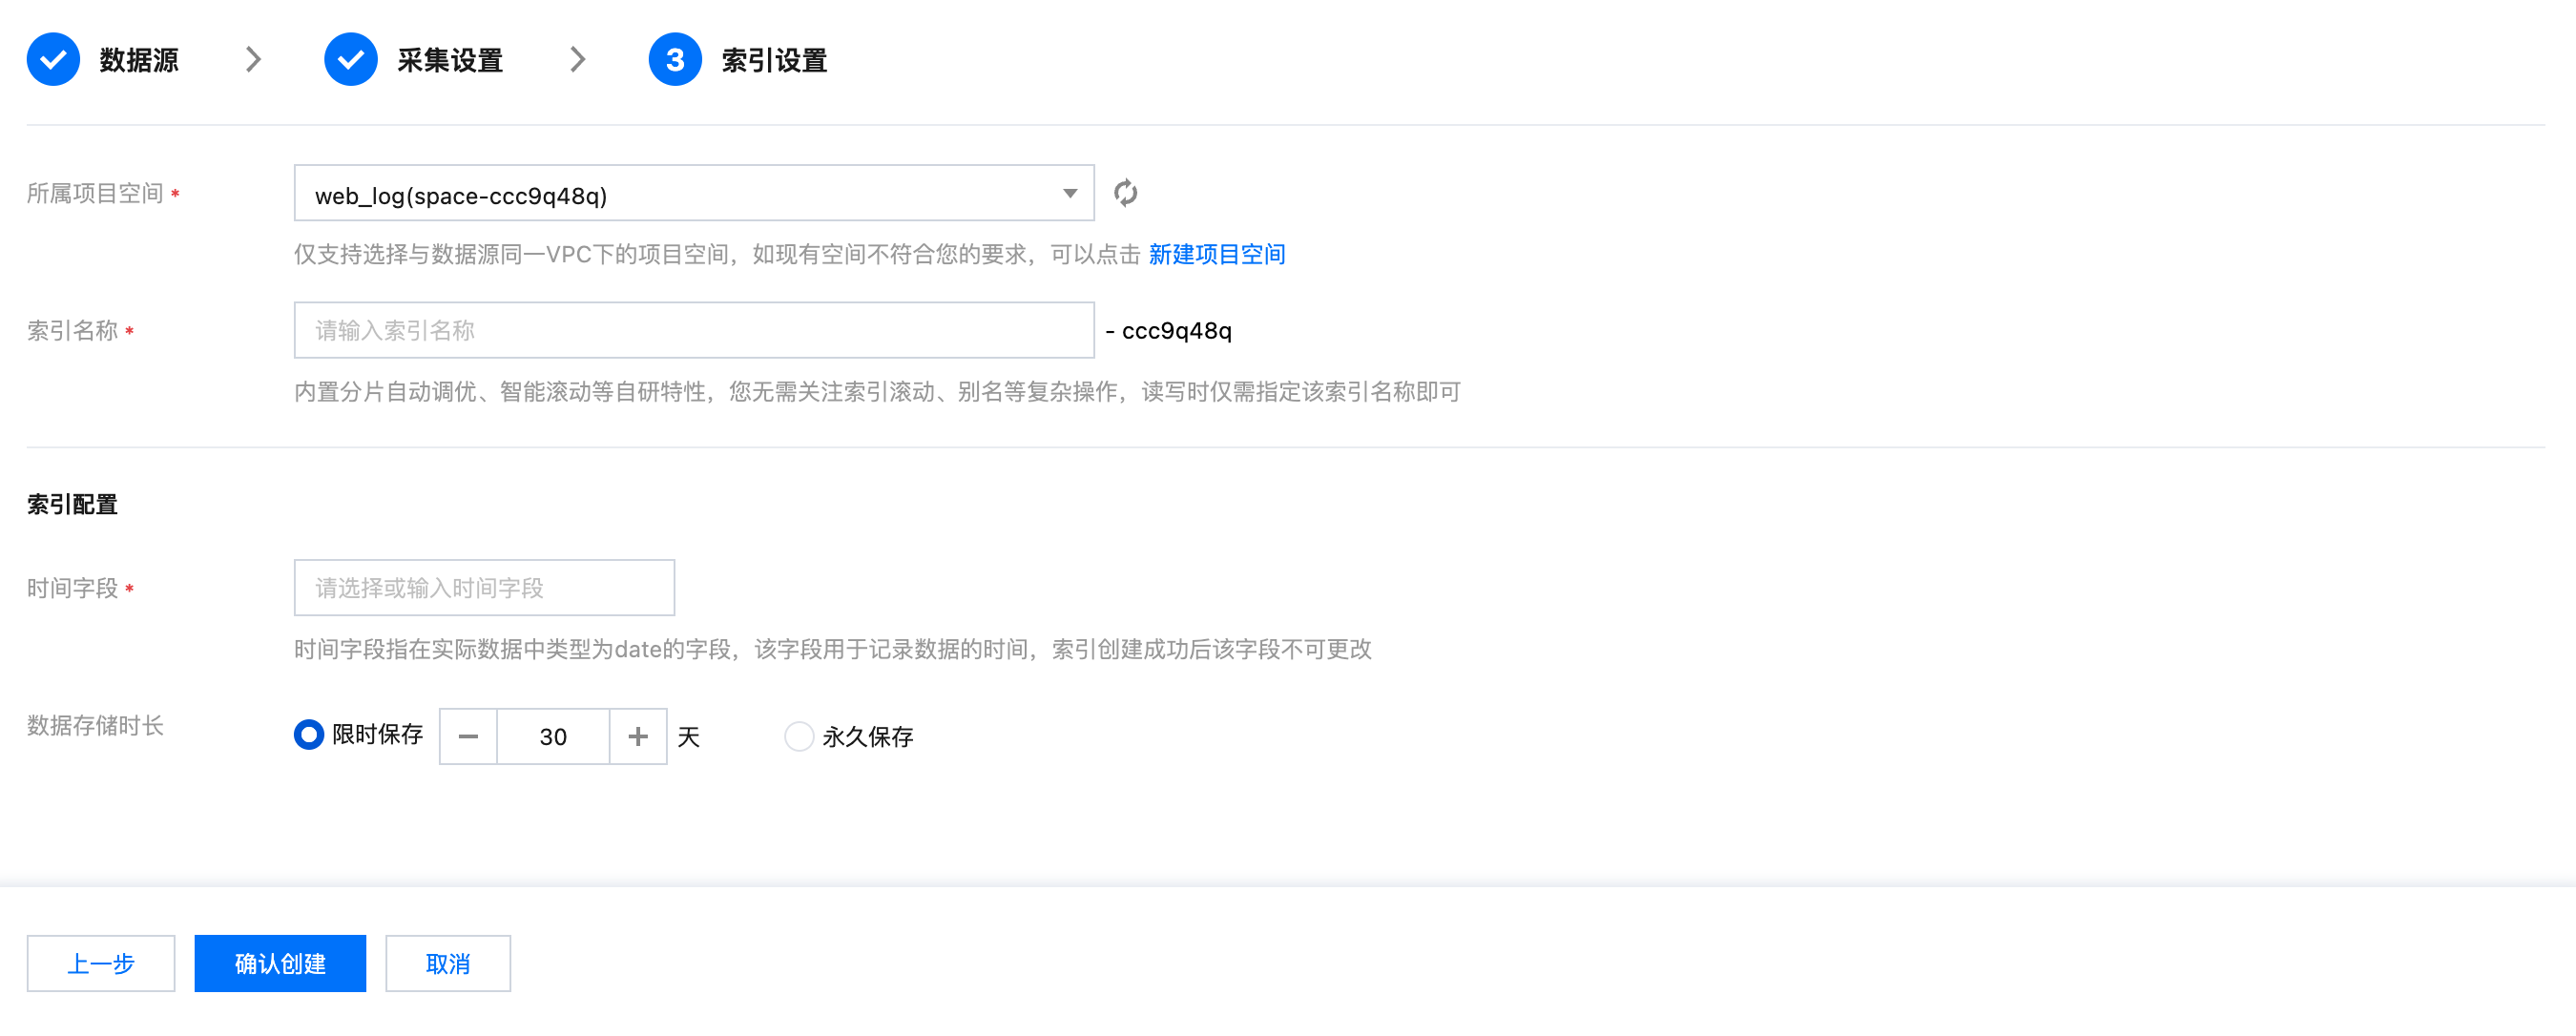
Index Configuration
Project Space : You can assign all indexes of the same business to a project space for easier management.
Index Name : Length is 1 - 100, supports lowercase letters, numbers, -, _, ;, @, &, =, !, ', %, $, ., +, (, ).
Field Mapping
Dynamic Generation: Enabled by default. Once enabled, it will automatically parse the written data and set the index fields.
Auto Configuration by Input Sample: After disabling Dynamic Generation, you can use Auto Configuration by Input Sample to generate the field mappings of the index. Enter a sample JSON data in the input field, and the platform will automatically validate it for you. After successful validation, the relevant fields will be mapped to the Field Mapping table.
Field Mapping splits the original data into multiple tokens by field (i.e., key:value) for index construction and performs retrieval based on this mapping. Details are as follows:
Parameter
Feature Description
Field Name
Field names in the written data
Field Type
Field data types supported in the interface: "text,date,boolean,keyword,long,double,integer,ip,geo_point"—a total of 9 types. More field types are supported in JSON Edit Mode. For details, refer to the Official Documentation
Allow Chinese Characters
This feature can be enabled when the field contains Chinese and you need to retrieve the Chinese content. After enabling, the ik_max_word tokenizer will be used by default for the text field
Enabling index
After enabling, an index will be built for the field to be used for retrieval
Enable Statistics
After enabling, statistical analysis can be performed on the field values, which will increase index storage
Time Field
The time field refers to the field of the type date in the actual data. Once the index is successfully created, this field cannot be changed.
Note:
The time field is enabled by default with Indexing Enabled and Statistics Enabled, and cannot be turned off.
Data Storage Duration:
1.1 You can set the data storage duration. By default, it is set to 30 days, and permanent storage is also supported.
Search for the required CAM policy as needed, and click to complete policy association.
1.2 After filling in the information correctly, click Confirm Create to complete TKE log collection.