The content of this page has been automatically translated by AI. If you encounter any problems while reading, you can view the corresponding content in Chinese.
This document describes the features and operations of the Assets Dashboard.
Overview
The Assets Overview presents the data of your servers and 16 key asset fingerprint items in a visualized form to give you a picture of your server assets.
Use Limits
All Cloud Workload Protection Platform (CWPP) users can view the Assets Dashboard, but due to version limits on asset fingerprint collection, the data may vary. Only paid protection versions can collect asset fingerprint data, and basic version users need to upgrade their version.
The asset fingerprints collected in each version are as follows:
Host Security Protection Version
Collected Asset Fingerprint Items
Basic Version (Free)
Not supported.
Professional Edition
10 types of assets: Resource Monitoring, Accounts, Ports, Processes, Software Applications, Databases, Web Applications, Web Services, Web Frameworks, and Websites
Flagship Edition
16 types of assets: Resource Monitoring, Accounts, Ports, Processes, Software Applications, Databases, Web Applications, Web Services, Web Frameworks, Websites, JAR Archive Files, Startup Services, Scheduled Tasks, Environment Variables, Kernel Modules, and System Installation Packages
Note:
On the Asset Overview page, asset fingerprint data is collected automatically every 8 hours (manual collection is supported).
Operation Steps
Log on to the CWPP Console. In the left navigation pane, select Asset Center > Asset Dashboard to view the following asset statistics:
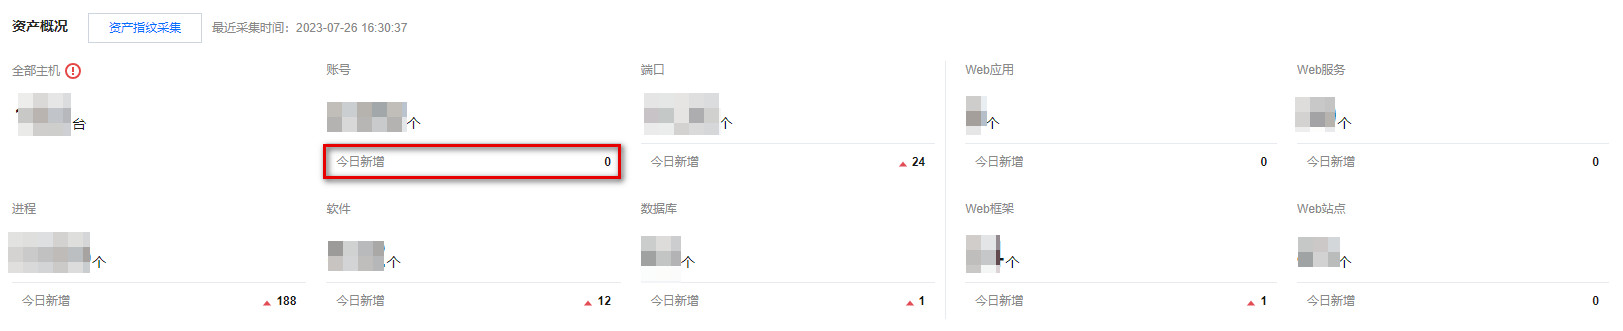
The Asset Overview panel displays the statistics of all assets and asset fingerprints. Below shows the new asset fingerprints added today.
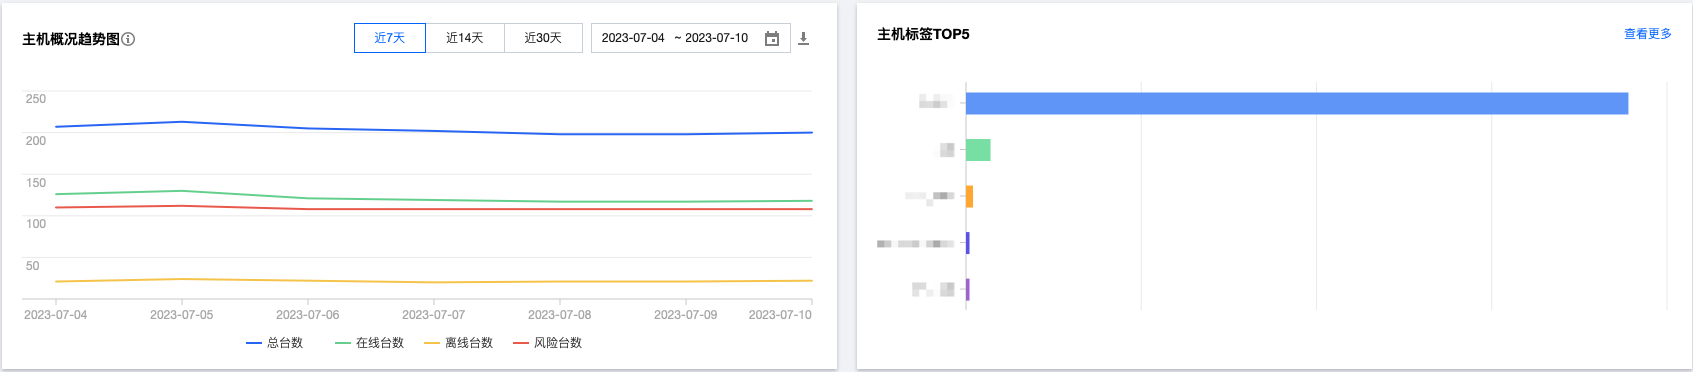
The Host Overview trend chart (total number, online number, offline number, risk number) supports queries for any time period within a year and supports download export. The top 5 host tags display the most used tags among all hosts.
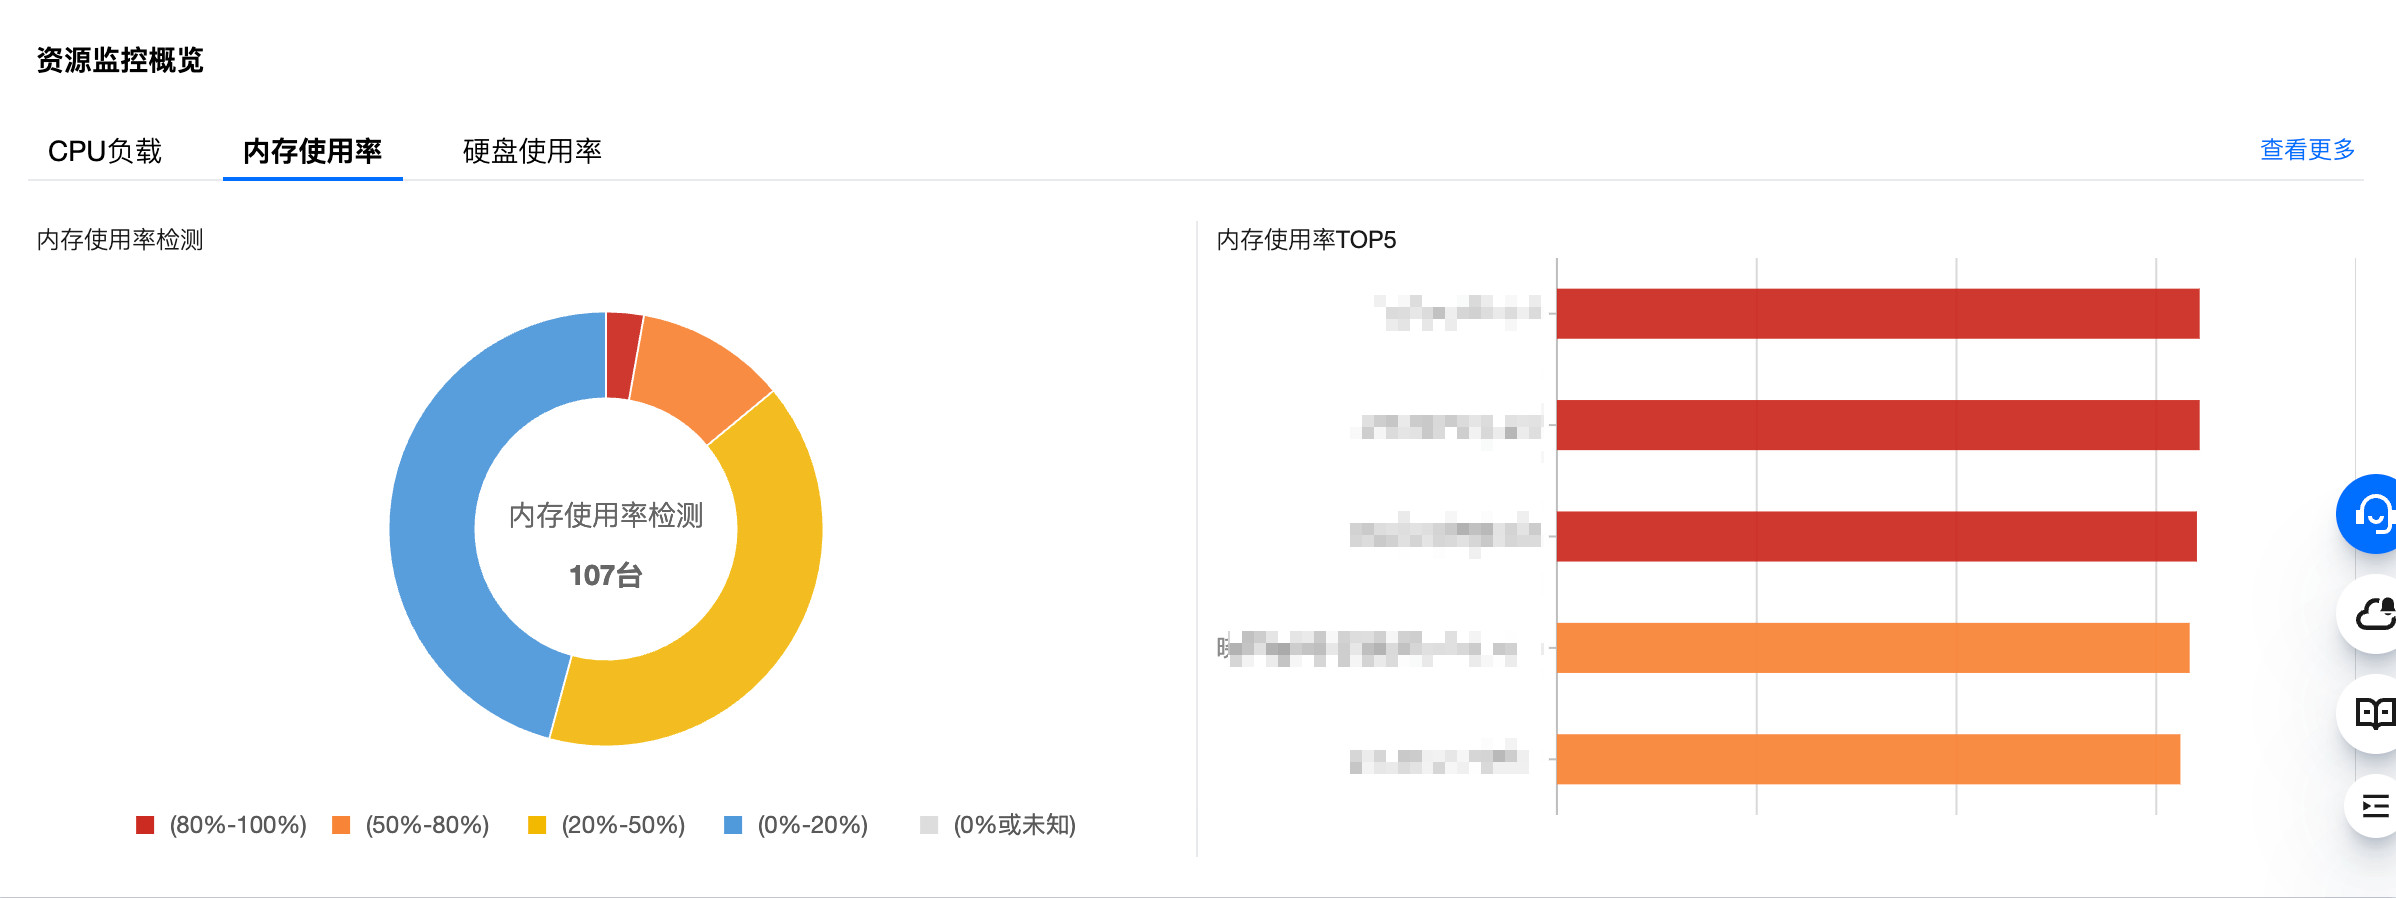
The Resource Monitoring overview displays the distribution of CPU load, memory usage, and hard disk usage rate, as well as the corresponding top 5.
Note:
CPU Load: Only supports obtaining CPU load for servers with Linux systems, Windows systems are temporarily considered unknown.
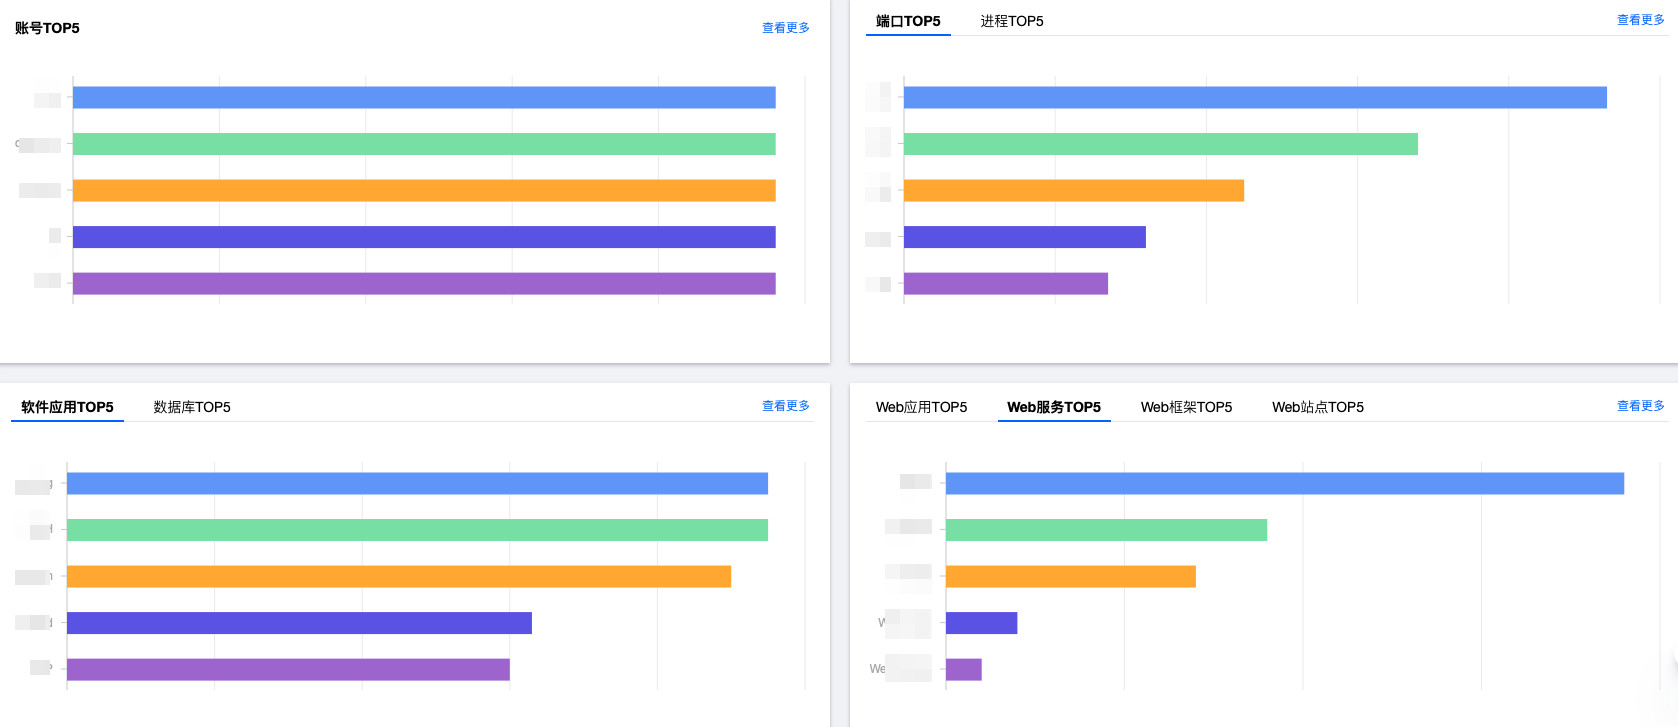
View top 5 accounts, top 5 ports, top 5 processes, top 5 software applications, top 5 databases, top 5 web applications, top 5 web services, top 5 web frameworks, and top 5 web sites.