生信技能树七天学习小组 Day1笔记
原创生信技能树七天学习小组 Day1笔记
原创
可乐同学与生信死磕到底
修改于 2024-03-22 23:52:58
修改于 2024-03-22 23:52:58
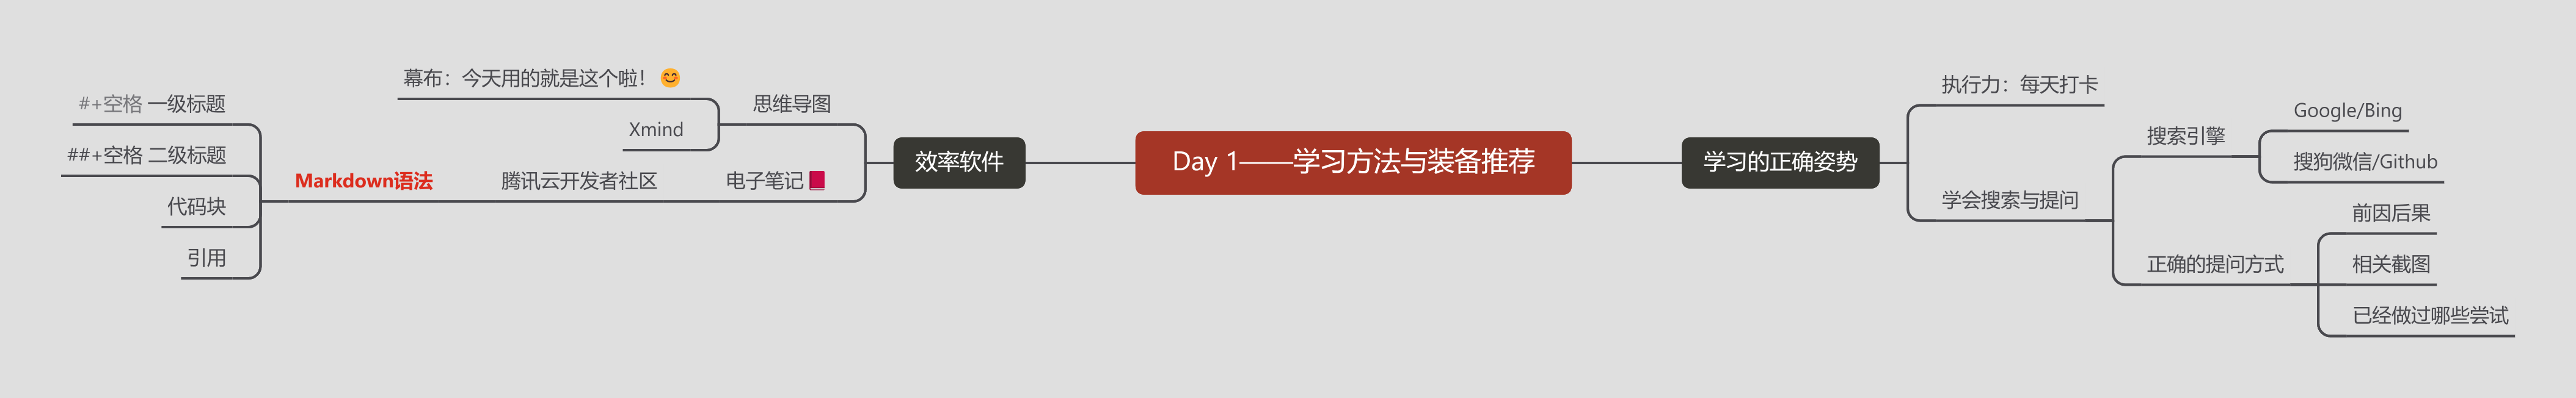
如何提高学习的效率?
工欲善其事必先利其器
提高效率的学习装备包括:
搜索引擎:Google/Bing、搜狗微信、搜狗知乎、Github
思维导图软件:幕布、Xmind
电子笔记:腾讯云开发者社区
在学习中遇到问题应该怎么办?
先搜索!!!!正确的搜索方式
小组合作:把问题发到群里和大家一起交流
请教老师:高效的提问方式:有前因后果+有截图+有自己已经进行过哪些尝试
下面贴一段代码练习Markdown语法:(最近学习的R语言作图——ggplot2包)
ggplot(data=iris)+
 geom_point(mapping=aes(x=Sepal.Length,y=Petal.Length))
以上是ggplot入门级绘图模板,也可以写成
ggplot(mpg,aes(x=displ,y=hwy))+geom_point()
ggplot(mpg,aes(displ,hwy))+geom_point()
此处使用的R语言内置数据mpg,对比两处代码,data=、mapping=可省略,geom函数可以直接写在同一行并用“+”连接,减少因为忘记写“+”和下一行缩进而导致的代码书写错误的发生
小Tips:引入代码块的反引号在键盘上的位置:数字1的左边!
https://blog.csdn.net/weixin_45331620/article/details/107680919
https://m.umu.cn/course/?groupId=6683634&sKey=b8f2a0fd757488bb5e1e60830a0967bc
原创声明:本文系作者授权腾讯云开发者社区发表,未经许可,不得转载。
如有侵权,请联系 cloudcommunity@tencent.com 删除。
原创声明:本文系作者授权腾讯云开发者社区发表,未经许可,不得转载。
如有侵权,请联系 cloudcommunity@tencent.com 删除。
评论
登录后参与评论
推荐阅读
腾讯云开发者
