
我是如何在流光中显示回程交易者返回的图形的?
我是如何在流光中显示回程交易者返回的图形的?
提问于 2021-12-07 00:19:51
我尝试使用python中的反交易库对股票数据进行回溯测试。我用这个简单的策略
class CrossOver(bt.SignalStrategy):
    def __init__(self):
        sma=bt.ind.SMA(period=50)
        price=self.data
        crossover=bt.ind.CrossOver(price,sma)
        self.signal_add(bt.SIGNAL_LONG,crossover)
然后我运行它,尝试绘制它,并在流光中显示。
cerebro=bt.Cerebro()
cerebro.addstrategy(CrossOver)
cerebro.adddata(data)
cerebro.run()
pl=cerebro.plot()
st.pyplot(pl)
但我无法看到流光中的图形。有人知道如何在流光中显示背投者的图表吗?提前谢谢。
回答 1
Stack Overflow用户
回答已采纳
发布于 2021-12-07 14:40:27
我对背交易者不太熟悉,所以我从他们的文档上拿了一个例子,说明如何创建一个情节。图中使用的数据可以从他们的github储存库下载。
该解决方案包含以下步骤:
- 确保我们使用的matplotlib后端不向用户显示绘图,因为我们希望在Streamlit应用程序中显示它,backtrader的plot()函数将显示该情节。这可以使用以下方法完成: matplotlib.use('Agg')
- 从backtrader的plot()函数中获取matplotlib图。这可以使用以下方法完成: 图= cerebro.plot()
- 以流光显示情节。这可以使用以下方法完成: St.pyplot(图)
合在一起:
import streamlit as st
import backtrader as bt
import matplotlib

# Use a backend that doesn't display the plot to the user
# we want only to display inside the Streamlit page
matplotlib.use('Agg')

# --- Code from the backtrader plot example
# data can be found in there github repo
class St(bt.Strategy):
    def __init__(self):
        self.sma = bt.indicators.SimpleMovingAverage(self.data)
data = bt.feeds.BacktraderCSVData(dataname='2005-2006-day-001.txt')
cerebro = bt.Cerebro()
cerebro.adddata(data)
cerebro.addstrategy(St)
cerebro.run()
figure = cerebro.plot()[0][0]

# show the plot in Streamlit
st.pyplot(figure)
输出:
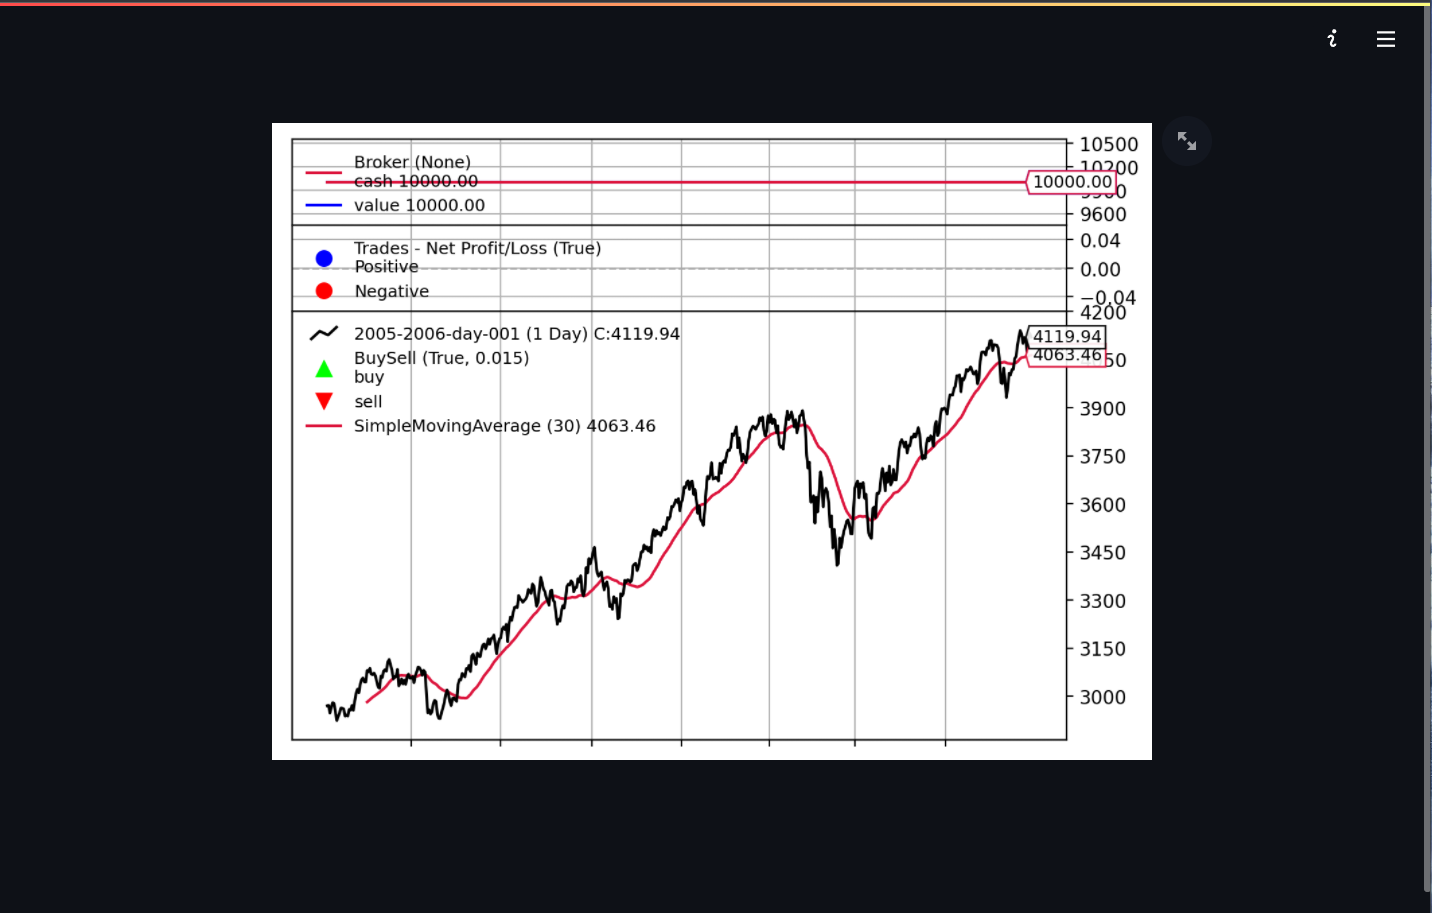
页面原文内容由Stack Overflow提供。腾讯云小微IT领域专用引擎提供翻译支持
原文链接:
https://stackoverflow.com/questions/70253527
复制相关文章
相似问题
腾讯云开发者
