
条形图开始于线状图
条形图开始于线状图
提问于 2021-12-09 16:17:10
我想要重叠一条线和一个条形图。最棘手的部分是,条形线不应该从0开始,而应该从线开始。到目前为止我试过
valuation <- c(100, 105, 120)
deposit <- c(0, 10, -15)
date <- as.Date(c('2010-11-1','2010-11-2','2010-11-3'))
df <- data.frame( valuation, deposit, date)ggplot(df) +
        geom_line(aes(x=date, y=valuation, group=1)) +
        geom_col(aes(x=date, y=deposit, fill=sign)) +
scale_fill_manual(values = c("positive"="green","negative"="red"))这产生了以下输出:https://i.ibb.co/pyT3bk2/1.png (抱歉,我需要10个名誉来发布图片)
我需要从直线的同一点开始的正值并向上上升,而负值也从行开始,但向下:https://i.ibb.co/gZBsXnp/2.png。
你知道这是否可能吗?非常感谢!!
回答 1
Stack Overflow用户
发布于 2021-12-09 16:41:15
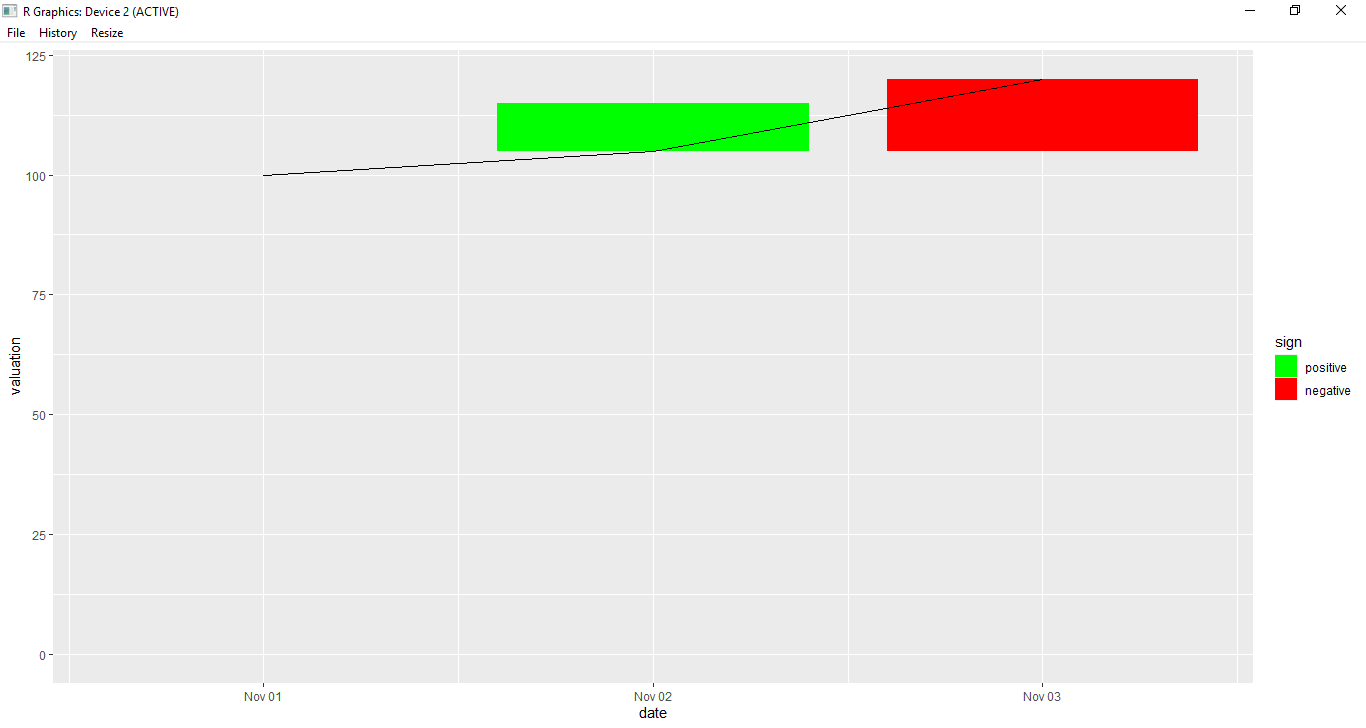
与geom_col不同,我建议在这里使用geom_rect:
ggplot(df) +
  geom_rect(aes(xmin=date-.4, xmax=date+.4, ymin=valuation, ymax=valuation+deposit,
                fill=ifelse(deposit>0, "positive", "negative"))) +
  geom_line(aes(x=date, y=valuation)) +
  ylim(0, 120) +
  scale_fill_manual(values = c("positive"="green","negative"="red"), name = "sign")
创建以下图表:
页面原文内容由Stack Overflow提供。腾讯云小微IT领域专用引擎提供翻译支持
原文链接:
https://stackoverflow.com/questions/70293196
复制相关文章
相似问题
腾讯云开发者
