
如何用Plotly制作一个简单的、多层次的Sankey图?
如何用Plotly制作一个简单的、多层次的Sankey图?
提问于 2021-12-09 16:53:01
我有一个像这样的DataFrame,我试图用Sankey图来描述它:
import pandas as pd

pd.DataFrame({
    'animal': ['dog', 'cat', 'cat', 'dog', 'cat'],
    'sex': ['male', 'female', 'female', 'male', 'male'],
    'status': ['wild', 'domesticated', 'domesticated', 'wild', 'domesticated'],
    'count': [8, 10, 11, 14, 6]
}) animal sex status count
0 dog male wild 8
1 cat female domesticated 10
2 cat female domesticated 11
3 dog male wild 14
4 cat male domesticated 6我试图遵循文档中的步骤,但我无法使它工作-我不知道哪些分支在哪里。下面是示例代码:
import plotly.graph_objects as go
fig = go.Figure(data=[go.Sankey(
node = dict(
pad = 15,
thickness = 20,
line = dict(color = "black", width = 0.5),
label = ["A1", "A2", "B1", "B2", "C1", "C2"],
color = "blue"
),
link = dict(
source = [0, 1, 0, 2, 3, 3],
target = [2, 3, 3, 4, 4, 5],
value = [8, 4, 2, 8, 4, 2]
))])
fig.update_layout(title_text="Basic Sankey Diagram", font_size=10)
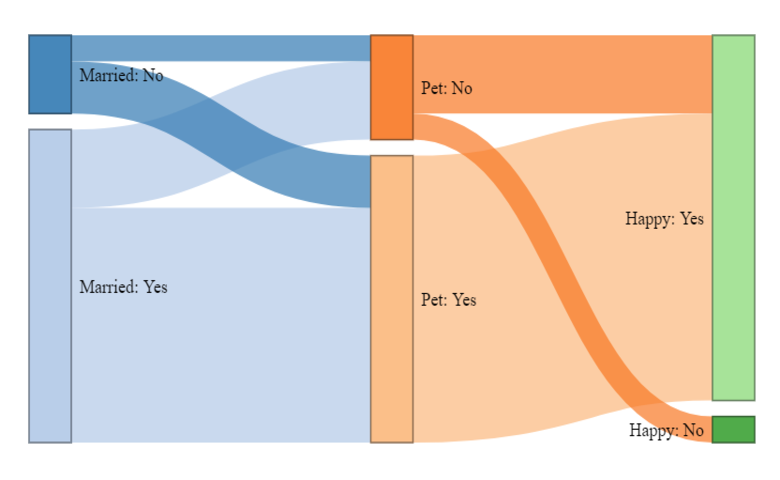
fig.show()以下是我想要达到的目标:
回答 1
Stack Overflow用户
回答已采纳
发布于 2021-12-09 21:22:02
您可以通过以下方式使用Plotly创建一个Sankey图:
import pandas as pd
import plotly.graph_objects as go

label_list = ['cat', 'dog', 'domesticated', 'female', 'male', 'wild']
# cat: 0, dog: 1, domesticated: 2, female: 3, male: 4, wild: 5
source = [0, 0, 1, 3, 4, 4]
target = [3, 4, 4, 2, 2, 5]
count = [21, 6, 22, 21, 6, 22]

fig = go.Figure(data=[go.Sankey(
    node = {"label": label_list},
    link = {"source": source, "target": target, "value": count}
    )])
fig.show()
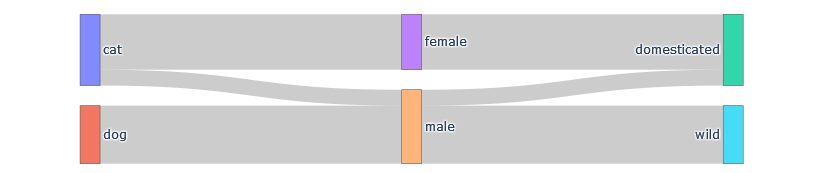
它是如何工作的:列表source、target和count的长度都是6,而Sankey图有6个箭头。source和target的元素是label_list的指标。源的第一个元素是0,意思是"cat“。目标的第一个要素是3,意思是“女性”。计数的第一个元素是21。因此,图中的第一个箭头从猫到女性,大小为21。相应地,列表的第二个元素--源、目标和计数--定义第二个箭头,等等。
您可能希望创建一个更大的Sankey图,如本例所示。手动定义源、目标和计数列表变得非常繁琐。下面是一个代码,它从您的格式的数据中创建这些列表。
import pandas as pd
import numpy as np

df = pd.DataFrame({
    'animal': ['dog', 'cat', 'cat', 'dog', 'cat'],
    'sex': ['male', 'female', 'female', 'male', 'male'],
    'status': ['wild', 'domesticated', 'domesticated', 'wild', 'domesticated'],
    'count': [8, 10, 11, 14, 6]
})

categories = ['animal', 'sex', 'status']

newDf = pd.DataFrame()
for i in range(len(categories)-1):
    tempDf = df[[categories[i],categories[i+1],'count']]
    tempDf.columns = ['source','target','count']
    newDf = pd.concat([newDf,tempDf])
newDf = newDf.groupby(['source','target']).agg({'count':'sum'}).reset_index()

label_list = list(np.unique(df[categories].values))
source = newDf['source'].apply(lambda x: label_list.index(x))
target = newDf['target'].apply(lambda x: label_list.index(x))
count = newDf['count']页面原文内容由Stack Overflow提供。腾讯云小微IT领域专用引擎提供翻译支持
原文链接:
https://stackoverflow.com/questions/70293723
复制相关文章
相似问题
腾讯云开发者
