
当缩放时,如何限制图表JS的悬停值,使其只从每个线条图中取一个值?
当缩放时,如何限制图表JS的悬停值,使其只从每个线条图中取一个值?
提问于 2022-01-11 17:50:06
我将chart.js 3.6.1与VueJS结合使用。以下是我遇到困难的特定数据的选项:
hover: {
mode: 'x',
intersect: false
},
scales: {
y: {
// not relevant
},
x: {
type: 'time',
min: minRangeDate.value,
max: maxRangeDate.value,
time: {
displayFormats: {
day: 'dd.MM.',
hour: 'HH:mm',
minute: 'HH:mm',
second: 'HH:mm:ss'
}
},
grid: {
display: true
},
ticks: {
color: 'white'
}
}
plugins: {
zoom: {
pan: {
enabled: true,
mode: 'x',
modifierKey: 'ctrl'
},
zoom: {
mode: 'x',
wheel: {
enabled: true,
speed: 0.2
},
pinch: {
enabled: true
}
},
limits: {
x: {
min: minRangeDate.value,
max: maxRangeDate.value,
minRange: 20000 // minimum zoom to seconds
}
}
}
}
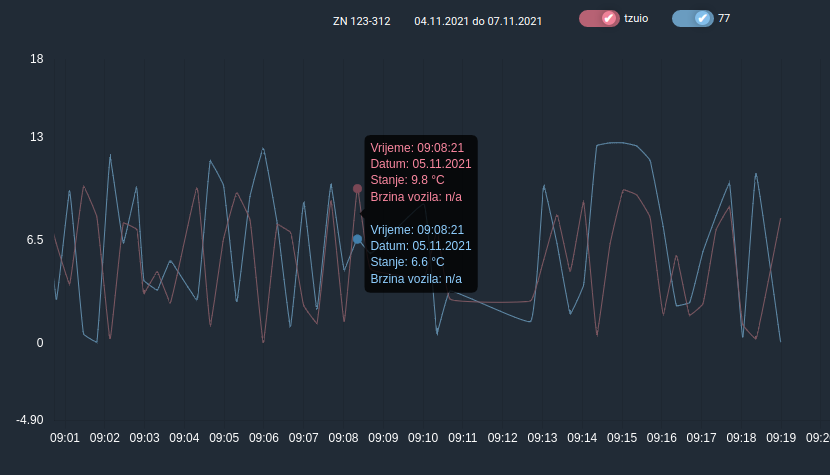
}当图形被放大时,一切看起来都很好,如下所示:
但是,当图形被放大时,悬停是选择不想要的多个点,下面的图如下:
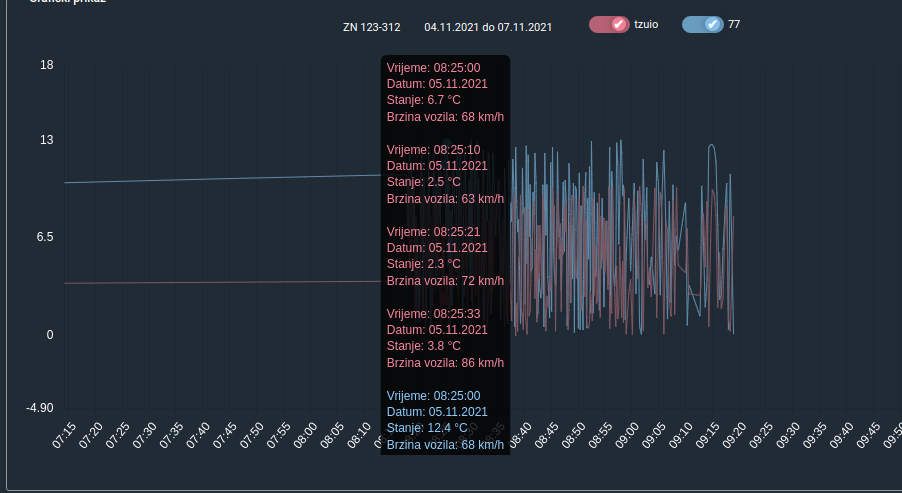
至于变焦,更多的点悬停是选择。知道怎么克服这个问题吗。我尝试过使用'point'和'nearest',但是在工具提示中只获得一个数据,因为它是默认行为。另外,使用'index'是不可能的,因为两个数据集并不总是相同的长度,并且根据索引比较值是不符合逻辑的,也是不理想的。
回答 1
Stack Overflow用户
发布于 2022-01-12 13:12:16
好的,这是我想出的解决方案,然后是ChartJS问题 on GitHub。我为工具提示做了一个过滤器,现在看起来是这样的:
    plugins: {
        tooltip: {
          mode: 'x',
          displayColors: false,
          intersect: false,
          filter: function (tooltipItem, currentIndex, tooltipItems) {
            // On zoomed out graph, hovering mouse picks a lot of data for x-axis and displays them all in tooltip.
            // This filter returns only first item from each dataSet from hover picked items passed
            // to tooltip, so it can be correctly displayed in tooltip for different line charts(datasets)
            return tooltipItems[currentIndex].datasetIndex !== tooltipItems[currentIndex - 1]?.datasetIndex
          },
         .
         .
         .
     }
悬停仍然会选择多个数据,但是工具提示只显示每个数据集的一个。
页面原文内容由Stack Overflow提供。腾讯云小微IT领域专用引擎提供翻译支持
原文链接:
https://stackoverflow.com/questions/70671270
复制相关文章
相似问题
腾讯云开发者
