
如何绘制轴不是相同形状的三维数据?
如何绘制轴不是相同形状的三维数据?
提问于 2022-01-12 08:53:13
我有这样的数据:
[
    [1, 2, 3, 4, 5],  #x
    [6, 7, 8, 9, 0],  #y
    [[1, 2, 3], [0, 2, 3], [1, 7, 3], [1, 2, 9], [1, 1, 3]]  #z is 3 values for each one value in x and y
]
如何在matplotlib中绘制/可视化这样的数据?
我尝试了以下几点,但都没有成功:
ax.scatter3D(data[0], data[1], data[2], c=data[2], cmap='Greens');
# and
ax.plot3D(data[0], data[1], data[2], 'gray')
它给我带来了错误:
# first line ==> ValueError: shape mismatch: objects cannot be broadcast to a single shape
# second line ==> ValueError: input operand has more dimensions than allowed by the axis remappingStack Overflow用户
回答已采纳
发布于 2022-01-12 09:26:23
您需要重新调整数据以展开x和y以匹配z。
使用纯python:
from itertools import product
a,b,c = zip(*(e for x,y,z in zip(*data) for e in product([x],[y],z)))

import matplotlib.pyplot as plt
fig = plt.figure()
ax = fig.add_subplot(projection='3d')

ax.scatter3D(a, b, c, c=c, cmap='Greens');
使用numpy:
import numpy as np
x, y = np.repeat(np.array(data[:2]), 3, axis=1)
z = data[2]

import matplotlib.pyplot as plt
fig = plt.figure()
ax = fig.add_subplot(projection='3d')
ax.scatter3D(x, y, z, c=z, cmap='Greens')
产出:
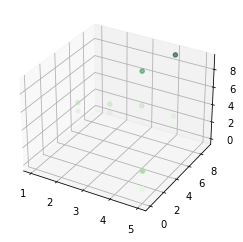
页面原文内容由Stack Overflow提供。腾讯云小微IT领域专用引擎提供翻译支持
原文链接:
https://stackoverflow.com/questions/70678651
复制相关文章
相似问题
腾讯云开发者
