
巧妙地组合子图索引
巧妙地组合子图索引
提问于 2022-01-12 13:35:55
我有这样的代码:
from datetime import timedelta, datetime
def plot_values(times, values, index_names):
    fig = make_subplots(rows=1, cols=2, start_cell="bottom-left")
    for i in range(len(times)):
        fig.add_trace(go.Scatter(x=times[i], y=values[i], name=index_names[i]),
                      row=1,
                      col=1)

        fig.add_trace(go.Scatter(x=list(range(len(times))), y=values[i], name=index_names[i]),
                      row=1,
                      col=2)
    fig = fig.update_traces(visible="legendonly")
    fig.show()


values = [[i for i in range(10)],
         [i + 1 for i in range(10)]]

times = [[datetime.now() + timedelta(minutes=i) for i in range(10)],
         [datetime.now() + timedelta(minutes=5) + timedelta(minutes=i) for i in range(10)]]

names = ["name " + str(i) for i in range(10)]

plot_values(times, values, names)
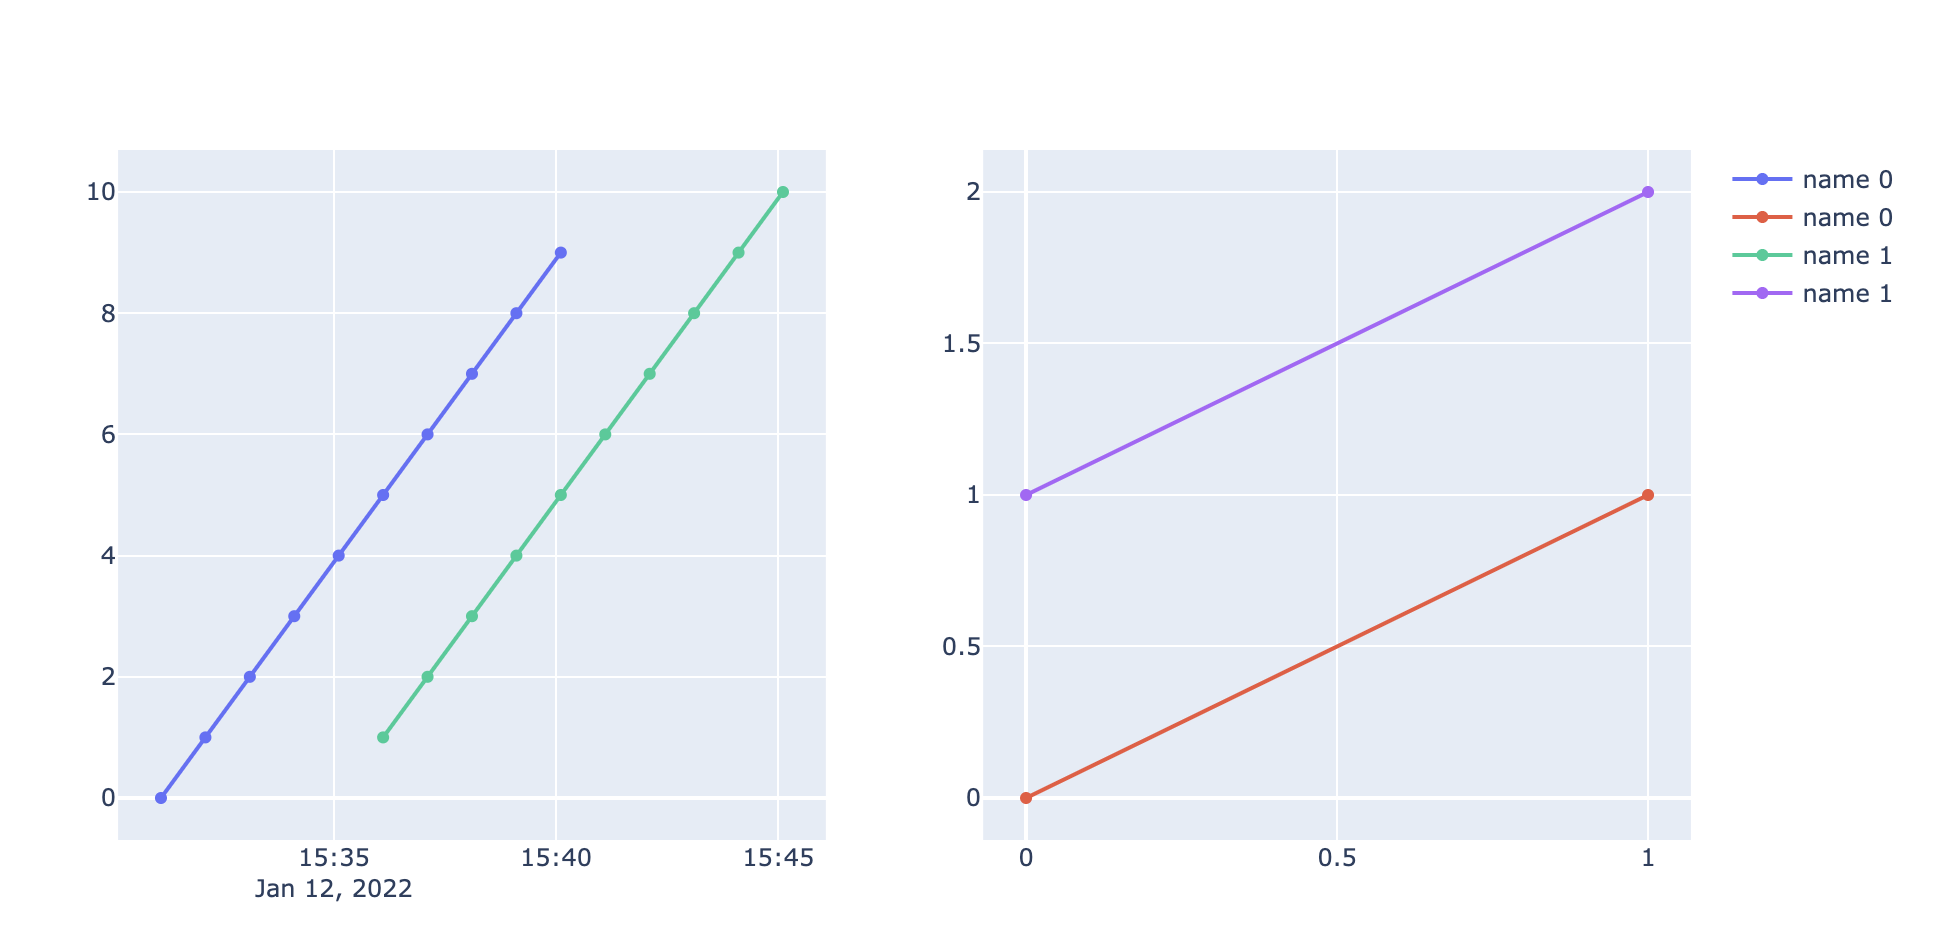
此代码复制索引。如何将两个子图组合成只有两个索引:name 0和name 1。
回答 1
Stack Overflow用户
发布于 2022-01-12 20:05:45
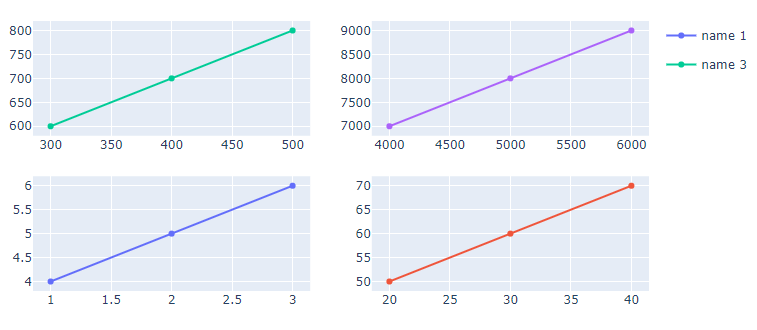
如果我正确地理解了您的请求,您就可以通过对每个跟踪的正确组合获得所需的功能:name, legendgroup and showlegend
第一幅图展示了一个来自subplots的例子
图1:原始设置
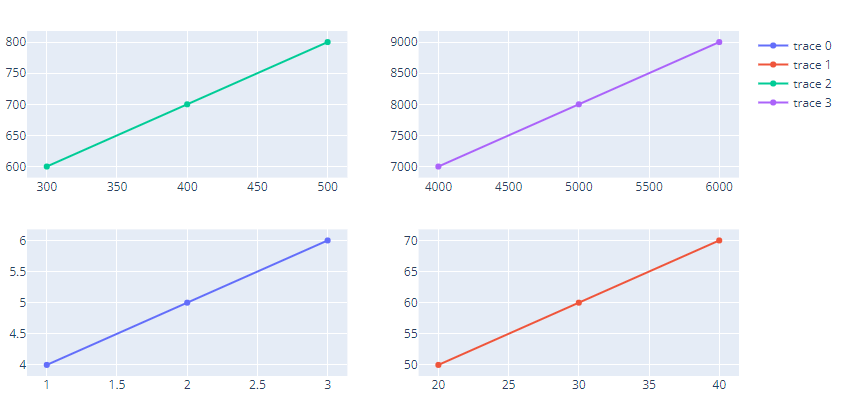
如果您使用下面的代码片段,您将得到以下情节:
图2:name, legendgroup and showlegend改变的传奇行为
在这里,单击图例中的name 1将同时切换trace 1和trace 2
图3:切换功能:
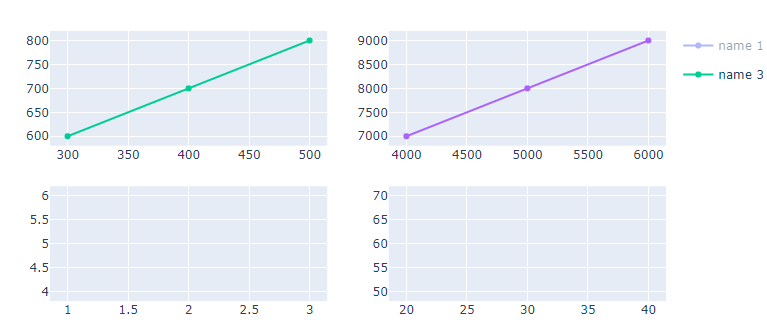
我希望这就是你要找的。如果不告诉我,请不要犹豫。
完整代码:
import plotly.graph_objects as go
from plotly.subplots import make_subplots

fig = make_subplots(rows=2, cols=2, start_cell="bottom-left")

fig.add_trace(go.Scatter(x=[1, 2, 3], y=[4, 5, 6],
                         name = 'name 1',legendgroup = 'name 1'),
              row=1, col=1)

fig.add_trace(go.Scatter(x=[20, 30, 40], y=[50, 60, 70],
                         name = 'name 2', legendgroup = 'name 1', showlegend = False),
              row=1, col=2)

fig.add_trace(go.Scatter(x=[300, 400, 500], y=[600, 700, 800],
                         name = 'name 3',legendgroup = 'name 3'),
              row=2, col=1)

fig.add_trace(go.Scatter(x=[4000, 5000, 6000], y=[7000, 8000, 9000],
                        name = 'name 4', legendgroup = 'name 3', showlegend = False),
              row=2, col=2)
f = fig.full_figure_for_development(warn=False)
fig.show()页面原文内容由Stack Overflow提供。腾讯云小微IT领域专用引擎提供翻译支持
原文链接:
https://stackoverflow.com/questions/70682505
复制相关文章
相似问题
腾讯云开发者
