
在x轴上显示mplfinance图表的最后日期
在x轴上显示mplfinance图表的最后日期
提问于 2022-01-12 14:36:08
我使用mplfinance创建了一个图表。我想在图表中显示x轴上最后一支蜡烛的日期。如何做到这一点?
回答 1
Stack Overflow用户
回答已采纳
发布于 2022-01-12 16:43:29
目前还没有使用mplfinance直接实现此操作的方法(不过,正在进行的增强将有所帮助;请参阅第428期和第313期。
但是,只要做一点工作,就可以通过以下解决办法来完成这一任务:
- 调用returnfig=True时设置
mpf.plot() - 从返回的x轴获取滴答。
- 自行格式化滴答(创建滴答标签)
- 最后再加一个勾。
- re-设置的蜱和滴答标签.
示例代码:
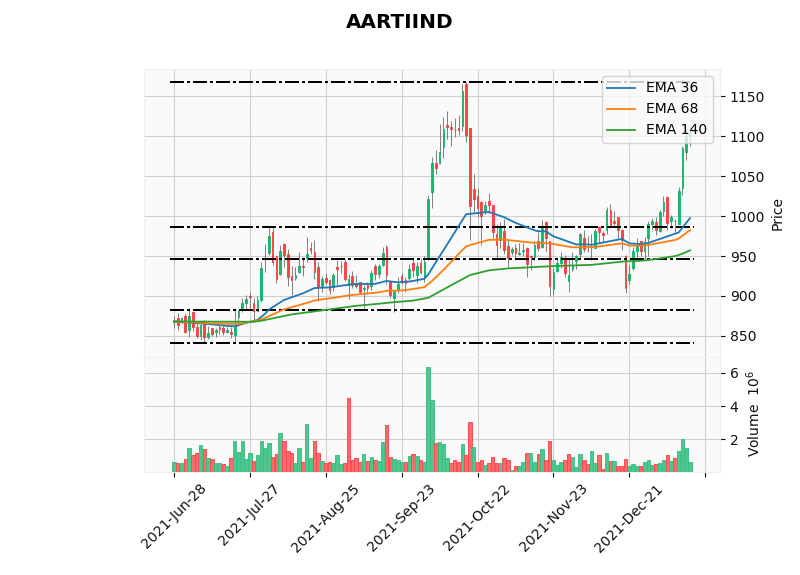
给定以下代码和情节:
fig, axlist = mpf.plot(df, type='candle',style='yahoo',volume=True,returnfig=True)
我们可以做以下工作:
fig, axlist = mpf.plot(df, type='candle',style='yahoo',volume=True,returnfig=True)
newxticks = []
newlabels = []
##format = '%Y-%b-%d'
format = '%b-%d'
# copy and format the existing xticks:
for xt in axlist[0].get_xticks():
p = int(xt)
if p >= 0 and p < len(df):
ts = df.index[p]
newxticks.append(p)
newlabels.append(ts.strftime(format))
# Here we create the final tick and tick label:
newxticks.append(len(df)-1)
newlabels.append(df.index[len(df)-1].strftime(format))
# set the xticks and labels with the new ticks and labels:
axlist[0].set_xticks(newxticks)
axlist[0].set_xticklabels(newlabels)
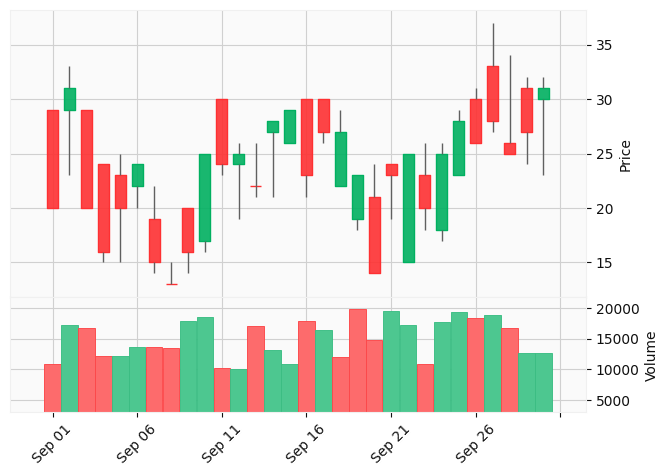
# now display the plot:
mpf.show()结果:

页面原文内容由Stack Overflow提供。腾讯云小微IT领域专用引擎提供翻译支持
原文链接:
https://stackoverflow.com/questions/70683432
复制相关文章
相似问题
腾讯云开发者
