
在SVG中保存Matplotlib图形时,文本位置会发生变化
在SVG中保存Matplotlib图形时,文本位置会发生变化
提问于 2022-01-18 16:33:38
Python3.9.0 Matplotlib 3.5.1
我画了一个表格,用this method合并了一个单元格。然而,MPL图中的输出看起来很好,但是如果我将它保存为SVG格式,那么它就变得奇怪了。此外,当我通过Inkscape将文件转换为EMF格式时,情况会变得更糟。如何将图形保存为SVG格式,如图形句柄中所示?(位图格式-jpg,png,..-没有问题)
可复制代码
import matplotlib as mpl
import matplotlib.pyplot as plt
import pandas as pd
import numpy as np

def mergecells(table, cells):
    '''
    Merge N matplotlib.Table cells

    Parameters
    -----------
    table: matplotlib.Table
        the table
    cells: list[set]
        list of sets od the table coordinates
        - example: [(0,1), (0,0), (0,2)]

    Notes
    ------
    https://stackoverflow.com/a/53819765/12684122
    '''
    cells_array = [np.asarray(c) for c in cells]
    h = np.array([cells_array[i+1][0] - cells_array[i][0] for i in range(len(cells_array) - 1)])
    v = np.array([cells_array[i+1][1] - cells_array[i][1] for i in range(len(cells_array) - 1)])

    # if it's a horizontal merge, all values for `h` are 0
    if not np.any(h):
        # sort by horizontal coord
        cells = np.array(sorted(list(cells), key=lambda v: v[1]))
        edges = ['BTL'] + ['BT' for i in range(len(cells) - 2)] + ['BTR']
    elif not np.any(v):
        cells = np.array(sorted(list(cells), key=lambda h: h[0]))
        edges = ['TRL'] + ['RL' for i in range(len(cells) - 2)] + ['BRL']
    else:
        raise ValueError("Only horizontal and vertical merges allowed")

    for cell, e in zip(cells, edges):
        table[cell[0], cell[1]].visible_edges = e

    txts = [table[cell[0], cell[1]].get_text() for cell in cells]
    tpos = [np.array(t.get_position()) for t in txts]

    # transpose the text of the left cell
    trans = (tpos[-1] - tpos[0])/2
    # didn't had to check for ha because I only want ha='center'
    txts[0].set_transform(mpl.transforms.Affine2D().translate(*trans))
    for txt in txts[1:]:
        txt.set_visible(False)

df = pd.DataFrame()
df['Animal'] = ['Cow', 'Bear']
df['Weight'] = [250, 450]
df['Favorite'] = ['Grass', 'Honey']
df['Least Favorite'] = ['Meat', 'Leaves']

fig = plt.figure(figsize=(9,2))
ax=fig.gca()
ax.axis('off')
r,c = df.shape

# plot the real table
table = ax.table(cellText=np.vstack([df.columns, df.values]),
                 cellColours=[['none']*c]*(r+1),
                 bbox=[0, 0, 1, 1],
                 cellLoc="center")

# need to draw here so the text positions are calculated
fig.canvas.draw()

mergecells(table, [(0,0),(1,0),(2,0)])

fig.savefig("svgoutput.svg")
plt.show()
图像显示在MPL图形句柄
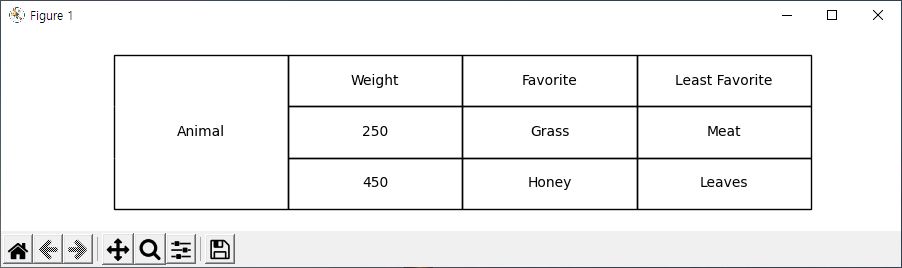
图像显示在保存的SVG文件中
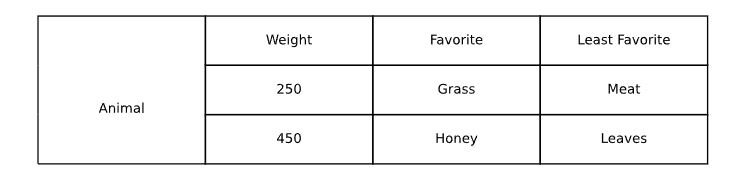
您可以看到合并后的单元格(“动物”)中的文本正在下降。虽然我没有附加EMF文件,但它继续下去,甚至一些文本消失了。
回答 1
Stack Overflow用户
发布于 2022-01-19 10:25:03
在绘图之前设置后端以解决问题。
import matplotlib as mpl

# This line must comes before plotting a figure
mpl.use("SVG")页面原文内容由Stack Overflow提供。腾讯云小微IT领域专用引擎提供翻译支持
原文链接:
https://stackoverflow.com/questions/70759115
复制相关文章
相似问题
腾讯云开发者
