
ChartJS 2.7.3重叠叠加条形图
ChartJS 2.7.3重叠叠加条形图
提问于 2022-01-19 13:28:18
我试图创建一个条形图,其中有两个重叠的条,另一个将被堆叠。以下是我正在努力实现的目标:
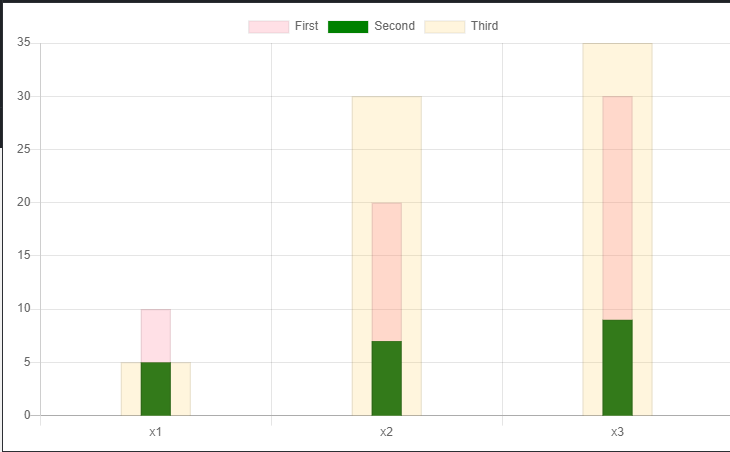
我能够根据我找到的示例创建以下内容,但这个例子的问题是,在x1中,堆叠栏应该值15,因为“第一个”值为10,“第二个”值为5,但现在这些值也是重叠的。
这里有一个Fiddle:https://jsfiddle.net/f1ret02b/
var data = {
  labels: ["x1", "x2", "x3"],
  datasets: [{
    label: "First",
    backgroundColor: 'rgba(255, 99, 132, 0.2)',
    borderWidth: 1,
    data: [10, 20, 30],
    xAxisID: "bar-x-axis1",
    //stack: 'stack 0'
  },
  {
    label: "Second",
    backgroundColor: 'green',
    borderWidth: 1,
    data: [5, 7, 9],
    xAxisID: "bar-x-axis1",
    //stack: 'stack 0'

  },
  {
    label: "Third",
    backgroundColor: 'rgba(255, 206, 86, 0.2)',
    borderWidth: 1,
    data: [5, 30, 35],
    xAxisID: "bar-x-axis2",
  }]
};

var options = {
  scales: {
    xAxes: [{
      stacked: true,
      id: "bar-x-axis1",
      barThickness: 30,
    }, {
      display: false,
      stacked: true,
      id: "bar-x-axis2",
      barThickness: 70,
      // these are needed because the bar controller defaults set only the first x axis properties
      type: 'category',
      categoryPercentage: 0.8,
      barPercentage: 0.9,
      gridLines: {
        offsetGridLines: true
      },
      offset: true
    }],
    yAxes: [
      {
      stacked: false,
      ticks: {
        beginAtZero: true
      },
    }]

  }
};

var ctx = document.getElementById("myChart").getContext("2d");
var myBarChart = new Chart(ctx, {
  type: 'bar',
  data: data,
  options: options
});
有人知道chartJS是否有这个可能吗?
回答 1
Stack Overflow用户
发布于 2022-01-19 13:48:41
所以我自己解决了这个问题。您需要将yAxisID设置为每个数据集,然后定义哪些将被堆叠,哪些不会堆叠。
下面是代码:
var data = {
  labels: ["x1", "x2", "x3"],
  datasets: [{
    label: "First",
    backgroundColor: 'rgba(255, 99, 132, 0.2)',
    borderWidth: 1,
    data: [10, 20, 30],
    xAxisID: "bar-x-axis1",
    yAxisID: "bar-y-axis1"
  },
  {
    label: "Second",
    backgroundColor: 'green',
    borderWidth: 1,
    data: [5, 7, 9],
    xAxisID: "bar-x-axis1",
    yAxisID: "bar-y-axis1"
  },
  {
    label: "Third",
    backgroundColor: 'rgba(255, 206, 86, 0.2)',
    borderWidth: 1,
    data: [5, 30, 35],
    xAxisID: "bar-x-axis2",
    yAxisID: "bar-y-axis2"
  }]
};

var options = {
  scales: {
    xAxes: [{
      stacked: true,
      id: "bar-x-axis1",
      barThickness: 30,
    }, {
      display: false,
      stacked: true,
      id: "bar-x-axis2",
      barThickness: 70,
      // these are needed because the bar controller defaults set only the first x axis properties
      type: 'category',
      categoryPercentage: 0.8,
      barPercentage: 0.9,
      gridLines: {
        offsetGridLines: true
      },
      offset: true
    }],
    yAxes: [
    {
        id: "bar-y-axis1",
      stacked: true,
      ticks: {
        beginAtZero: true,
        min: 0,
        max: 40,
                autoSkip: false,
      }
    },
      {
        id: "bar-y-axis2",
        stacked: false,
        ticks: {
          beginAtZero: true,
          min: 0,
          max: 40,
                    autoSkip: false,
          display: false
        },
        gridLines: {
            display: false
        }
    }]

  }
};

var ctx = document.getElementById("myChart").getContext("2d");
var myBarChart = new Chart(ctx, {
  type: 'bar',
  data: data,
  options: options
});和一个Fiddle:https://jsfiddle.net/f1ret02b/2/
页面原文内容由Stack Overflow提供。腾讯云小微IT领域专用引擎提供翻译支持
原文链接:
https://stackoverflow.com/questions/70771444
复制相关文章
相似问题
腾讯云开发者
