
如何垂直分割图像?
如何垂直分割图像?
提问于 2022-01-26 07:54:23
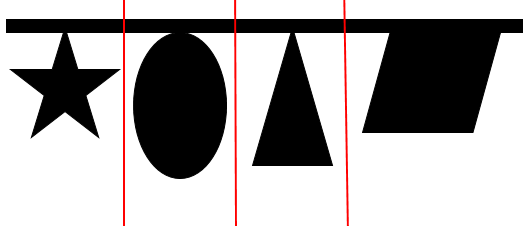
我有这样的图像:

所有对象都通过一条水平线连接起来。所有的符号都有不同的宽度,所以不能使用固定的宽度或分割点来提取所有形状,就像我们分割数组时一样。
在这个图像中,有4个符号,但在其他一些情况下,它可能大于或小于4个,所以这里我也不能执行“4个符号,所以将输入的图像宽度垂直地划分为4个不同的宽度。所以我不知道如何提取图像可能具有的任何符号,比如我想要的输出。
。
你们能帮我吗?
至
回答 2
Stack Overflow用户
回答已采纳
发布于 2022-01-26 12:23:13
import urllib.request
from PIL import Image
from scipy import signal
import numpy as np
from matplotlib import pyplot as plt

urllib.request.urlretrieve(
  'https://i.stack.imgur.com/iMKIP.jpg',
   "img.png")
img = Image.open("img.png")
img.show()

arr = (np.array(img)<(255)/2) #I'm considering black parts as filled
plt.imshow(arr)

plt.subplot(211)
plt.imshow(arr, aspect="auto")
plt.subplot(212)
plt.plot(arr.sum(axis=0))
plt.xlim(0,arr.shape[1])
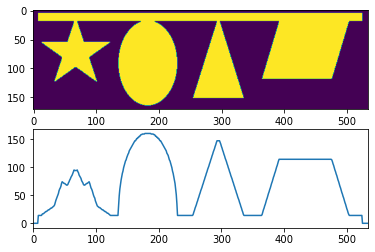
然后,为了找到当地的min:
x_lines = signal.find_peaks(-arr.sum(axis=0))[0]

plt.imshow(arr, aspect="auto")
plt.vlines(x_lines, 0, arr.shape[0], color="r")

最后,如果我们考虑一个阈值(例如,在列中填充了50个像素):
threshold = 50

x_lines = signal.find_peaks(-arr.sum(axis=0))[0]
x_lines = x_lines[arr.sum(axis=0)[x_lines]<threshold]

plt.imshow(arr, aspect="auto")
plt.vlines(x_lines, 0, arr.shape[0], color="r")

编辑:
要拆分您需要的图片
for i, x in enumerate(x_lines):
    if i==0:
        plt.imshow(arr[:,:x_lines[i]], cmap="Greys")
        plt.savefig("fig%i"%i)
        plt.show()
    else:
        plt.imshow(arr[:,x_lines[i-1]:x_lines[i]], cmap="Greys")
        plt.savefig("fig%i"%i)
        plt.show()

plt.imshow(arr[:,x_lines[i]:], cmap="Greys")
plt.savefig("fig%i"%(i+1))
plt.show()Stack Overflow用户
发布于 2022-01-26 09:47:07
让我在matlab把它给你。代码可以很容易地推广到python。
% read the image and binarize it
img = imread('https://i.stack.imgur.com/iMKIP.jpg') > 128;
% compute the sum of black pixels, per column
vs = sum(1 - img, 1);
% compute the minimal number of black pixels (ignoring the completely white boundaries)
% this will tell you at which columns you may "cut" the image
thr = min(vs(vs>0));
% find the indices of the columns that do not contain any "object"
sep = find(vs <= the);
% find where objects starts (col indices)
loc = diff(sep) > 1;
% select the column indices at the middle, between objects
col = round(0.5 * (sep(loc(1:end-1)+1) + sep(loc(2:end))));

% visualize the result
imshow(img);
hold on;
plot([col;col], [0*col;size(img,1)*ones(1,numel(col))], 'r', 'LineWidth', 2);
这是输出:

使用
col =

130 243 351页面原文内容由Stack Overflow提供。腾讯云小微IT领域专用引擎提供翻译支持
原文链接:
https://stackoverflow.com/questions/70860087
复制相关文章
相似问题
腾讯云开发者
