
绘制世界地图上的空间多边形并提取其中的坐标(R)
绘制世界地图上的空间多边形并提取其中的坐标(R)
提问于 2022-01-29 20:05:23
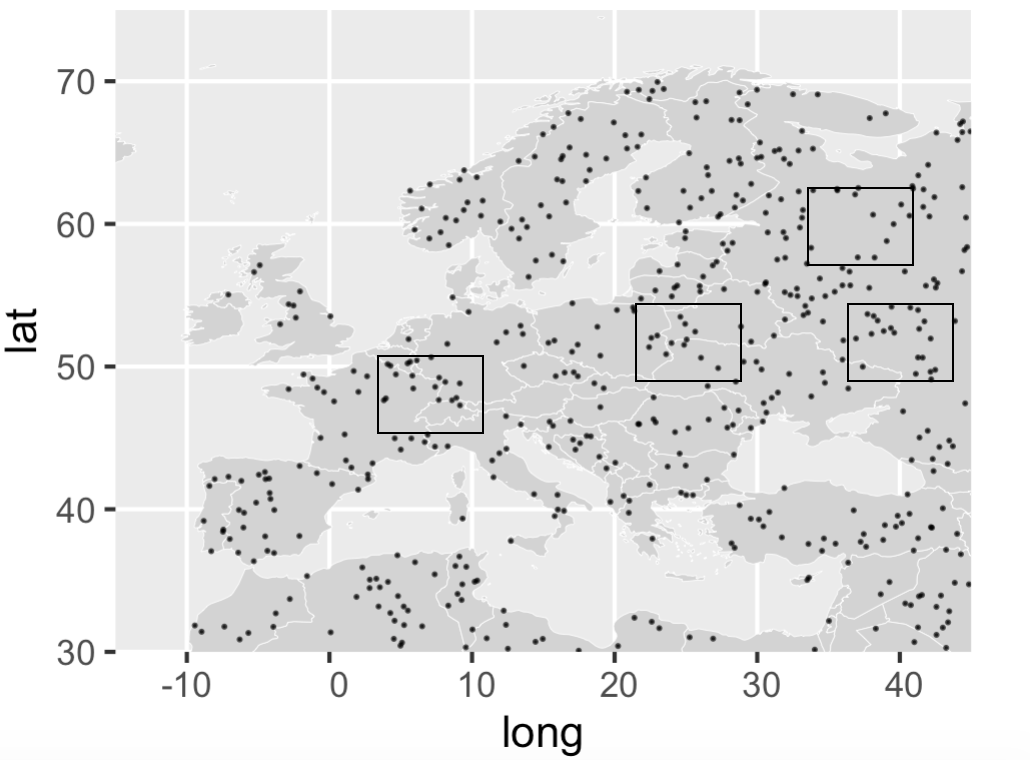
给定一组具有全球分布的坐标,我想在世界地图上绘制一个多边形(最好是一个矩形),然后提取出这些图中的所有坐标。多边形的位置将根据点密度手动放置,但它们的大小必须保持不变。
在这里,我提供了一个在欧洲随机分布的点的最小可重现性示例。我还添加了一个定向图像,希望它有助于理解所需的输出。首先,我想在地图上添加多边形,然后提取该区域内的所有点。谢谢你提前提供任何可能的帮助。
#Load libraries
library(rgdal) #v1.5-28
library(rgeos) #v.0.5-9
library(ggplot2) # 3.3.5
library(rworldmap) #plot worldmap v.1.3-6
library(dplyr) #v.1.0.7

#Create dataframe of coordinates that fall in Europe
coord <- data.frame(cbind(runif(1000,-15,45),runif(1000,30,75)))
colnames(coord) <- c("long","lat")

#Exlude ocean points following this post
#https://gis.stackexchange.com/questions/181586/remove-points-which-are-out-of-shapefile-or-raster-extent
URL <- "http://www.naturalearthdata.com/http//www.naturalearthdata.com/download/110m/physical/ne_110m_ocean.zip"
fil <- basename(URL)
if (!file.exists(fil)) download.file(URL, fil)
fils <- unzip(fil)
oceans <- readOGR(grep("shp$", fils, value=TRUE), "ne_110m_ocean",
                  stringsAsFactors=FALSE, verbose=FALSE)


europe_coord <- data.frame(long = coord$long,
                          lat = coord$lat)

coordinates(europe_coord) <- ~long+lat
proj4string(europe_coord) <- CRS(proj4string(oceans))

ocean_points <- over(europe_coord, oceans)

#Add ocean points to dataset
coord$ocean <- ocean_points$featurecla
#Exlude ocean points
europe_land <- coord %>% filter(is.na(ocean))

#Load worldmap
world <- map_data("world")
#Plot europe spatial data
ggplot() + geom_map(data = world, map = world,
                    aes(long, lat, map_id = region), color = "white",
                    fill = "lightgray", size = 0.1) +
    geom_point(data = europe_land,aes(long, lat),
               alpha = 0.7, size = 0.05) + ylim(0,70) +
    coord_sf(xlim = c(-15, 45), ylim = c(30, 75), expand = FALSE)
回答 1
Stack Overflow用户
回答已采纳
发布于 2022-01-29 22:57:41
您可以将对象转换为sf,然后使用st_intersection提取给定多边形的点。首先,我创建一个边界框(在这里,您将输入您想要的多边形范围的坐标)。然后,我将europe_land转换为sf对象。然后,我使用st_intersection只返回多边形内的点。
library(sf)

bb <-
  c(
    "xmin" = 5.005,
    "xmax" = 12.005,
    "ymin" = 45.008,
    "ymax" = 51.005
  ) %>%
  sf::st_bbox() %>%
  sf::st_as_sfc() %>%
  sf::st_as_sf(crs = 4326) %>%
  sf::st_transform(crs = 4326)

europe_land_sf <- europe_land %>%
  st_as_sf(coords = c("long", "lat"), dim = "XY") %>%
  st_set_crs(4326)

bb_extraction <- st_intersection(bb, europe_land_sf)
输出
head(bb_extraction)

Simple feature collection with 6 features and 1 field
Geometry type: POINT
Dimension:     XY
Bounding box:  xmin: 7.136638 ymin: 45.69418 xmax: 11.78427 ymax: 49.51203
Geodetic CRS:  WGS 84
  ocean                         x
1  <NA> POINT (7.136638 46.90647)
2  <NA> POINT (9.035649 45.81661)
3  <NA> POINT (10.69865 45.91507)
4  <NA> POINT (11.78427 48.55559)
5  <NA> POINT (10.90349 45.69418)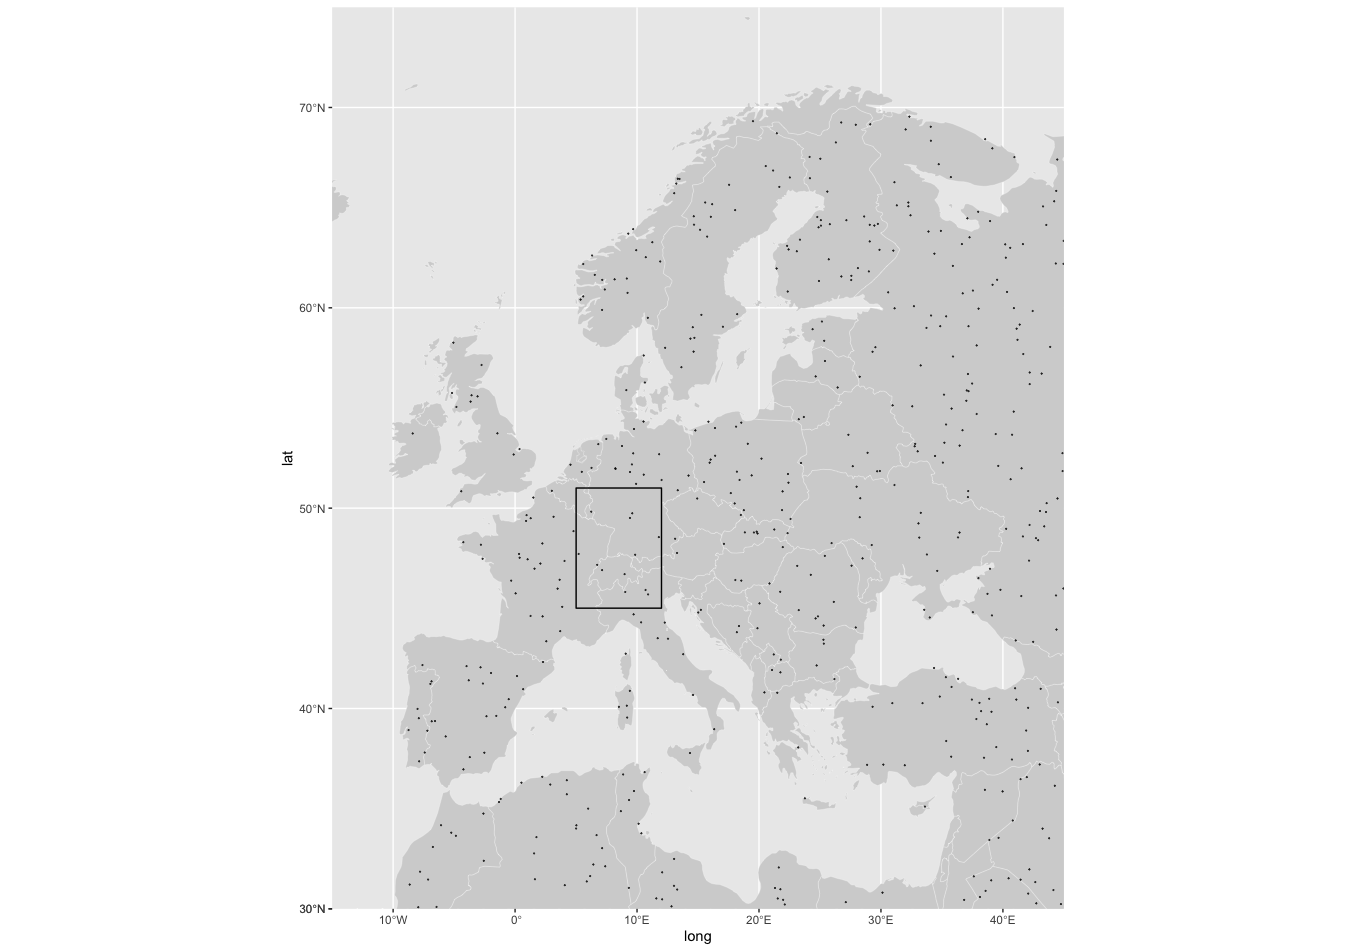
6 <NA> POINT (9.417477 49.51203)为了进行绘图,一旦创建了sf对象,就可以在现有代码中使用geom_sf将多边形添加到世界地图中。
ggplot() +
  geom_map(
    data = world,
    map = world,
    aes(long, lat, map_id = region),
    color = "white",
    fill = "lightgray",
    size = 0.1
  ) +
  geom_point(data = europe_land,
             aes(long, lat),
             alpha = 0.7,
             size = 0.05) + ylim(0, 70) +
  geom_sf(data = bb, colour = "black", fill = NA) +
  coord_sf(xlim = c(-15, 45),
           ylim = c(30, 75),
           expand = FALSE)
输出
页面原文内容由Stack Overflow提供。腾讯云小微IT领域专用引擎提供翻译支持
原文链接:
https://stackoverflow.com/questions/70909281
复制相关文章
相似问题
腾讯云开发者
