
更新的iPython:使您自己的Mandelbrot图像不出现
更新的iPython:使您自己的Mandelbrot图像不出现
提问于 2022-01-30 10:30:39
这是我的第一个问题,所以我不确定格式是否正确。我正在读这本书,由塔里克拉希德使用iPython (朱庇特笔记本)制作你自己的曼德尔布罗特。自本书编写以来,iPython似乎已经发生了变化,因此,根据我对Python的有限理解,我一直在调整书中的代码。但是,该图像目前没有显示。(只有一张空白的图表。)当前我收到的错误是:“AxesImage”对象没有属性“插值”
这是我的密码:
import numpy
def mandel(c, maxiter):
    z = complex(0,0)
    for iteration in range(maxiter):
        z = (z*z) + c
        if abs(z) > 4:
            break
            pass
        pass
    return iteration
xvalues = numpy.linspace(-2.25, 0.75, 1000)
yvalues = numpy.linspace(-1.5, 1.5, 1000)
xlen = len(xvalues)
ylen = len(yvalues)
atlas = numpy.empty((xlen,ylen))
for ix in range(xlen):
    for iy in range(ylen):
        cx = xvalues[ix]
        cy = yvalues[iy]
        c = complex(cx, cy)
        atlas[ix,iy] = mandel(c,40)
        pass
    pass
import matplotlib.pyplot as plt
fig= plt.figure(figsize=(18,18))
plt.imshow(atlas.T, interpolaton="nearest")
我该怎么解决这个问题?
AttributeError                            Traceback (most recent call last)
~\AppData\Local\Temp/ipykernel_21768/3787280441.py in <module>
     24 import matplotlib.pyplot as plt
     25 fig= plt.figure(figsize=(18,18))
---> 26 plt.imshow(atlas.T, interpolaton="nearest")

~\anaconda3\lib\site-packages\matplotlib\pyplot.py in imshow(X, cmap, norm, aspect, interpolation, alpha, vmin, vmax, origin, extent, filternorm, filterrad, resample, url, data, **kwargs)
   2901         filternorm=True, filterrad=4.0, resample=None, url=None,
   2902         data=None, **kwargs):
-> 2903     __ret = gca().imshow(
   2904         X, cmap=cmap, norm=norm, aspect=aspect,
   2905         interpolation=interpolation, alpha=alpha, vmin=vmin,

~\anaconda3\lib\site-packages\matplotlib\__init__.py in inner(ax, data, *args, **kwargs)
   1359     def inner(ax, *args, data=None, **kwargs):
   1360         if data is None:
-> 1361             return func(ax, *map(sanitize_sequence, args), **kwargs)
   1362
   1363         bound = new_sig.bind(ax, *args, **kwargs)

~\anaconda3\lib\site-packages\matplotlib\axes\_axes.py in imshow(self, X, cmap, norm, aspect, interpolation, alpha, vmin, vmax, origin, extent, filternorm, filterrad, resample, url, **kwargs)
   5603             aspect = rcParams['image.aspect']
   5604         self.set_aspect(aspect)
-> 5605         im = mimage.AxesImage(self, cmap, norm, interpolation, origin, extent,
   5606                               filternorm=filternorm, filterrad=filterrad,
   5607                               resample=resample, **kwargs)

~\anaconda3\lib\site-packages\matplotlib\image.py in __init__(self, ax, cmap, norm, interpolation, origin, extent, filternorm, filterrad, resample, **kwargs)
    898         self._extent = extent
    899
--> 900         super().__init__(
    901             ax,
    902             cmap=cmap,

~\anaconda3\lib\site-packages\matplotlib\image.py in __init__(self, ax, cmap, norm, interpolation, origin, filternorm, filterrad, resample, **kwargs)
    255         self._imcache = None
    256
--> 257         self.update(kwargs)
    258
    259     def __getstate__(self):

~\anaconda3\lib\site-packages\matplotlib\artist.py in update(self, props)
   1060                     func = getattr(self, f"set_{k}", None)
   1061                     if not callable(func):
-> 1062                         raise AttributeError(f"{type(self).__name__!r} object "
   1063                                              f"has no property {k!r}")
   1064                     ret.append(func(v))

AttributeError: 'AxesImage' object has no property 'interpolaton'回答 1
Stack Overflow用户
发布于 2022-01-30 10:41:59
你犯了个错误:
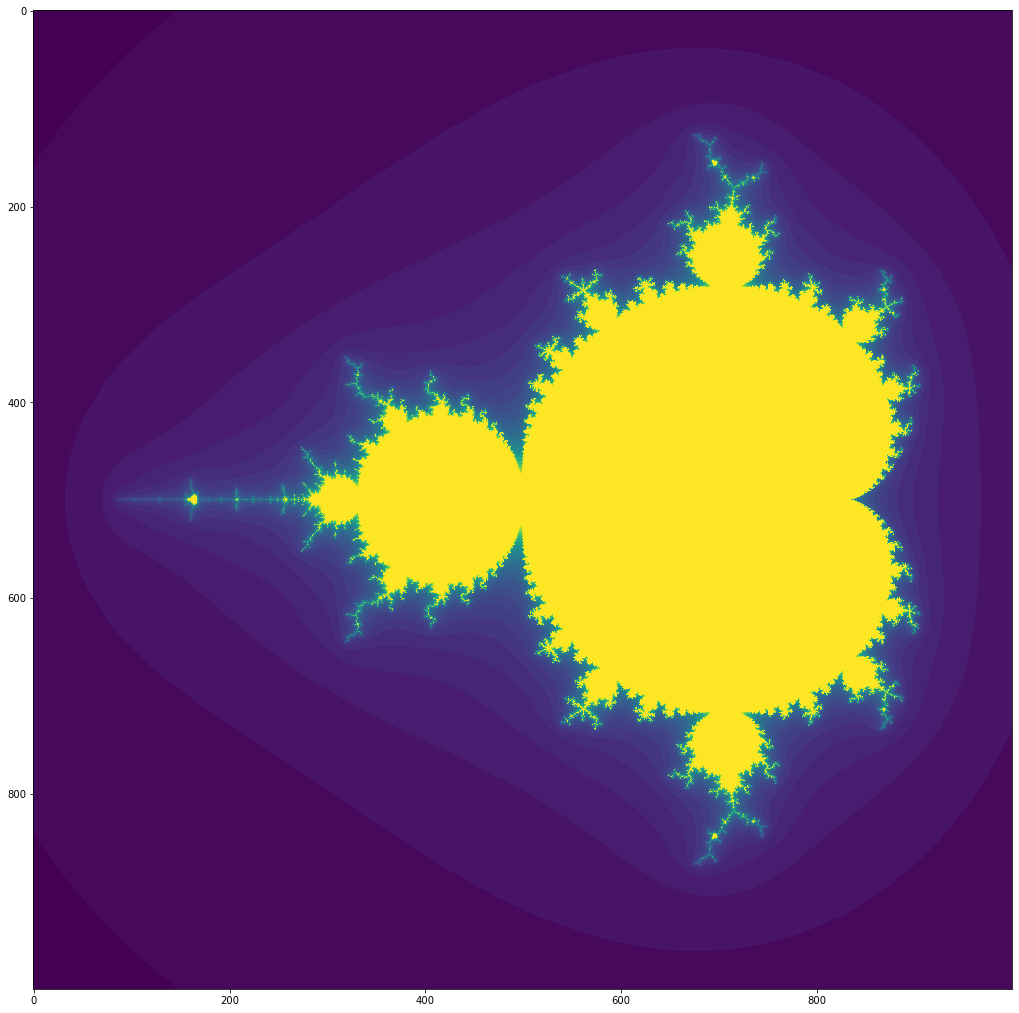
plt.imshow(atlas.T, interpolaton="nearest")需要的是
plt.imshow(atlas.T, interpolation="nearest")和
import numpy
def mandel(c, maxiter):
    z = complex(0,0)
    for iteration in range(maxiter):
        z = (z*z) + c
        if abs(z) > 4:
            break
            pass
        pass
    return iteration
xvalues = numpy.linspace(-2.25, 0.75, 1000)
yvalues = numpy.linspace(-1.5, 1.5, 1000)
xlen = len(xvalues)
ylen = len(yvalues)
atlas = numpy.empty((xlen,ylen))
for ix in range(xlen):
    for iy in range(ylen):
        cx = xvalues[ix]
        cy = yvalues[iy]
        c = complex(cx, cy)
        atlas[ix,iy] = mandel(c,40)
        pass
    pass
import matplotlib.pyplot as plt
fig= plt.figure(figsize=(18,18))
plt.imshow(atlas.T, interpolation="nearest")
给予:
页面原文内容由Stack Overflow提供。腾讯云小微IT领域专用引擎提供翻译支持
原文链接:
https://stackoverflow.com/questions/70913795
复制相关文章
相似问题
腾讯云开发者
