
将百分比添加到每个组的子组likert-scale Python
将百分比添加到每个组的子组likert-scale Python
提问于 2022-02-03 17:41:13
我想知道是否有可能在MatPlotLib的利克特标尺中包括每个亚组的百分比?任何帮助都将不胜感激!
Python代码:
from numpy.core import numeric
import plot_likert
import pandas as pd
# define my selections
myscale1 = \
['Very unlikely',
'Unlikely',
'Neutral',
'Likely',
'Very likely']
# create a likert plot
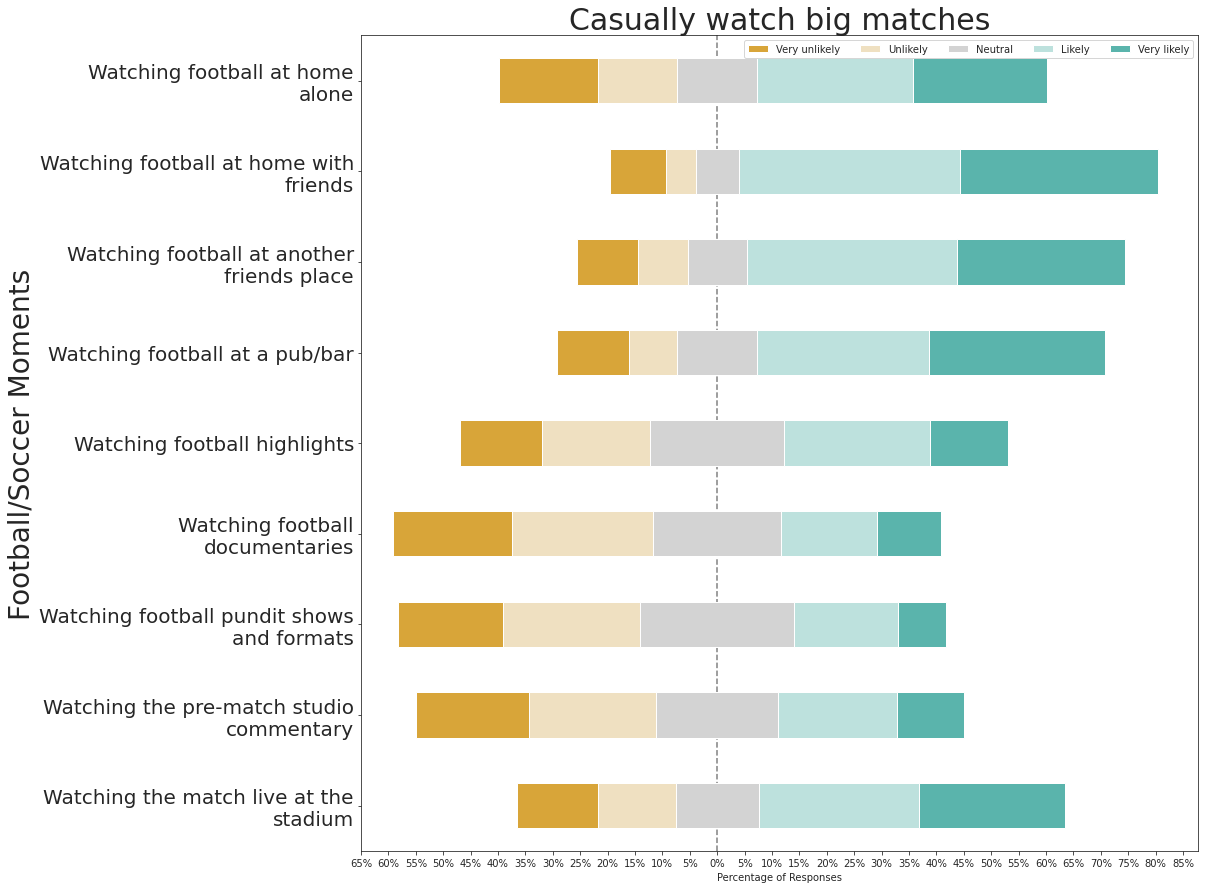
ax1 = plot_likert.plot_likert(GenZ, myscale1, plot_percentage=True, figsize=(15,15), colors=plot_likert.colors.likert5)
ax1.set_title(('Casually watch big matches'), fontsize=30)
ax1.set_ylabel('Football/Soccer Moments',fontdict={'fontsize':28})
ax1.tick_params(axis='y', labelsize=20)
ax1.legend(loc="upper middle", ncol=5)
回答 2
Stack Overflow用户
回答已采纳
发布于 2022-02-03 22:34:50
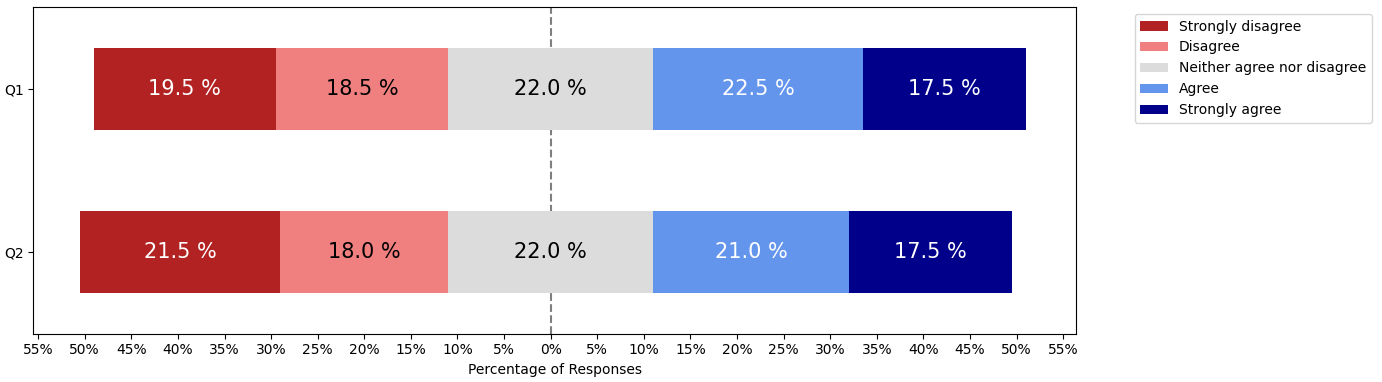
下面的示例代码假设您使用的是nmalkin/阴谋-likert。它会产生水平条。有6组酒吧。首先,一个虚拟不可见组来创建正确的间距。然后每组鳞片中的一组(每组都有固定的颜色)。
您可以使用matplotlib的新bar_label来标记条形图(bar_label是新的,因为matplotlib 3.4,所以可能需要升级):
import plot_likert
import matplotlib.pyplot as plt
import pandas as pd
import numpy as np

rng = np.random.default_rng(seed=42)
data = pd.DataFrame(rng.choice(plot_likert.scales.agree, (200, 2)), columns=['Q1', 'Q2'])

ax = plot_likert.plot_likert(data, plot_likert.scales.agree, plot_percentage=True, figsize=(14, 4))
for bars, color in zip(ax.containers[1:], ['white'] + ['black'] * 2 + ['white'] * 2):
    ax.bar_label(bars, label_type='center', fmt='%.1f %%', color=color, fontsize=15)

plt.tight_layout()
plt.show()
Stack Overflow用户
发布于 2022-02-04 15:00:48
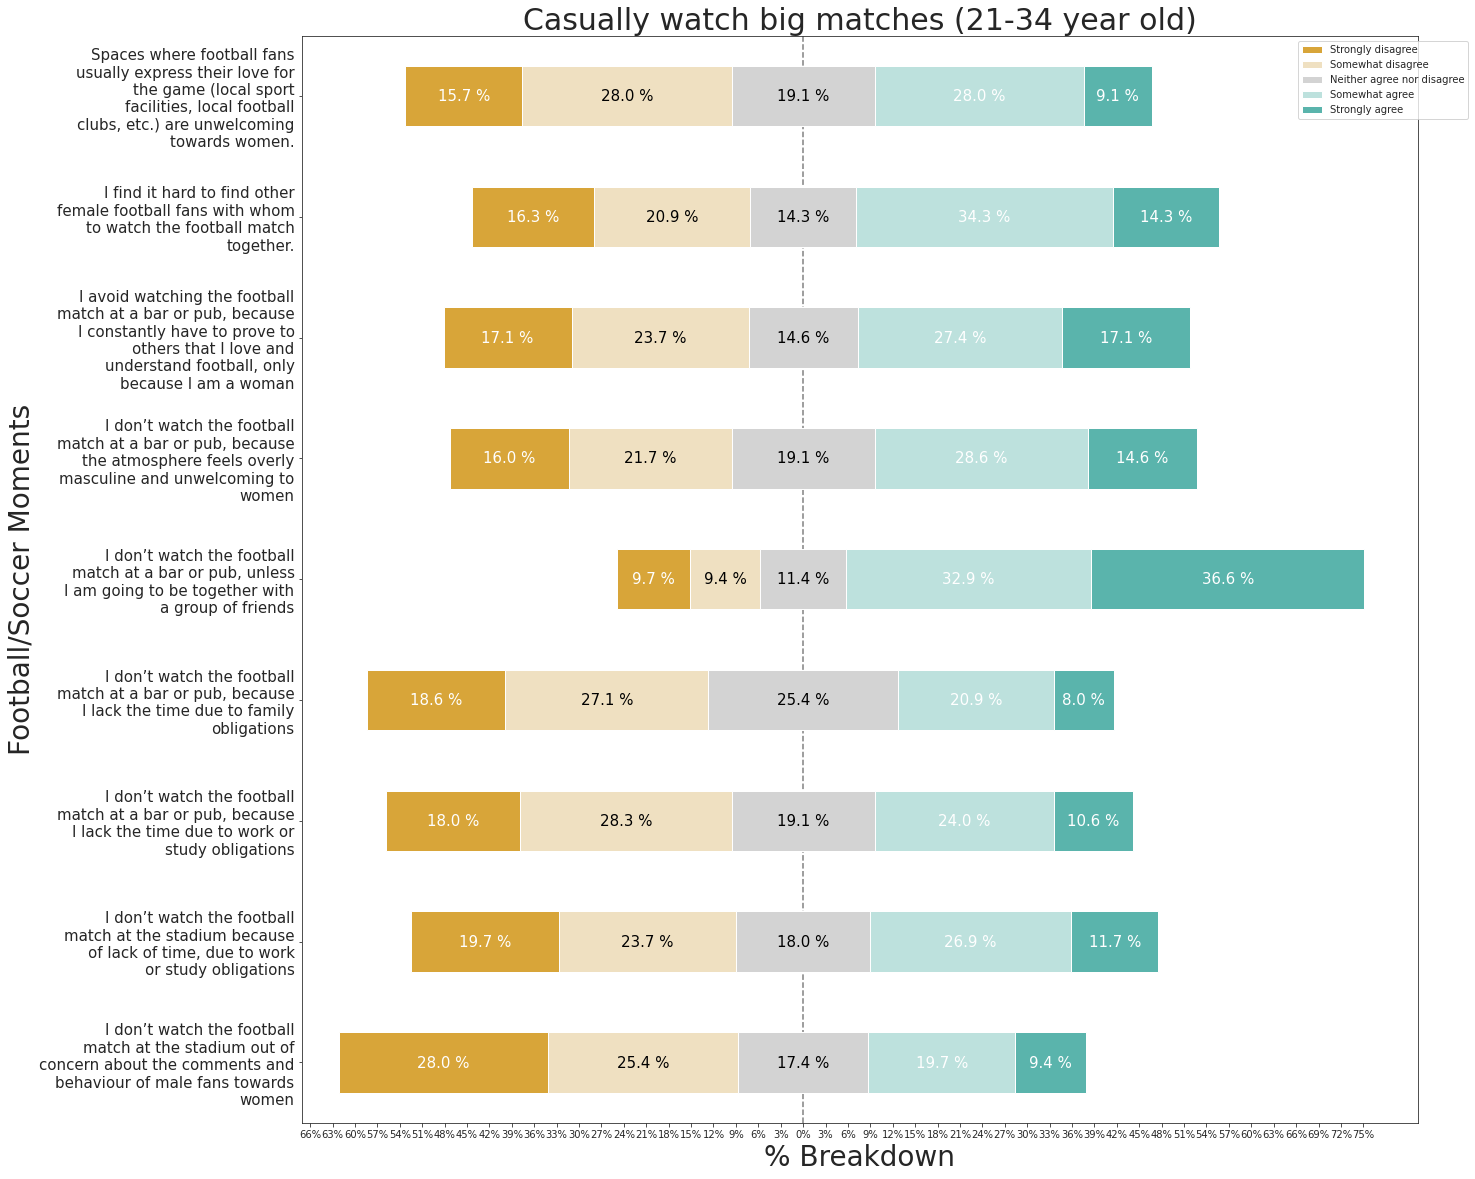
@约翰回答了我的问题-
您需要更新到最新的MatPlotLib
import plot_likert
import pandas as pd
# define my selections
myscale1 = \
        ['Strongly disagree',
     'Somewhat disagree',
     'Neither agree nor disagree',
     'Somewhat agree',
     'Strongly agree']
# create a likert plot
ax1  = plot_likert.plot_likert(agree_statements, myscale1, plot_percentage=True, figsize=(20,20), colors=plot_likert.colors.likert5)
ax1.set_title(('Casually watch big matches (21-34 year old)'), fontsize=30)
ax1.set_ylabel('Football/Soccer Moments',fontdict={'fontsize':28})
ax1.set_xlabel('% Breakdown',fontdict={'fontsize':28})
ax1.tick_params(axis='y', labelsize= 15)
ax1.tick_params(axis='x', labelsize= 10)

for bars, color in zip(ax1.containers[1:], ['white'] + ['black'] * 2 + ['white'] * 2):
    ax1.bar_label(bars, label_type='center', fmt='%.1f %%', color=color, fontsize=15)
页面原文内容由Stack Overflow提供。腾讯云小微IT领域专用引擎提供翻译支持
原文链接:
https://stackoverflow.com/questions/70975856
复制相关文章
相似问题
腾讯云开发者
