
从带向导的ggplot对象中更改图例标签?
从带向导的ggplot对象中更改图例标签?
提问于 2022-02-04 18:00:08
我正在从返回的ggplot对象开始工作,并希望覆盖图例标签。我试着用指南压倒一切,但似乎行不通。还有别的办法吗?
library ( ggplot2 )
make_plot <- function (){
g1 = ggplot(mtcars, aes(x=as.factor(cyl), fill=as.factor(cyl) )) +
geom_bar( ) +
scale_fill_brewer(palette = "Set1")
return ( g1 )
}
g1 = make_plot()
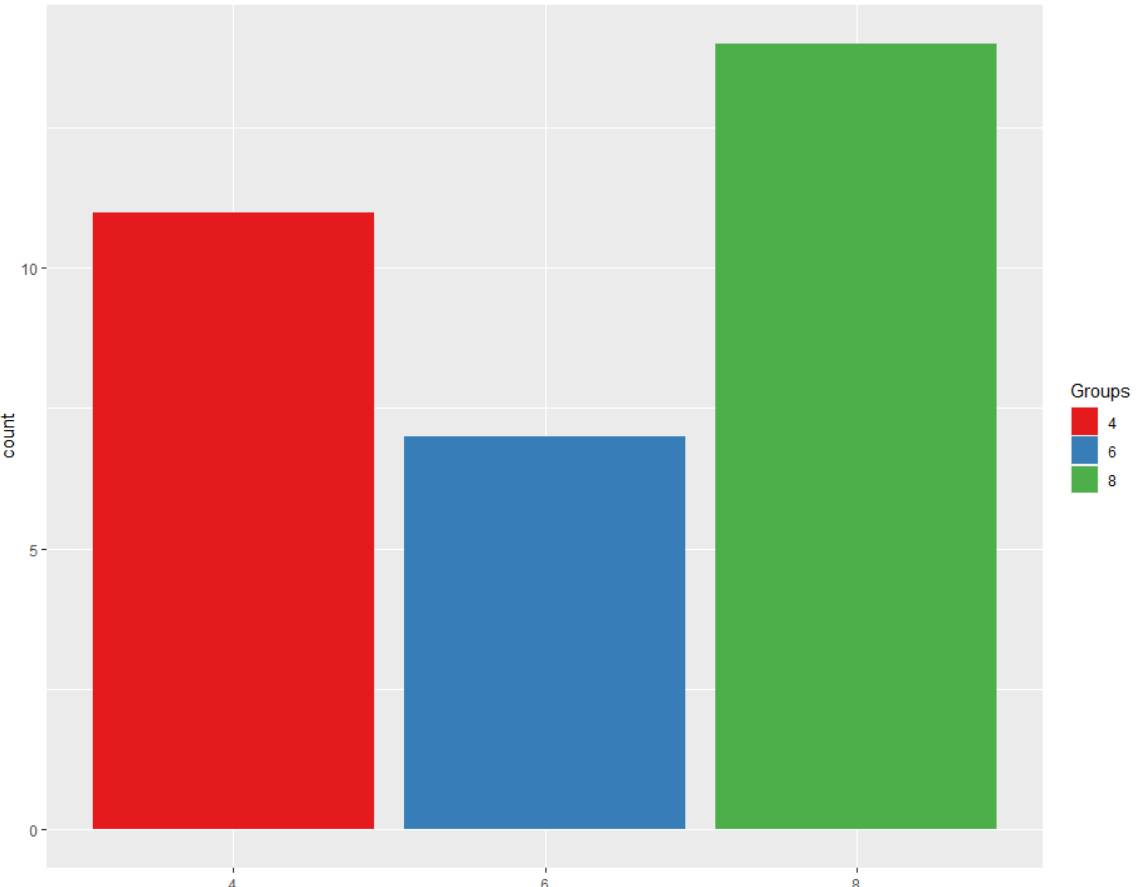
g1 + guides( fill = guide_legend(title.position="top" , title ="Groups", labels=c("c","b", "c") ) )所以我想要的是将图例标签改为b,而不是4,5,6。
回答 1
Stack Overflow用户
发布于 2022-02-04 18:09:09
您可以在Editing legend (text) labels in ggplot或ggplot legends - change labels, order and title中找到更多关于更改ggplot图例标签的信息。
但是,对您的问题的快速回答是,可以在scale_fill_brewer()而不是guide_legend()中在代码中指定这些内容,如下所示:
library ( ggplot2)

g1 = ggplot(mtcars, aes(x=as.factor(cyl), fill=as.factor(cyl) )) +
  geom_bar()

g1 +
  guides(fill = guide_legend(title.position="top", title ="Groups") ) +
  scale_fill_brewer(palette = "Set1", labels = c("a", "b", "c"))
编辑:根据你的评论更新了答案。在创建对象之后,当然也可以这样做。
页面原文内容由Stack Overflow提供。腾讯云小微IT领域专用引擎提供翻译支持
原文链接:
https://stackoverflow.com/questions/70990872
复制相关文章
相似问题
腾讯云开发者
