
基于值的matplotlib plt.text颜色的改变
基于值的matplotlib plt.text颜色的改变
提问于 2022-02-12 02:40:58
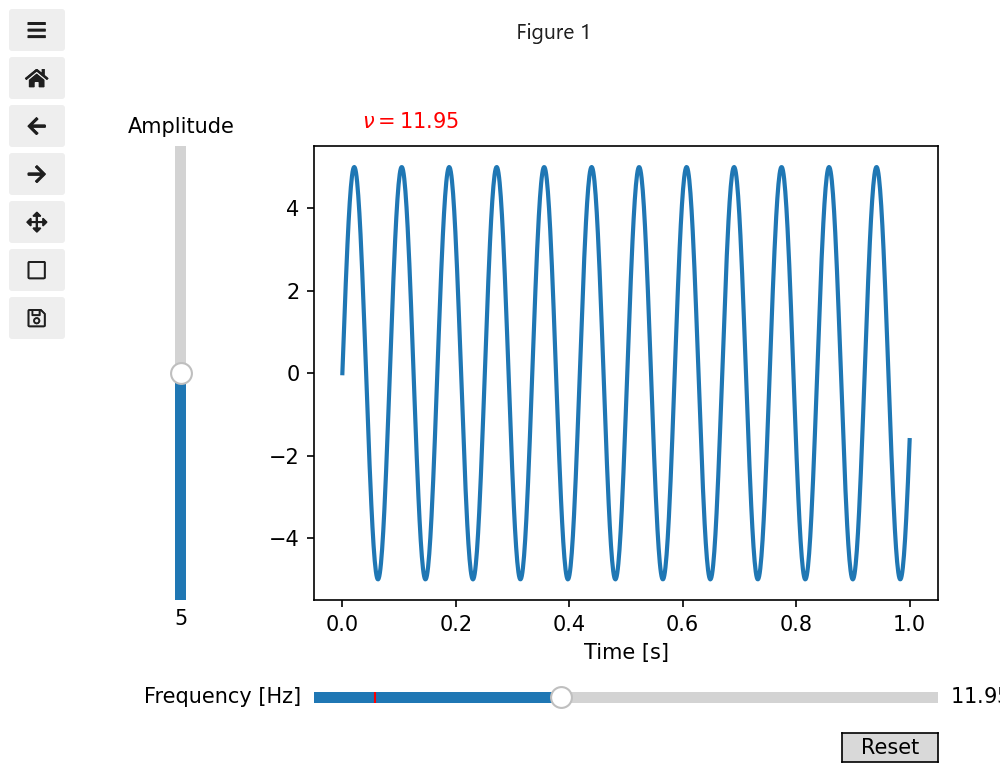
我正在玩滑块演示(https://matplotlib.org/stable/gallery/widgets/slider_demo.html),并决定用plt.text添加文本到情节中,如下所示;
freqtext = plt.text(-5, 22, r'$\nu = %.2f$' % freq_slider.val)然后,我根据freq_slider.val更改了文本值如下
freqtext.set_text(r'$\nu = %.2f$' % freq_slider.val)如果freq_slider.val的值大于某个值,比如10,我希望文本将颜色更改为红色。我知道我可以用
freqtext = plt.text(-5, 22, r'$\nu = %.2f$' % freq_slider.val, color = 'r')然而,我想要做的是根据它的值动态地更改颜色(或其他字体参数)。整个代码如下。请注意,唯一的更改是上面描述的两个。
提前谢谢。
import numpy as np
import matplotlib.pyplot as plt
from matplotlib.widgets import Slider, Button


# The parametrized function to be plotted
def f(t, amplitude, frequency):
    return amplitude * np.sin(2 * np.pi * frequency * t)

t = np.linspace(0, 1, 1000)

# Define initial parameters
init_amplitude = 5
init_frequency = 3

# Create the figure and the line that we will manipulate
fig, ax = plt.subplots()
line, = plt.plot(t, f(t, init_amplitude, init_frequency), lw=2)
ax.set_xlabel('Time [s]')

# adjust the main plot to make room for the sliders
plt.subplots_adjust(left=0.25, bottom=0.25)

# Make a horizontal slider to control the frequency.
axfreq = plt.axes([0.25, 0.1, 0.65, 0.03])
freq_slider = Slider(
    ax=axfreq,
    label='Frequency [Hz]',
    valmin=0.1,
    valmax=30,
    valinit=init_frequency,
)

# Make a vertically oriented slider to control the amplitude
axamp = plt.axes([0.1, 0.25, 0.0225, 0.63])
amp_slider = Slider(
    ax=axamp,
    label="Amplitude",
    valmin=0,
    valmax=10,
    valinit=init_amplitude,
    orientation="vertical"
)


# The function to be called anytime a slider's value changes
def update(val):
    line.set_ydata(f(t, amp_slider.val, freq_slider.val))
    fig.canvas.draw_idle()
    # make text red if freq_slider.val > 10
    freqtext.set_text(r'$\nu = %.2f$' % freq_slider.val)

# register the update function with each slider
freq_slider.on_changed(update)
amp_slider.on_changed(update)

# Create a `matplotlib.widgets.Button` to reset the sliders to initial values.
resetax = plt.axes([0.8, 0.025, 0.1, 0.04])
button = Button(resetax, 'Reset', hovercolor='0.975')

freqtext = plt.text(-5, 22, r'$\nu = %.2f$' % freq_slider.val, color='r')


def reset(event):
    freq_slider.reset()
    amp_slider.reset()
button.on_clicked(reset)

plt.show()Stack Overflow用户
回答已采纳
发布于 2022-02-12 03:33:27
我很少使用matplotlib的事件系统,但是我将初始文本设置设置为空,并更新更新函数中的文本和文本颜色。在那个时候,我加上一个10或更多的数字判断。
import numpy as np
import matplotlib.pyplot as plt
from matplotlib.widgets import Slider, Button
%matplotlib widget

# The parametrized function to be plotted
def f(t, amplitude, frequency):
    return amplitude * np.sin(2 * np.pi * frequency * t)

t = np.linspace(0, 1, 1000)

# Define initial parameters
init_amplitude = 5
init_frequency = 3

# Create the figure and the line that we will manipulate
fig, ax = plt.subplots()
line, = plt.plot(t, f(t, init_amplitude, init_frequency), lw=2)
ax.set_xlabel('Time [s]')
# freqtext = ax.text(-5, 22, []) # update

# adjust the main plot to make room for the sliders
plt.subplots_adjust(left=0.25, bottom=0.25)

# Make a horizontal slider to control the frequency.
axfreq = plt.axes([0.25, 0.1, 0.65, 0.03])
freq_slider = Slider(
    ax=axfreq,
    label='Frequency [Hz]',
    valmin=0.1,
    valmax=30,
    valinit=init_frequency,
)

# Make a vertically oriented slider to control the amplitude
axamp = plt.axes([0.1, 0.25, 0.0225, 0.63])
amp_slider = Slider(
    ax=axamp,
    label="Amplitude",
    valmin=0,
    valmax=10,
    valinit=init_amplitude,
    orientation="vertical"
)


# The function to be called anytime a slider's value changes
def update(val):
    line.set_ydata(f(t, amp_slider.val, freq_slider.val))
    fig.canvas.draw_idle()
    # make text red if freq_slider.val > 10
    c = 'r' if freq_slider.val > 10 else 'k'
    freqtext.set_text(r'$\nu = %.2f$' % freq_slider.val)
    freqtext.set_color(c)


# register the update function with each slider
freq_slider.on_changed(update)
amp_slider.on_changed(update)

# Create a `matplotlib.widgets.Button` to reset the sliders to initial values.
resetax = plt.axes([0.8, 0.025, 0.1, 0.04])
button = Button(resetax, 'Reset', hovercolor='0.975')

#freqtext = plt.text(-5, 22, r'$\nu = %.2f$' % freq_slider.val)
freqtext = plt.text(-5, 22, '')


def reset(event):
    freq_slider.reset()
    amp_slider.reset()
button.on_clicked(reset)

plt.show()
页面原文内容由Stack Overflow提供。腾讯云小微IT领域专用引擎提供翻译支持
原文链接:
https://stackoverflow.com/questions/71088554
复制相关文章
相似问题
腾讯云开发者
