
在图像上创建点的网格,但是索引超出了范围--尽管不是,为什么?
在图像上创建点的网格,但是索引超出了范围--尽管不是,为什么?
提问于 2022-03-07 09:30:05
我正在创建一个数组,该数组的网格值为255,大小为75x115,代码如下:
xn = 13 #grid line num
yn = 7 #grid line num
im = np.zeros((75, 115))
H, W = im.shape

step_x =  (W/(xn-1))
step_y =  (H/(yn-1))
xvalues = np.arange(0, W + step_x, step_x)
yvalues = np.arange(0, H + step_y, step_y)

xx, yy = np.meshgrid(xvalues, yvalues)

positions = np.column_stack([xx.ravel(), yy.ravel()]).astype(int)

for (x,y) in (positions):
    im[y, x] = 255
错误说
index 115 is out of bounds for axis 1 with size 115如果我将范围更改为:
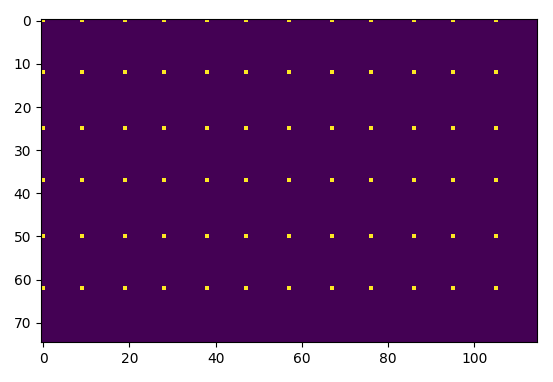
xvalues = np.arange(0, W, step_x)
yvalues = np.arange(0, H, step_y)
这将是生成的映像,但这不是我想要做的,它只生成12x6网格线,而不是13x7。13x7网格线应包括起始和结束像素范围(0-75,0-115),使图像完全覆盖在网格中。
知道怎么解决这个问题吗?
回答 2
Stack Overflow用户
发布于 2022-03-07 10:05:25
如果你想要几乎等距的网格点,你可以
xvalues = np.linspace(0, im.shape[1]-1, xn, dtype='int')yvalues也是如此。但是,由于13不相等地除以115,所以您将无法在选择数组大小和网格间距时具有完全相等的间距。
如果我们打印xvalues,也可以看到这一点。
print(xvalues)
>> [  0.           9.58333333  19.16666667  28.75        38.33333333
  47.91666667  57.5         67.08333333  76.66666667  86.25
95.83333333 105.41666667]这些点将在[0, 9, 19, 28, 38, 47, 57, 67, 76, 86, 95, 105]上绘制,因此有时有10的差异,有时有9的差异。
Stack Overflow用户
发布于 2022-03-07 11:18:47
在任何需要构造定义良好的2D甚至多维空间的应用程序中,网格网格都是有用的,xvalues和yvalues应该是网格索引值,这意味着它们不能超过图像im的维数,我建议您查看一下线段空间和网格栅,从而深入了解这些方法,以便实现预期的输出。
这就是我目前尝试过的:
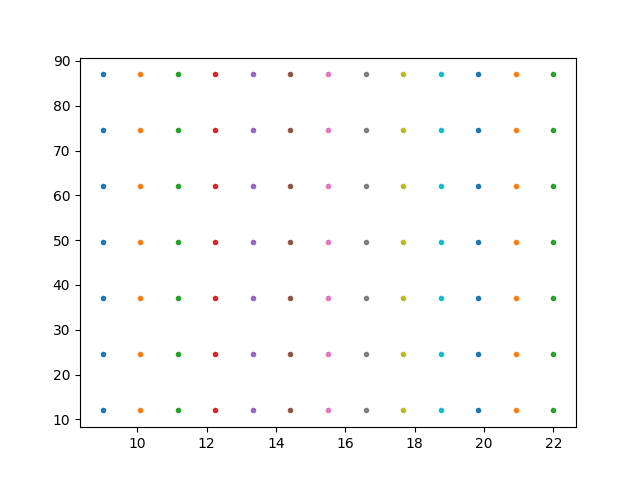
xvalues = np.linspace(int(step_x), int(step_x+W), xn)
yvalues = np.linspace(int(step_y), int(step_y+H), yn)

xx, yy = np.meshgrid(xvalues, yvalues)

positions = np.column_stack([xx.ravel(), yy.ravel()]).astype(int)
for (x,y) in (positions):
  im[x, y] = 255
fig = plt.figure()
ax = fig.add_subplot(111)
ax.plot(xx, yy, ls="None", marker=".")

plt.show()
输出:
页面原文内容由Stack Overflow提供。腾讯云小微IT领域专用引擎提供翻译支持
原文链接:
https://stackoverflow.com/questions/71378908
复制相关文章
相似问题
腾讯云开发者
