
matplotlib LineCollection错误解释颜色图
我想用matplotlib.pyplot生成一个线条图,其中每个线段都有其指定的颜色。颜色可以不止一次出现。我使用一个LineCollection及其属性cmap (简称“彩色映射”)来完成这个任务,但是遇到了一个问题。
我希望下面的代码示例得到足够的简化。数组data只是一个例子,以及(在本例中是周期性的)颜色分配。
import matplotlib as mpl
import matplotlib.pyplot as plt
from matplotlib.collections import LineCollection
import numpy as np

n_colors = 8
n_datapoints = 60

# plot legend
data_x = range(n_colors)
data_color = range(n_colors)
fig, ax = plt.subplots(figsize=(10, 2))
rects = ax.bar(data_x, [1]*n_colors, color=plt.cm.tab20(data_color), alpha = 1)
plt.xticks(data_x)

fig, ax = plt.subplots(
    nrows=1,
    figsize=(15,10),
    squeeze=True,
)

# initialize data to plot
data = np.zeros((n_datapoints,))
for i in range(n_datapoints):
    data[i] = i*i % 20

# prepare data for use in LineCollection
x_y_values = np.vstack((np.arange(n_datapoints), data)).T
x_y_values = x_y_values.reshape(-1,1,2)
segments = np.hstack([x_y_values[:-1], x_y_values[1:]])

# colors for line segments
colors = np.array(list(map(lambda n: n % n_colors, range(n_datapoints))))

# plot

lineCollection = LineCollection(
    segments=segments,
    cmap=plt.cm.tab20,
    **{"linewidths": 1, "alpha": 1},
)
lineCollection.set_array(colors)
ax.add_collection(lineCollection)
ax.autoscale_view()

plt.show()
这就产生了以下两个情节:
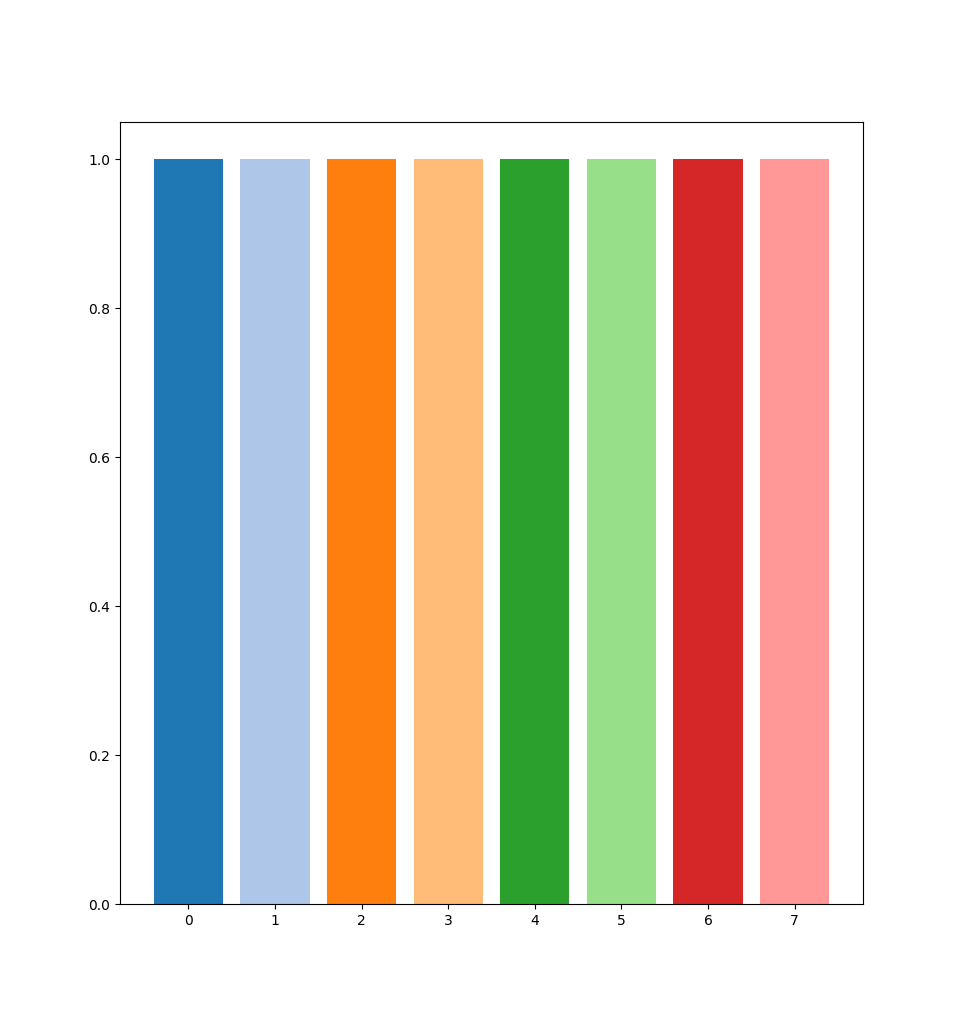
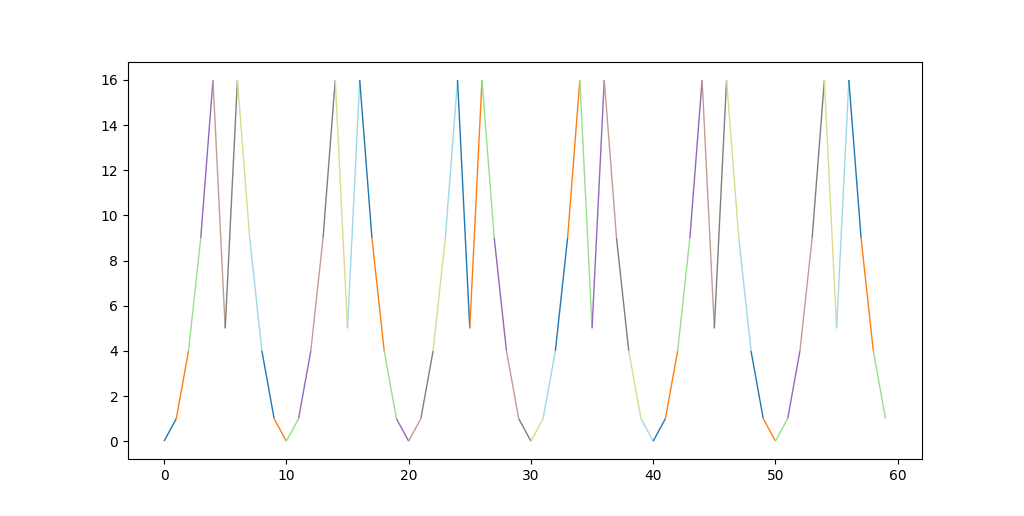
正如你所看到的(我希望它对你来说是可见的),情节中的颜色与传说中的颜色不匹配。我希望蓝色,浅蓝色,橙色,浅橙色,绿色,浅绿色,红色,淡红色在这个顺序中,在结束后重复。我得到的是蓝色,橙色,浅绿色,紫色,棕色,颜色-我不知道,浅绿色,浅蓝色,结束后重复。特别要注意的是,图中的某些颜色(例如棕色)不在彩色地图plt.cm.tab20的前8种颜色之内。
这怎么可能呢?为什么线段的颜色不正确?
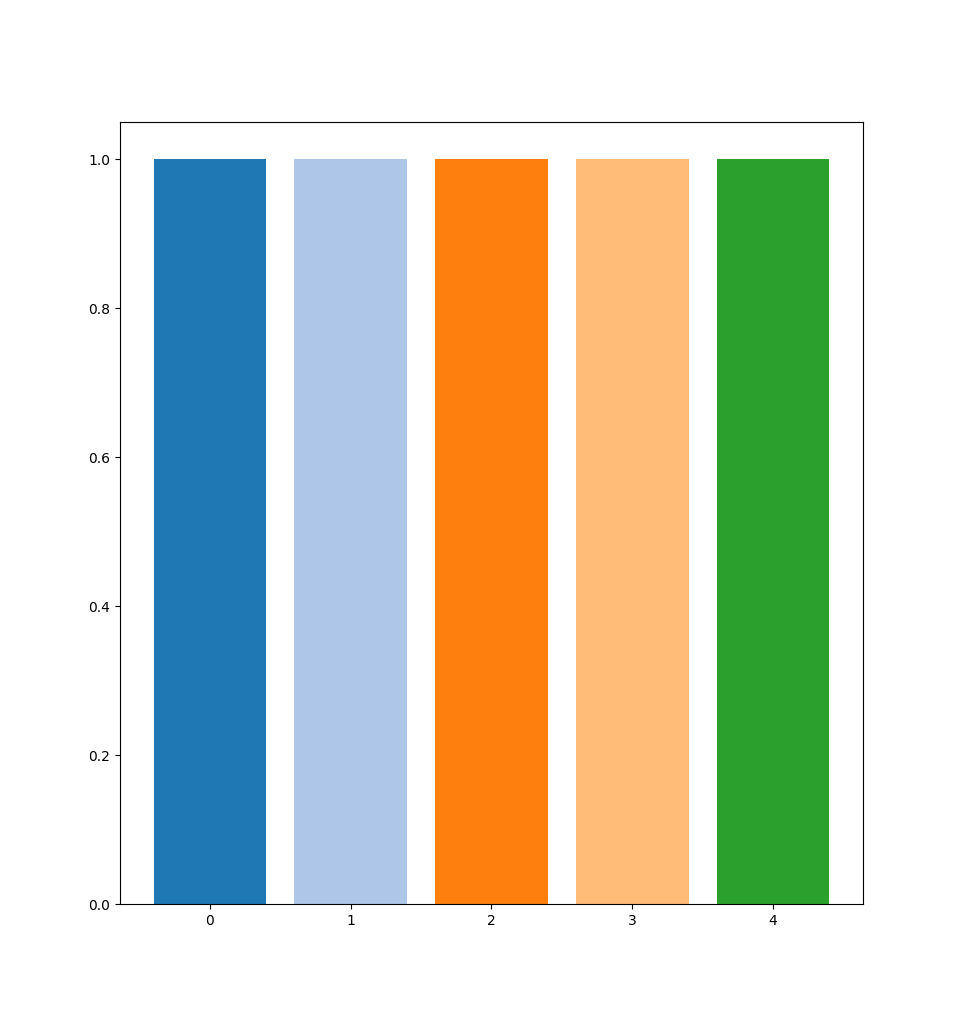
当我将上述代码的第6行从n_colors = 8更改为n_colors = 5时,图例仍然显示了我所期望的。然而,线条情节的颜色却发生了变化:
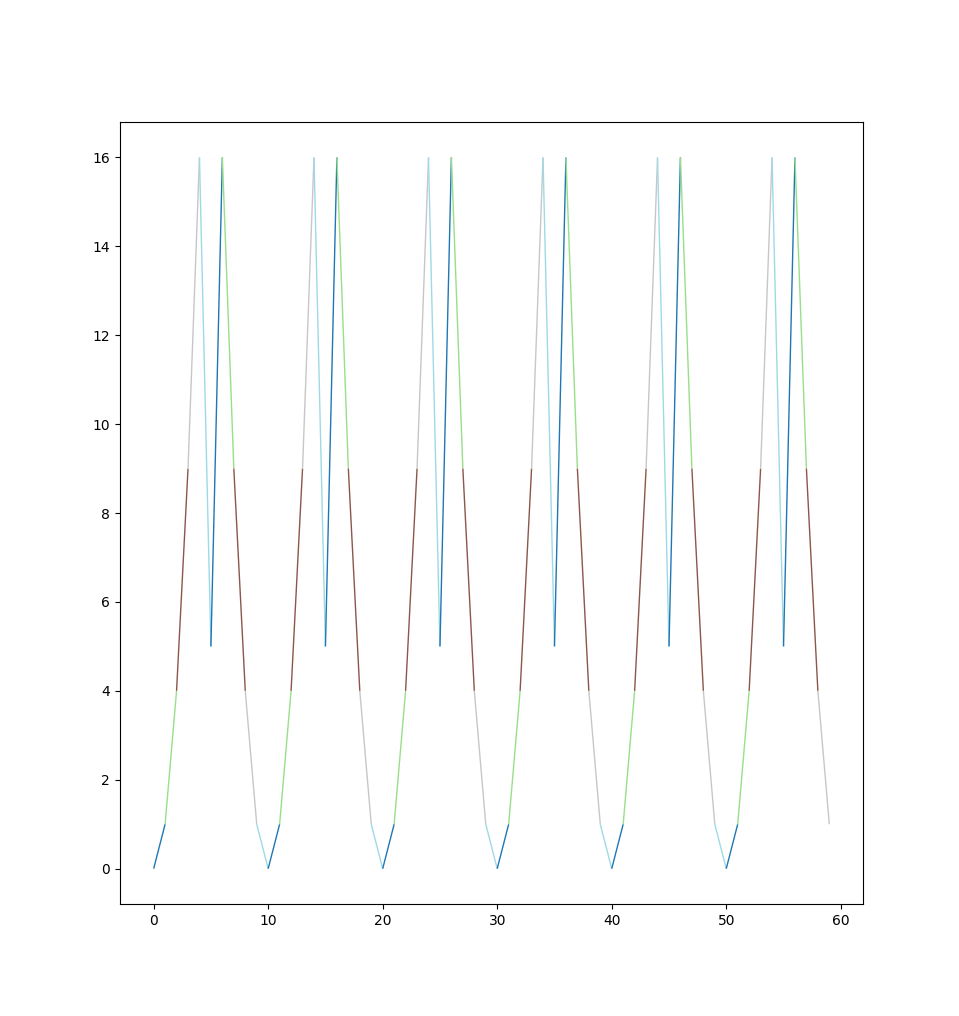
情节现在显示蓝色,浅绿色,棕色,灰色,浅蓝色.所以在我看来,plt.cm.tab20并不是一个离散的固定的彩色映射。但我想要的是一张离散而固定的彩色地图。
我做错了什么?如何获得从0到20}之间的{整型到行图的{color}之间的一致映射?
回答 1
Stack Overflow用户
发布于 2022-03-10 16:28:46
看来,matplotlib的LineCollection将传递的数组colors缩放到实际间隔0,1上。因此,如果在其中出现数字0, ..., 7,那么(我想)从tab20得到8种颜色,它们在所有20种颜色之间的间隔大致相等。
通过将关键字参数norm (文档可以找到这里)传递给LineCollection,可以补救如下:
lineCollection = LineCollection(
    segments=segments,
    cmap=plt.cm.tab20,
    norm=mpl.colors.Normalize(vmin=0, vmax=19),
    **{"linewidths": 1, "alpha": 1},
)
lineCollection.set_array(colors)在这里,我添加了一行norm=mpl.colors.Normalize(vmin=0, vmax=19), (知道我喜欢的颜色图使用0到19之间的索引)。
https://stackoverflow.com/questions/71412123
复制相似问题
腾讯云开发者
