
如何在独立线上显示多个y轴标题,并在chart.js中顺时针旋转90度
编辑
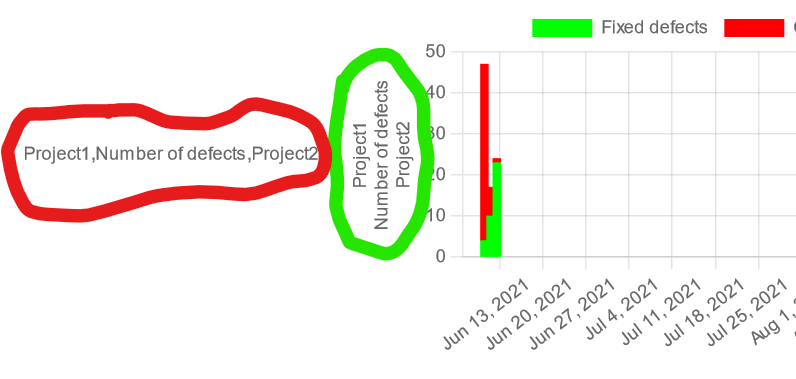
我的目标是显示几个y轴标题在不同的线上旋转90度顺时针在图表。
我希望绿色的圆圈标题被旋转到红色圆圈标题的方向,同时保持多行标题。
。
多个标题的默认方向是绿色圆圈中显示的方向。
我希望标题位于不同的线上(比如绿色的圆圈),顺时针旋转90度(就像红色圆圈的方向)。
为了在单独的行上获得标题,我基本上创建了一个字符串数组,如下所示:在chartJs中添加多行作为Y轴标题
y: {
   stacked: true,
   title: {
      text: ['Project1', 'Number of defects', 'Project2'],
      display: true
   }
}
上面的代码在不同的行上给出了正确的标题,但没有给出正确的方向。
顺时针旋转标题90度的一个解决方案是添加一个自定义标题常量,并将其作为插件添加到配置中,如下所示:在chart.js中旋转y轴标题的能力
const customTitle = {
    id: 'customTitle',
    beforeLayout: (chart, args, opts) => {
        const {display,font} = opts;
        if (!display) {
            return;
        }
        const {ctx} = chart;
        ctx.font = font || '12px "Helvetica Neue", Helvetica, Arial, sans-serif'
        const {width} = ctx.measureText(opts.text);
        chart.options.layout.padding.left = width * 1.1;
    },
    afterDraw: (chart, args, opts) => {
        const {font,text,color} = opts;
        const {ctx,chartArea: {top,bottom,left,right}} = chart;
        if (opts.display) {
            ctx.fillStyle = color || Chart.defaults.color
            ctx.font = font || '12px "Helvetica Neue", Helvetica, Arial, sans-serif'
            ctx.fillText(text, 3, (top + bottom) / 2)
        }
    }
}

const labels = ['2021-06-07 00:00:00', '2021-06-08 00:00:00', '2021-06-09 00:00:00'];

const data = {
    labels: labels,
    datasets: [{
        label: 'Fixed defects',
        backgroundColor: 'rgb(0, 255, 0)',
        borderColor: 'rgb(0, 255, 0)',
        data: ['2', '73', '34'],
        barThickness: 5
    }, {
        label: 'Open defects',
        backgroundColor: 'rgb(255, 0, 0)',
        borderColor: 'rgb(255, 0, 0)',
        data: ['0', '5', '2'],
        barThickness: 5

    }]
};

const config = {
    type: 'bar',
    data: data,
    options: {
        scales: {
            x: {
                min: '2021-06-07 00:00:00',
                max: '2021-09-10 00:00:00',
                type: 'time',
                time: {
                    unit: 'week'
                },
                stacked: true,
            },
            y: {
                stacked: true,
            }
        },
        plugins: {
            customTitle: {
                display: true,
                text: ['Project1', 'Number of defects', 'Project2']
            }
        }
    },
    plugins: [customTitle]
};

const myChart = new Chart(
    document.getElementById('myChart'),
    config
);<!DOCTYPE html>
<meta charset="utf-8">
<script src="https://cdn.jsdelivr.net/npm/chart.js@^3"></script>
<script src="https://cdn.jsdelivr.net/npm/moment@^2"></script>
<script src="https://cdn.jsdelivr.net/npm/chartjs-adapter-moment@^1"></script>
<body>
<div>
<canvas height="100px" id="myChart"></canvas>
</div>
</body>
上面的代码片段给出了正确的方向,但没有在单独的行上显示标题。
然而,当我试图将这两种解决方案结合在一起时,我得到:
- 正确的旋转90度标题(但不是在不同的线上),如左边的红色圆圈所示
和
- 多个标题在不同的线上(但不是顺时针旋转90度),如右边绿色圆圈所示。
const customTitle = {
    id: 'customTitle',
    beforeLayout: (chart, args, opts) => {
        const {display,font} = opts;
        if (!display) {
            return;
        }
        const {ctx} = chart;
        ctx.font = font || '12px "Helvetica Neue", Helvetica, Arial, sans-serif'
        const {width} = ctx.measureText(opts.text);
        chart.options.layout.padding.left = width * 1.1;
    },
    afterDraw: (chart, args, opts) => {
        const {font,text,color} = opts;
        const {ctx,chartArea: {top,bottom,left,right}} = chart;
        if (opts.display) {
            ctx.fillStyle = color || Chart.defaults.color
            ctx.font = font || '12px "Helvetica Neue", Helvetica, Arial, sans-serif'
            ctx.fillText(text, 3, (top + bottom) / 2)
        }
    }
}

const labels = ['2021-06-07 00:00:00', '2021-06-08 00:00:00', '2021-06-09 00:00:00'];

const data = {
    labels: labels,
    datasets: [{
        label: 'Fixed defects',
        backgroundColor: 'rgb(0, 255, 0)',
        borderColor: 'rgb(0, 255, 0)',
        data: ['4', '10', '23'],
        barThickness: 5
    }, {
        label: 'Open defects',
        backgroundColor: 'rgb(255, 0, 0)',
        borderColor: 'rgb(255, 0, 0)',
        data: ['43', '7', '1'],
        barThickness: 5

    }]
};

const config = {
    type: 'bar',
    data: data,
    options: {
        scales: {
            x: {
                min: '2021-06-07 00:00:00',
                max: '2021-09-10 00:00:00',
                type: 'time',
                time: {
                    unit: 'week'
                },
                stacked: true,
            },
            y: {
                    title: {
                    text: ['Project1', 'Number of defects', 'Project2'],
                  display: true
                },
                stacked: true,
            }
        },
        plugins: {
            customTitle: {
                display: true,
                text: ['Project1', 'Number of defects', 'Project2']
            }
        }
    },
    plugins: [customTitle]
};

const myChart = new Chart(
    document.getElementById('myChart'),
    config
);<!DOCTYPE html>
<meta charset="utf-8">
<script src="https://cdn.jsdelivr.net/npm/chart.js@^3"></script>
<script src="https://cdn.jsdelivr.net/npm/moment@^2"></script>
<script src="https://cdn.jsdelivr.net/npm/chartjs-adapter-moment@^1"></script>
<body>
<div>
<canvas height="100px" id="myChart"></canvas>
</div>
</body>
如果您更愿意在那里测试相同的代码片段,请看下面的小提琴:例琴
我还尝试在自定义的旋转标题中添加新行,如下所示:
customTitle: {
   display: true,
   text: 'Project1\nNumber of defects\nProject2'
}但这也没用。怎样才能同时获得、、单独的行标题和正确的方向?
任何帮助都将不胜感激。
回答 1
Stack Overflow用户
发布于 2022-03-11 10:37:33
如果它是数组,则可以添加额外的检查,在这种情况下,您首先只计算最长元素的填充,这样就没有大的空白,然后可以计算Y起始位置,并为数组中的每个元素增加它,这样就可以有任意多行。
const customTitle = {
  id: 'customTitle',
  beforeLayout: (chart, args, opts) => {
    const {
      display,
      font
    } = opts;
    if (!display) {
      return;
    }
    const {
      ctx
    } = chart;
    ctx.font = font || '12px "Helvetica Neue", Helvetica, Arial, sans-serif'

    let width = 0;

    if (Array.isArray(opts.text)) {
      opts.text.forEach(e => {
        const tmpWidth = ctx.measureText(e).width;
        if (tmpWidth > width) {
          width = tmpWidth;
        }
      });
    } else {
      width = ctx.measureText(opts.text).width;
    }
    chart.options.layout.padding.left = width * 1.1;
  },
  afterDraw: (chart, args, opts) => {
    const {
      font,
      text,
      color
    } = opts;
    const {
      ctx,
      chartArea: {
        top,
        bottom,
        left,
        right
      }
    } = chart;
    if (opts.display) {
      ctx.fillStyle = color || Chart.defaults.color
      ctx.font = font || '12px "Helvetica Neue", Helvetica, Arial, sans-serif'

      if (Array.isArray(text)) {
        const height = ctx.measureText("M").width;
        let y = ((top + bottom) / 2) - Math.ceil(text.length / 2) * height;

        text.forEach(e => {
          ctx.fillText(e, 3, y);
          y += height + (opts.lineSpacing || 0);
        });

      } else {
        ctx.fillText(text, 3, (top + bottom) / 2)
      }
    }
  }
}

const labels = ['2021-06-07 00:00:00', '2021-06-08 00:00:00', '2021-06-09 00:00:00'];

const data = {
  labels: labels,
  datasets: [{
    label: 'Fixed defects',
    backgroundColor: 'rgb(0, 255, 0)',
    borderColor: 'rgb(0, 255, 0)',
    data: ['4', '10', '23'],
    barThickness: 5
  }, {
    label: 'Open defects',
    backgroundColor: 'rgb(255, 0, 0)',
    borderColor: 'rgb(255, 0, 0)',
    data: ['43', '7', '1'],
    barThickness: 5

  }]
};

const config = {
  type: 'bar',
  data: data,
  options: {
    scales: {
      x: {
        min: '2021-06-07 00:00:00',
        max: '2021-09-10 00:00:00',
        type: 'time',
        time: {
          unit: 'week'
        },
        stacked: true,
      },
      y: {
        stacked: true,
      }
    },
    plugins: {
      customTitle: {
        display: true,
        text: ['Project1', 'Number of defects', 'Project2'],
        lineSpacing: 8
      }
    }
  },
  plugins: [customTitle]
};

const myChart = new Chart(
  document.getElementById('myChart'),
  config
);<!DOCTYPE html>
<meta charset="utf-8">
<script src="https://cdn.jsdelivr.net/npm/chart.js@^3"></script>
<script src="https://cdn.jsdelivr.net/npm/moment@^2"></script>
<script src="https://cdn.jsdelivr.net/npm/chartjs-adapter-moment@^1"></script>
<body>
<div>
<canvas height="100px" id="myChart"></canvas>
</div>
</body>
https://stackoverflow.com/questions/71430025
复制相似问题
腾讯云开发者

Copyright © 2013 - 2026 Tencent Cloud. All Rights Reserved. 腾讯云 版权所有
深圳市腾讯计算机系统有限公司 ICP备案/许可证号:粤B2-20090059 ![]() 粤公网安备44030502008569号
粤公网安备44030502008569号
腾讯云计算(北京)有限责任公司 京ICP证150476号 | 京ICP备11018762号