
如何计算非线性回归“y=2/(1+exp(a*x)-1”)中的系数"a“?还画了图?
如何计算非线性回归“y=2/(1+exp(a*x)-1”)中的系数"a“?还画了图?
提问于 2022-03-14 16:28:07
如本课题所述,给出了x (FTSW)的一些值及其对应的y (NLE)的值,其中的euqation y=2/(1+exp(a*x))-1,如何计算"a“并绘制图形?
structure(list(FTSW = c(0.900359288405312, 0.900334904035704,
                        0.905841413662097, 0.667621859862976, 0.632473107345453, 0.462837958498518,
                        0.400045032939416, 0.352560790392534, 0.377856799586057, 0.628289954726284,
                        0.311242672407523, 0.170933345859364, 0.311242672407523, 0.315689846065931,
                        0.14105342778594, 0.147112396871317, 0.0722352096264757, 0.0615716495856242,
                        0.396997072279772, 0.0332444780173884, 0.0871102539376406, 0.320745031679664,
                        0.232853736349989, 0.195548432729584), NLE = c(0.557811005824568,
                                                                       0.947807189426057, 0.676214815603592, 0.444390402075227, 0.97602256699577,
                                                                       0.728254923413566, 0.306279885240675, 0.970762905436273, 0.611065629690272,
                                                                       0.253424268258028, 0.557708161582854, 0.108086143843963, 0.727886237647626,
                                                                       0.53056603773585, 0.54236648424231, 0.338367448826758, 0.111826531578449,
                                                                       0.231650365670985, 0.409424366533147, 0.047092400998931, 0.19369651429764,
                                                                       0.342990129203114, 0.288499226405363, 0.295346695941639)), class = c("tbl_df",
                                                                                                                                            "tbl", "data.frame"), row.names = c(NA, -24L))
我试过:
  df <- read_excel("##.xlsx")
  x <- FTSW
  y <- NLE

  ggplot(df, aes(x, y))+
  geom_point(pch=19, cex=3, ,col="Blue3") +
  geom_smooth(method="nls", formula=y ~ 2/(1+exp(a*x))-1, method.args=list(start = list(a=1)), se=FALSE,lwd= 1.2, col= "black")+
  scale_y_continuous(limits = c(0,1.0)) +
  scale_x_continuous(limits = c(0,1)) +
  labs(title ="Blancs",y="Expansion folliaire verte relative",x="FTSW")+
  theme_update(plot.title=element_text(hjust=0.5))
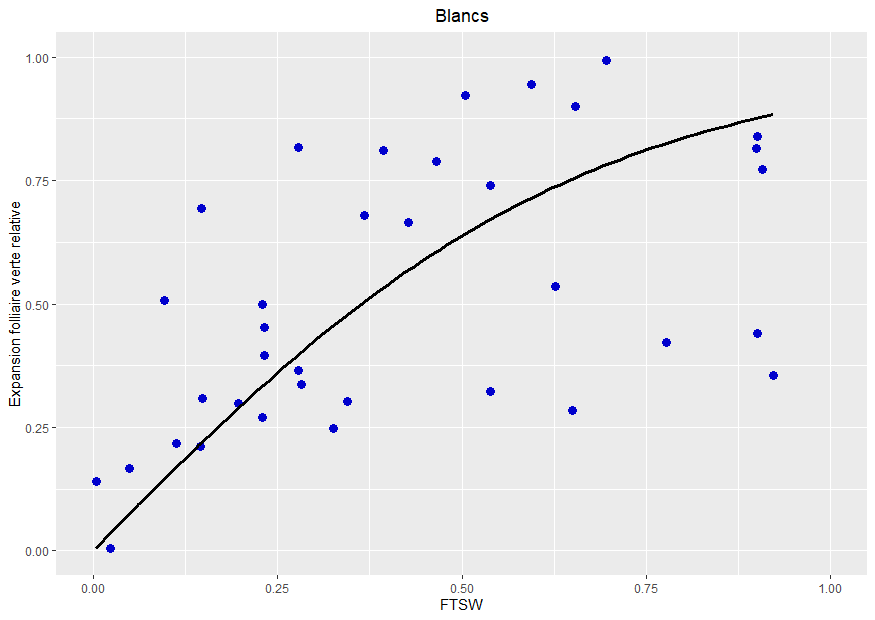
这样,我可以得到图形,但我不知道如何获得“a”值。有人能帮我吗?
回答 2
Stack Overflow用户
回答已采纳
发布于 2022-03-14 16:56:50
您可以使用stat::nls分别估计模型(例如,mod),并通过coef(mod)获得系数。
mod = nls(NLE ~ 2/(1+exp(a*FTSW))-1,start = list(a=1),data = dat)
dat$pred = predict(mod,dat)
a = coef(mod)

ggplot(dat,aes(x=FTSW)) +
  geom_point(aes(y=NLE), pch=19, cex=3, ,col="Blue3") +
  geom_line(aes(y=pred), color="black", lwd=1.2) +
  labs(caption=paste("'a' value from model=",round(a,4))) +
  scale_y_continuous(limits = c(0,1.0)) +
  scale_x_continuous(limits = c(0,1)) +
  labs(title ="Blancs",y="Expansion folliaire verte relative",x="FTSW")+
theme_update(plot.title=element_text(hjust=0.5))Stack Overflow用户
发布于 2022-03-14 18:08:35
向nls添加一个跟踪,它将运行结果存储在全局环境中的.nls中。
trace(nls, exit = quote(.nls <<- returnValue()))
# run ggplot
untrace(nls)

coef(.nls)
##         a
## -2.974184 页面原文内容由Stack Overflow提供。腾讯云小微IT领域专用引擎提供翻译支持
原文链接:
https://stackoverflow.com/questions/71471105
复制相关文章
相似问题
腾讯云开发者
