
如何在r中使两个过滤器巧妙地切换图表线的可见性?如何在过滤器中进行多选择?
我试图使用R plot_ly来创建一个线条图,可以使用沿着“产品”和"Chip_type“过滤的筛选按钮来切换和关闭线条。其想法是,供应商(“供应商”/“Supplier_text”)每月为公司不同的产品部门(“产品”)提供不同种类的芯片("Chip_type")。为了了解顶级供应商的概况,我想在每个供应商中画一条线,在图例中显示"Supplier_text“,图例条目按照显示在"Supplier_text”前面的abs(数字)向下排序。在这方面,数据tibble被正确地排序。“总体”条目是指该产品的所有供应商的总和。
完整的数据集将在文章末尾找到。
sample from dat :

    Date(chr) Supplier              Supplier_text                        order(int) Chip_type Product     n(chr)
1   2019-11   Overall Smartphones   94757 |   17.9% - Overall Smartphones     1     Micro   Smartphones    106
2   2019-11   Overall Smartphones   94757 |   17.9% - Overall Smartphones     1      Nano   Smartphones  16920
3   2019-11   Overall Smartphones   94757 |   17.9% - Overall Smartphones     1    BiMech   Smartphones  61216
4   2019-11   Overall Smartphones   94757 |   17.9% - Overall Smartphones     1     Titan   Smartphones 363698
5   2019-11   Overall Smartphones   94757 |   17.9% - Overall Smartphones     1   Quantum   Smartphones  50797
6   2019-11   Overall Smartphones   94757 |   17.9% - Overall Smartphones     1  Platinum   Smartphones  52715
7   2019-11   Overall Smartphones   94757 |   17.9% - Overall Smartphones     1 PlainChip   Smartphones 174342
8   2019-11   Overall Smartphones   94757 |   17.9% - Overall Smartphones     1   Classic   Smartphones   9319
9   2019-12   Overall Smartphones   94757 |   17.9% - Overall Smartphones     1     Micro   Smartphones     92
10  2019-12   Overall Smartphones   94757 |   17.9% - Overall Smartphones     1      Nano   Smartphones  16928
11  2019-12   Overall Smartphones   94757 |   17.9% - Overall Smartphones     1    BiMech   Smartphones  40920
17  2019-11      Overall Monitors     -33239 |  -37.8% - Overall Monitors     2     Micro      Monitors      3
18  2019-11      Overall Monitors     -33239 |  -37.8% - Overall Monitors     2      Nano      Monitors   1536
19  2019-11      Overall Monitors     -33239 |  -37.8% - Overall Monitors     2    BiMech      Monitors   6793
20  2019-11      Overall Monitors     -33239 |  -37.8% - Overall Monitors     2     Titan      Monitors  45146
21  2019-11      Overall Monitors     -33239 |  -37.8% - Overall Monitors     2   Quantum      Monitors   7922
22  2019-11      Overall Monitors     -33239 |  -37.8% - Overall Monitors     2  Platinum      Monitors   5359
23  2019-11      Overall Monitors     -33239 |  -37.8% - Overall Monitors     2 PlainChip      Monitors  27390
24  2019-11      Overall Monitors     -33239 |  -37.8% - Overall Monitors     2   Classic      Monitors   1131
25  2019-12      Overall Monitors     -33239 |  -37.8% - Overall Monitors     2     Micro      Monitors     12
33  2019-11                     A                    -17385 |  -88.0% - A     3     Titan   Smartphones   3619
34  2019-11                     A                    -17385 |  -88.0% - A     3  Platinum   Smartphones     13
35  2019-11                     A                    -17385 |  -88.0% - A     3   Quantum   Smartphones      2
保持顺序(稍后能够切换正确的行!)我正在循环向空的plot_ly对象添加跟踪,如下所示:
library(stringr)
library(dplyr)
library(plotly)


# "Rebuilding" the data frame as the loop runs to see if what the loop does to the traces ends up being the same (order) as the original data frame. For that, I create an empty object first:
dat_plotly_object_copy = c()


plotly_object <- plot_ly()
id = 1

# I loop along "order", which marks all data of a single supplier:
for(id in 1:max(dat$order)){
  dat_one_supplier <- filter(dat, order == id)
  plotly_object <- plotly_object %>% add_trace(., data = dat_one_supplier,
# I filter the data set by supplier, to be able to create a line along the dates (~x) per supplier (~Supplier_text) and Chip_type (~n):
                                 x = ~Date,
                                 y = ~n,
                                 color = ~Supplier_text,
                                 type = "scatter",
                                 mode = "lines")
  dat_plotly_object_copy <- dat_plotly_object_copy %>%
    rbind(.,dat_one_supplier)
}

identical(dat, dat_plotly_object_copy)
# The created data frame seems to be identical to what the loop does - so the order should match (?)
用这个代码来设置图例..。
Parts_legend <- list(
  font = list(
    family = "sans-serif",
    size = 12,
    color = "#000"),
  title = list(text="<b> Delta previous month by Supplier - Absolute </b>"),
  bgcolor = "#E2E2E2",
  bordercolor = "#FFFFFF",
  borderwidth = 2,
  layout.legend = "constant",
  traceorder = "grouped")
。。并展示物体:
plotly_object %>%
  layout(legend = Parts_legend,
         title = "by supplier delta previous month",
         xaxis = list(title = 'Date'),
yaxis = list(title = 'Chip Volume'))留给我的是下面的图表,这似乎是正确的:供应商是按名字前面的abs(号码)输入的!1:https://i.stack.imgur.com/bDTWZ.png
现在我需要添加按钮。在第一步中,我创建了两个数据框架,用来指示一行以后是否可见(TRUE)或非(FALSE)。我试图以与dat相同的格式创建它们,以便为筛选的变量所能接受的每一行dat/the值获得一个真或假:
Parts_product_filter <- select(dat,Supplier_text,order,Product,Chip_type) %>%
  mutate(Smartphones = ifelse(Product == "Smartphones",T,F) %>% sapply(.,list),
         TVs = ifelse(Product == "TVs",T,F) %>% sapply(.,list),
         Monitors = ifelse(Product == "Monitors",T,F) %>% sapply(.,list),
         Miscellaneous = ifelse(Product == "Miscellaneous",T,F) %>% sapply(.,list))


Parts_chip_type_filter <- select(dat,Supplier_text,order,Product,Chip_type) %>%
  mutate(Micro = ifelse(Chip_type == "Micro",T,F) %>% sapply(.,list),
         Nano = ifelse(Chip_type == "Nano",T,F) %>% sapply(.,list),
         BiMech = ifelse(Chip_type == "BiMech",T,F) %>% sapply(.,list),
         Titan = ifelse(Chip_type == "Titan",T,F) %>% sapply(.,list),
         Quantum = ifelse(Chip_type == "Quantum",T,F) %>% sapply(.,list),
         Platinum = ifelse(Chip_type == "Platinum",T,F) %>% sapply(.,list),
         PlainChip = ifelse(Chip_type == "PlainChip",T,F) %>% sapply(.,list),
         Classic = ifelse(Chip_type == "Classic",T,F) %>% sapply(.,list))
将按钮添加到plotly_object中,我尝试设置它们,以便根据上面创建的"_filter“数据帧的各个列进行筛选:
plotly_object %>%
  layout(legend = Parts_legend,
         title = "by supplier delta previous month",
         xaxis = list(title = 'Date'),
         yaxis = list(title = 'Chip Volume'),
         updatemenus = list(
           list(
             active = 0,
             type = "dropdown",
             y = 1.1,
             direction = "right",

# See from here:
             buttons = list(

               list(label = "All",
                    method = "restyle",
                    args = list("visible",T)),

               list(label = "Smartphones",
                    method = "restyle",
                    args = list("visible",Parts_product_filter$Smartphones)),

               list(label = "TVs",
                    method = "restyle",
                    args = list("visible",Parts_product_filter$TVs)),

               list(label = "Monitors",
                    method = "restyle",
                    args = list("visible",Parts_product_filter$Monitors)),

               list(label = "Miscellaneous",
                    method = "restyle",
                    args = list("visible",Parts_product_filter$Miscellaneous))
             )
           ),
           list(
             active = 0,
             type = "dropdown",
             y = 1.03,
             direction = "right",
             buttons = list(

               list(label = "All",
                    method = "restyle",
                    args = list("visible",T)),

               list(label = "Micro",
                    method = "restyle",
                    args = list("visible",Parts_chip_type_filter$Micro)),

               list(label = "Nano",
                    method = "restyle",
                    args = list("visible",Parts_chip_type_filter$Nano)),

               list(label = "BiMech",
                    method = "restyle",
                    args = list("visible",Parts_chip_type_filter$BiMech)),

               list(label = "Titan",
                    method = "restyle",
                    args = list("visible",Parts_chip_type_filter$Titan)),

               list(label = "Quantum",
                    method = "restyle",
                    args = list("visible",Parts_chip_type_filter$Quantum)),

               list(label = "Platinum",
                    method = "restyle",
                    args = list("visible",Parts_chip_type_filter$Platinum)),

               list(label = "PlainChip",
                    method = "restyle",
                    args = list("visible",Parts_chip_type_filter$PlainChip)),

               list(label = "Classic",
                    method = "restyle",
                    args = list("visible",Parts_chip_type_filter$Classic))
             )

           )
         )
  )
而这正是行不通的。我一定是把过滤器调错了。我知道,因为当我过滤“产品=电视”和"Chip_type = Nano“的组合时,没有出现任何线条.
https://i.stack.imgur.com/MaJ5r.png
..。尽管有以下数据:
> dat %>% filter(Product == "TVs") %>% filter(Chip_type == "Nano")
# A tibble: 8 x 7
  Date    Supplier    Supplier_text                 order Chip_type Product n
  <chr>   <chr>       <chr>                         <int> <chr>    <chr>   <chr>
1 2019-11 Overall TVs 14373 |    6.0% - Overall TVs     4 Nano     TVs     4643
2 2019-12 Overall TVs 14373 |    6.0% - Overall TVs     4 Nano     TVs     6904
3 2019-11 J           2603 |    5.8% - J               13 Nano     TVs     3
4 2019-12 J           2603 |    5.8% - J               13 Nano     TVs     3
5 2019-11 M           -1711 |  -19.4% - M              16 Nano     TVs     2
6 2019-12 M           -1711 |  -19.4% - M              16 Nano     TVs     1
7 2019-11 O           1315 |   23.6% - O               19 Nano     TVs     2
8 2019-12 O           1315 |   23.6% - O               19 Nano     TVs     1
我真的很期待你的建议,如何设置按钮的可见度按钮正确!
我知道有两个相似的帖子,但集中在多个图上。这很可能是我缺乏技巧,但我无法用所提供的解决方案来解决我的问题,我会感谢您的考虑和帮助!Switch displayed traces via plotly dropdown menu Multiple lines/traces for each button in a Plotly drop down menu in R
类似的东西,但只有一个过滤器,用Python (而不是R)完成:Plotly: How to toggle traces with a button similar to clicking them in legend?
后续工作将是:是否可以选择多个类别,即."Nano“和”经典“,也可能是来自另一个过滤器的”智能手机“和”电视“,同时呢?下面是Python的一篇文章,但不幸的是没有答案:Selecting multiple buttons at once in a plotly graph
提前谢谢你!
用于进口的完整数据集:
<!-- begin snippet: js hide: true -->
dat <- structure(list(Date = c("2019-11", "2019-11", "2019-11", "2019-11",
"2019-11", "2019-11", "2019-11", "2019-11", "2019-12", "2019-12",
"2019-12", "2019-12", "2019-12", "2019-12", "2019-12", "2019-12",
"2019-11", "2019-11", "2019-11", "2019-11", "2019-11", "2019-11",
"2019-11", "2019-11", "2019-12", "2019-12", "2019-12", "2019-12",
"2019-12", "2019-12", "2019-12", "2019-12", "2019-11", "2019-11",
"2019-11", "2019-11", "2019-12", "2019-12", "2019-12", "2019-12",
"2019-11", "2019-11", "2019-11", "2019-11", "2019-11", "2019-11",
"2019-11", "2019-11", "2019-12", "2019-12", "2019-12", "2019-12",
"2019-12", "2019-12", "2019-12", "2019-12", "2019-11", "2019-11",
"2019-11", "2019-11", "2019-12", "2019-12", "2019-12", "2019-12",
"2019-12", "2019-11", "2019-11", "2019-11", "2019-11", "2019-11",
"2019-12", "2019-12", "2019-12", "2019-12", "2019-11", "2019-11",
"2019-11", "2019-11", "2019-11", "2019-12", "2019-12", "2019-12",
"2019-12", "2019-12", "2019-11", "2019-11", "2019-11", "2019-11",
"2019-11", "2019-12", "2019-12", "2019-12", "2019-12", "2019-12",
"2019-12", "2019-11", "2019-11", "2019-12", "2019-12", "2019-11",
"2019-12", "2019-12", "2019-11", "2019-11", "2019-11", "2019-12",
"2019-12", "2019-11", "2019-12", "2019-12", "2019-12", "2019-12",
"2019-11", "2019-11", "2019-12", "2019-12", "2019-11", "2019-11",
"2019-11", "2019-12", "2019-12", "2019-11", "2019-11", "2019-11",
"2019-12", "2019-12", "2019-12", "2019-11", "2019-11", "2019-12",
"2019-12", "2019-12", "2019-12", "2019-11", "2019-11", "2019-11",
"2019-11", "2019-11", "2019-11", "2019-11", "2019-12", "2019-12",
"2019-12", "2019-12", "2019-12", "2019-12", "2019-12", "2019-12",
"2019-11", "2019-11", "2019-12", "2019-12", "2019-12", "2019-12",
"2019-12", "2019-11", "2019-11", "2019-11", "2019-11", "2019-12",
"2019-12", "2019-11", "2019-11", "2019-11", "2019-11", "2019-12",
"2019-12", "2019-12", "2019-12", "2019-11", "2019-11", "2019-11",
"2019-12", "2019-12", "2019-12", "2019-11", "2019-12", "2019-12",
"2019-11", "2019-11", "2019-12", "2019-12"), Supplier = c("Overall Smartphones",
"Overall Smartphones", "Overall Smartphones", "Overall Smartphones",
"Overall Smartphones", "Overall Smartphones", "Overall Smartphones",
"Overall Smartphones", "Overall Smartphones", "Overall Smartphones",
"Overall Smartphones", "Overall Smartphones", "Overall Smartphones",
"Overall Smartphones", "Overall Smartphones", "Overall Smartphones",
"Overall Monitors", "Overall Monitors", "Overall Monitors", "Overall Monitors",
"Overall Monitors", "Overall Monitors", "Overall Monitors", "Overall Monitors",
"Overall Monitors", "Overall Monitors", "Overall Monitors", "Overall Monitors",
"Overall Monitors", "Overall Monitors", "Overall Monitors", "Overall Monitors",
"A", "A", "A", "A", "A", "A", "A", "A", "Overall TVs", "Overall TVs",
"Overall TVs", "Overall TVs", "Overall TVs", "Overall TVs", "Overall TVs",
"Overall TVs", "Overall TVs", "Overall TVs", "Overall TVs", "Overall TVs",
"Overall TVs", "Overall TVs", "Overall TVs", "Overall TVs", "B",
"B", "B", "B", "B", "B", "B", "B", "B", "C", "C", "C", "C", "C",
"C", "C", "C", "C", "D", "D", "D", "D", "D", "D", "D", "D", "D",
"D", "E", "E", "E", "E", "E", "E", "E", "E", "E", "E", "E", "F",
"F", "F", "F", "G", "G", "G", "H", "H", "H", "H", "H", "I", "I",
"I", "I", "I", "J", "J", "J", "J", "K", "K", "K", "K", "K", "L",
"L", "L", "L", "L", "L", "M", "M", "M", "M", "M", "M", "Overall Miscellaneous",
"Overall Miscellaneous", "Overall Miscellaneous", "Overall Miscellaneous",
"Overall Miscellaneous", "Overall Miscellaneous", "Overall Miscellaneous",
"Overall Miscellaneous", "Overall Miscellaneous", "Overall Miscellaneous",
"Overall Miscellaneous", "Overall Miscellaneous", "Overall Miscellaneous",
"Overall Miscellaneous", "Overall Miscellaneous", "N", "N", "N",
"N", "N", "N", "N", "O", "O", "O", "O", "O", "O", "P", "P", "P",
"P", "P", "P", "P", "P", "C", "C", "C", "C", "C", "C", "Q", "Q",
"Q", "R", "R", "R", "S"), Supplier_text = c("94757 |   17.9% - Overall Smartphones",
"94757 |   17.9% - Overall Smartphones", "94757 |   17.9% - Overall Smartphones",
"94757 |   17.9% - Overall Smartphones", "94757 |   17.9% - Overall Smartphones",
"94757 |   17.9% - Overall Smartphones", "94757 |   17.9% - Overall Smartphones",
"94757 |   17.9% - Overall Smartphones", "94757 |   17.9% - Overall Smartphones",
"94757 |   17.9% - Overall Smartphones", "94757 |   17.9% - Overall Smartphones",
"94757 |   17.9% - Overall Smartphones", "94757 |   17.9% - Overall Smartphones",
"94757 |   17.9% - Overall Smartphones", "94757 |   17.9% - Overall Smartphones",
"94757 |   17.9% - Overall Smartphones", "-33239 |  -37.8% - Overall Monitors",
"-33239 |  -37.8% - Overall Monitors", "-33239 |  -37.8% - Overall Monitors",
"-33239 |  -37.8% - Overall Monitors", "-33239 |  -37.8% - Overall Monitors",
"-33239 |  -37.8% - Overall Monitors", "-33239 |  -37.8% - Overall Monitors",
"-33239 |  -37.8% - Overall Monitors", "-33239 |  -37.8% - Overall Monitors",
"-33239 |  -37.8% - Overall Monitors", "-33239 |  -37.8% - Overall Monitors",
"-33239 |  -37.8% - Overall Monitors", "-33239 |  -37.8% - Overall Monitors",
"-33239 |  -37.8% - Overall Monitors", "-33239 |  -37.8% - Overall Monitors",
"-33239 |  -37.8% - Overall Monitors", "-17385 |  -88.0% - A",
"-17385 |  -88.0% - A", "-17385 |  -88.0% - A", "-17385 |  -88.0% - A",
"-17385 |  -88.0% - A", "-17385 |  -88.0% - A", "-17385 |  -88.0% - A",
"-17385 |  -88.0% - A", "14373 |    6.0% - Overall TVs", "14373 |    6.0% - Overall TVs",
"14373 |    6.0% - Overall TVs", "14373 |    6.0% - Overall TVs",
"14373 |    6.0% - Overall TVs", "14373 |    6.0% - Overall TVs",
"14373 |    6.0% - Overall TVs", "14373 |    6.0% - Overall TVs",
"14373 |    6.0% - Overall TVs", "14373 |    6.0% - Overall TVs",
"14373 |    6.0% - Overall TVs", "14373 |    6.0% - Overall TVs",
"14373 |    6.0% - Overall TVs", "14373 |    6.0% - Overall TVs",
"14373 |    6.0% - Overall TVs", "14373 |    6.0% - Overall TVs",
"-8387 |  -80.6% - B", "-8387 |  -80.6% - B", "-8387 |  -80.6% - B",
"-8387 |  -80.6% - B", "-8387 |  -80.6% - B", "-8387 |  -80.6% - B",
"-8387 |  -80.6% - B", "-8387 |  -80.6% - B", "-8387 |  -80.6% - B",
"5701 |   79.2% - C", "5701 |   79.2% - C", "5701 |   79.2% - C",
"5701 |   79.2% - C", "5701 |   79.2% - C", "5701 |   79.2% - C",
"5701 |   79.2% - C", "5701 |   79.2% - C", "5701 |   79.2% - C",
"5155 |   49.2% - D", "5155 |   49.2% - D", "5155 |   49.2% - D",
"5155 |   49.2% - D", "5155 |   49.2% - D", "5155 |   49.2% - D",
"5155 |   49.2% - D", "5155 |   49.2% - D", "5155 |   49.2% - D",
"5155 |   49.2% - D", "4977 |   95.4% - E", "4977 |   95.4% - E",
"4977 |   95.4% - E", "4977 |   95.4% - E", "4977 |   95.4% - E",
"4977 |   95.4% - E", "4977 |   95.4% - E", "4977 |   95.4% - E",
"4977 |   95.4% - E", "4977 |   95.4% - E", "4977 |   95.4% - E",
"3676 |18380.0% - F", "3676 |18380.0% - F", "3676 |18380.0% - F",
"3676 |18380.0% - F", "-3132 |  -99.4% - G", "-3132 |  -99.4% - G",
"-3132 |  -99.4% - G", "3065 |   33.6% - H", "3065 |   33.6% - H",
"3065 |   33.6% - H", "3065 |   33.6% - H", "3065 |   33.6% - H",
"-2854 |  -56.1% - I", "-2854 |  -56.1% - I", "-2854 |  -56.1% - I",
"-2854 |  -56.1% - I", "-2854 |  -56.1% - I", "2603 |    5.8% - J",
"2603 |    5.8% - J", "2603 |    5.8% - J", "2603 |    5.8% - J",
"2564 |   39.4% - K", "2564 |   39.4% - K", "2564 |   39.4% - K",
"2564 |   39.4% - K", "2564 |   39.4% - K", "1843 |  334.5% - L",
"1843 |  334.5% - L", "1843 |  334.5% - L", "1843 |  334.5% - L",
"1843 |  334.5% - L", "1843 |  334.5% - L", "-1711 |  -19.4% - M",
"-1711 |  -19.4% - M", "-1711 |  -19.4% - M", "-1711 |  -19.4% - M",
"-1711 |  -19.4% - M", "-1711 |  -19.4% - M", "-1662 |  -30.0% - Overall Miscellaneous",
"-1662 |  -30.0% - Overall Miscellaneous", "-1662 |  -30.0% - Overall Miscellaneous",
"-1662 |  -30.0% - Overall Miscellaneous", "-1662 |  -30.0% - Overall Miscellaneous",
"-1662 |  -30.0% - Overall Miscellaneous", "-1662 |  -30.0% - Overall Miscellaneous",
"-1662 |  -30.0% - Overall Miscellaneous", "-1662 |  -30.0% - Overall Miscellaneous",
"-1662 |  -30.0% - Overall Miscellaneous", "-1662 |  -30.0% - Overall Miscellaneous",
"-1662 |  -30.0% - Overall Miscellaneous", "-1662 |  -30.0% - Overall Miscellaneous",
"-1662 |  -30.0% - Overall Miscellaneous", "-1662 |  -30.0% - Overall Miscellaneous",
"-1439 |  -95.6% - N", "-1439 |  -95.6% - N", "-1439 |  -95.6% - N",
"-1439 |  -95.6% - N", "-1439 |  -95.6% - N", "-1439 |  -95.6% - N",
"-1439 |  -95.6% - N", "1315 |   23.6% - O", "1315 |   23.6% - O",
"1315 |   23.6% - O", "1315 |   23.6% - O", "1315 |   23.6% - O",
"1315 |   23.6% - O", "193 |  232.5% - P", "193 |  232.5% - P",
"193 |  232.5% - P", "193 |  232.5% - P", "193 |  232.5% - P",
"193 |  232.5% - P", "193 |  232.5% - P", "193 |  232.5% - P",
"-152 |  -38.1% - C", "-152 |  -38.1% - C", "-152 |  -38.1% - C",
"-152 |  -38.1% - C", "-152 |  -38.1% - C", "-152 |  -38.1% - C",
"-98 |  -79.7% - Q", "-98 |  -79.7% - Q", "-98 |  -79.7% - Q",
"92 | 3066.7% - R", "92 | 3066.7% - R", "92 | 3066.7% - R", "-70 |  -90.9% - S"
), order = c(1L, 1L, 1L, 1L, 1L, 1L, 1L, 1L, 1L, 1L, 1L,
1L, 1L, 1L, 1L, 1L, 2L, 2L, 2L, 2L, 2L, 2L, 2L, 2L, 2L, 2L, 2L,
2L, 2L, 2L, 2L, 2L, 3L, 3L, 3L, 3L, 3L, 3L, 3L, 3L, 4L, 4L, 4L,
4L, 4L, 4L, 4L, 4L, 4L, 4L, 4L, 4L, 4L, 4L, 4L, 4L, 5L, 5L, 5L,
5L, 5L, 5L, 5L, 5L, 5L, 6L, 6L, 6L, 6L, 6L, 6L, 6L, 6L, 6L, 7L,
7L, 7L, 7L, 7L, 7L, 7L, 7L, 7L, 7L, 8L, 8L, 8L, 8L, 8L, 8L, 8L,
8L, 8L, 8L, 8L, 9L, 9L, 9L, 9L, 10L, 10L, 10L, 11L, 11L, 11L,
11L, 11L, 12L, 12L, 12L, 12L, 12L, 13L, 13L, 13L, 13L, 14L, 14L,
14L, 14L, 14L, 15L, 15L, 15L, 15L, 15L, 15L, 16L, 16L, 16L, 16L,
16L, 16L, 17L, 17L, 17L, 17L, 17L, 17L, 17L, 17L, 17L, 17L, 17L,
17L, 17L, 17L, 17L, 18L, 18L, 18L, 18L, 18L, 18L, 18L, 19L, 19L,
19L, 19L, 19L, 19L, 20L, 20L, 20L, 20L, 20L, 20L, 20L, 20L, 21L,
21L, 21L, 21L, 21L, 21L, 22L, 22L, 22L, 23L, 23L, 23L, 24L),
    Chip_type = c("Micro", "Nano", "BiMech", "Titan", "Quantum",
    "Platinum", "PlainChip", "Classic", "Micro", "Nano", "BiMech",
    "Titan", "Quantum", "Platinum", "PlainChip", "Classic", "Micro",
    "Nano", "BiMech", "Titan", "Quantum", "Platinum", "PlainChip",
    "Classic", "Micro", "Nano", "BiMech", "Titan", "Quantum",
    "Platinum", "PlainChip", "Classic", "Titan", "Platinum",
    "Quantum", "Nano", "Titan", "Platinum", "Nano", "PlainChip",
    "Micro", "Nano", "BiMech", "Titan", "Quantum", "Platinum",
    "PlainChip", "Classic", "Micro", "Nano", "BiMech", "Titan",
    "Quantum", "Platinum", "PlainChip", "Classic", "Titan", "Platinum",
    "Quantum", "Nano", "Titan", "Nano", "Quantum", "Platinum",
    "PlainChip", "PlainChip", "Platinum", "Nano", "Quantum",
    "Classic", "PlainChip", "Platinum", "Nano", "Quantum", "PlainChip",
    "Platinum", "Quantum", "Nano", "Classic", "PlainChip", "Nano",
    "Platinum", "Quantum", "Classic", "PlainChip", "Quantum",
    "Platinum", "Classic", "Nano", "PlainChip", "Quantum", "Platinum",
    "Nano", "Classic", "BiMech", "Titan", "Nano", "Titan", "Quantum",
    "Titan", "Titan", "Platinum", "PlainChip", "Nano", "Classic",
    "PlainChip", "Nano", "PlainChip", "PlainChip", "Quantum",
    "Nano", "Classic", "Titan", "Nano", "Titan", "Nano", "Platinum",
    "PlainChip", "Quantum", "Platinum", "PlainChip", "Titan",
    "PlainChip", "Platinum", "Titan", "PlainChip", "Platinum",
    "Titan", "Nano", "Titan", "Platinum", "Nano", "PlainChip",
    "Nano", "BiMech", "Titan", "Quantum", "Platinum", "PlainChip",
    "Classic", "Micro", "Nano", "BiMech", "Titan", "Quantum",
    "Platinum", "PlainChip", "Classic", "Titan", "Quantum", "Titan",
    "Nano", "Quantum", "Platinum", "PlainChip", "Titan", "Quantum",
    "Nano", "Micro", "Titan", "Nano", "Platinum", "Quantum",
    "Nano", "Classic", "Quantum", "Platinum", "Nano", "Classic",
    "Classic", "Quantum", "Nano", "Classic", "Quantum", "Nano",
    "Quantum", "Quantum", "Nano", "Quantum", "Nano", "Quantum",
    "Titan"), Product = c("Smartphones", "Smartphones", "Smartphones",
    "Smartphones", "Smartphones", "Smartphones", "Smartphones",
    "Smartphones", "Smartphones", "Smartphones", "Smartphones",
    "Smartphones", "Smartphones", "Smartphones", "Smartphones",
    "Smartphones", "Monitors", "Monitors", "Monitors", "Monitors",
    "Monitors", "Monitors", "Monitors", "Monitors", "Monitors",
    "Monitors", "Monitors", "Monitors", "Monitors", "Monitors",
    "Monitors", "Monitors", "Smartphones", "Smartphones", "Smartphones",
    "Smartphones", "Smartphones", "Smartphones", "Smartphones",
    "Smartphones", "TVs", "TVs", "TVs", "TVs", "TVs", "TVs",
    "TVs", "TVs", "TVs", "TVs", "TVs", "TVs", "TVs", "TVs", "TVs",
    "TVs", "Monitors", "Monitors", "Monitors", "Monitors", "Monitors",
    "Monitors", "Monitors", "Monitors", "Monitors", "Smartphones",
    "Smartphones", "Smartphones", "Smartphones", "Smartphones",
    "Smartphones", "Smartphones", "Smartphones", "Smartphones",
    "Smartphones", "Smartphones", "Smartphones", "Smartphones",
    "Smartphones", "Smartphones", "Smartphones", "Smartphones",
    "Smartphones", "Smartphones", "Smartphones", "Smartphones",
    "Smartphones", "Smartphones", "Smartphones", "Smartphones",
    "Smartphones", "Smartphones", "Smartphones", "Smartphones",
    "Smartphones", "Monitors", "Monitors", "Monitors", "Monitors",
    "Monitors", "Monitors", "Monitors", "Monitors", "Monitors",
    "Monitors", "Monitors", "Monitors", "Monitors", "Monitors",
    "Monitors", "Monitors", "Monitors", "TVs", "TVs", "TVs",
    "TVs", "Smartphones", "Smartphones", "Smartphones", "Smartphones",
    "Smartphones", "TVs", "TVs", "TVs", "TVs", "TVs", "TVs",
    "TVs", "TVs", "TVs", "TVs", "TVs", "TVs", "Miscellaneous",
    "Miscellaneous", "Miscellaneous", "Miscellaneous", "Miscellaneous",
    "Miscellaneous", "Miscellaneous", "Miscellaneous", "Miscellaneous",
    "Miscellaneous", "Miscellaneous", "Miscellaneous", "Miscellaneous",
    "Miscellaneous", "Miscellaneous", "Monitors", "Monitors",
    "Monitors", "Monitors", "Monitors", "Monitors", "Monitors",
    "TVs", "TVs", "TVs", "TVs", "TVs", "TVs", "Miscellaneous",
    "Miscellaneous", "Miscellaneous", "Miscellaneous", "Miscellaneous",
    "Miscellaneous", "Miscellaneous", "Miscellaneous", "Miscellaneous",
    "Miscellaneous", "Miscellaneous", "Miscellaneous", "Miscellaneous",
    "Miscellaneous", "Miscellaneous", "Miscellaneous", "Miscellaneous",
    "Miscellaneous", "Miscellaneous", "Miscellaneous", "Miscellaneous"
    ), n = c("106", "16920", "61216", "363698", "50797", "52715",
    "174342", "9319", "92", "16928", "40920", "270963", "48605",
    "34068", "114333", "4024", "3", "1536", "6793", "45146",
    "7922", "5359", "27390", "1131", "12", "1311", "5431", "48107",
    "6230", "5133", "21161", "505", "3619", "13", "2", "1", "19720",
    "13", "10", "4", "96", "4643", "14534", "166664", "17178",
    "17489", "30048", "5010", "96", "6904", "10463", "158060",
    "15864", "20149", "24173", "2390", "12102", "7", "2", "1",
    "10390", "5", "4", "2", "1", "11036", "329", "224", "2",
    "2", "6936", "176", "85", "1", "15335", "55", "53", "48",
    "14", "10292", "86", "47", "32", "11", "6559", "667", "631",
    "419", "416", "4416", "336", "285", "105", "74", "2", "18",
    "2", "18", "2", "86", "3151", "1", "14682", "77", "10", "9098",
    "26", "2833", "5083", "2", "1", "1", "41051", "3", "45233",
    "3", "10763", "44", "2", "6508", "2", "370", "265", "6",
    "461", "86", "4", "5996", "2", "8826", "2", "1", "1", "503",
    "5", "79", "3348", "742", "199", "989", "1", "473", "11",
    "152", "3681", "363", "54", "804", "1702", "1", "1500", "2",
    "1", "1", "1", "4868", "5", "2", "1", "5573", "1", "312",
    "113", "3", "3", "42", "30", "6", "5", "371", "53", "19",
    "312", "64", "23", "97", "121", "2", "3", "1", "3", "77")), row.names = c(NA,
-182L), class = c("tbl_df", "tbl", "data.frame"))#1:https://i.stack.imgur.com/bDTWZ.png #2:https://i.stack.imgur.com/MaJ5r.png
回答 1
Stack Overflow用户
发布于 2022-03-16 16:46:32
你创建了一个182 T或F的列表,但是你真正需要的是一个24 T或F的列表,因为有24行,24组,24条痕迹,是否会被巧妙地显示出来。
首先,您在按数据中的字段对绘图进行分组方面做得很好。我有第一个情节的另一个变体--它只调用一次plot_ly,并且仍然创建所有24个跟踪,就像您的循环一样。
首先,我制作了Supplier_text和有序因子,这样我就可以控制传奇的顺序。
# this will keep the legend order in order
d2 <- dat %>%
  mutate(Supplier_text = ordered(Supplier_text,
                                 levels = rev(unique(dat$Supplier_text))))
然后我创造了24条痕迹。
(plt <- plot_ly(data = d2,
                x = ~Date,
                y = ~n,
                color = ~Supplier_text,
                type = "scatter",
                mode = "lines"))
然后我改变了你为产品创建的过滤器。你有24条痕迹,现在你有24 T或F用于这个过滤器。
# changed this so it is one for each trace, not one for each row
Parts_product_filter <- d2 %>% select(Supplier_text, Product) %>%
  mutate(Smartphones = ifelse(Product == "Smartphones",T,F) %>% sapply(.,list),
         TVs = ifelse(Product == "TVs",T, F) %>% sapply(.,list),
         Monitors = ifelse(Product == "Monitors",T,F) %>% sapply(.,list),
         Miscellaneous = ifelse(Product == "Miscellaneous",T,F) %>% sapply(.,list)) %>%
unique()代码的其他部分保持不变,但plotly_object的对象名除外,现在在连接地块的任何调用中都是plt (两个布局和Chip_type过滤器)。
更新替换
这只包括“两个”按钮。
我在评论中回答了你的问题,并意识到有一些痕迹是不对的。所以当我修正这个问题时,我也增加了悬停,这样你就可以想象出为什么你会得到垂直线。记住,n是一个因素。除了颜色之外,Plotly不知道您想要连接到右边哪个值的左n值。
当您将n设置为一个数字字段时,plotly将将这些值相加在一起(除非您提供了一些其他方式来划分内容)。可悲的是电脑无法读取心灵..。但是..。
我添加了一个悬停模板。如果你在传说中看到一些不在情节里的东西,有些事情plotly不知道该如何处理。如果你在地图上悬停,你甚至可能得到一个值,但没有线。最后,我有一些例子。
d2 <- dat %>%
  mutate(Supplier_text = ordered(Supplier_text,
                                 levels = rev(unique(dat$Supplier_text))),
         Product = ordered(Product,
                           levels = sort(unique(dat$Product))),
         Chip_type = ordered(Chip_type,
                             levels = sort(unique(dat$Chip_type))),
         n = as.numeric(dat$n) %>% sort(decreasing = T) %>%
           as.character() %>% ordered(., levels = unique(.))) %>%
  arrange(n)
所有的痕迹:
#------------- base plot ----------------
(plt <- d2 %>%
    plot_ly(x = ~Date,
            y = ~n,
            color = ~Supplier_text,
            type = 'scatter',
            mode = 'lines',
            text = ~Product,
            hovertext = ~Chip_type,
            visible = T
))
我意识到,当我在数痕迹时,当情节呈现时,我没有得到45条痕迹,我得到了更多的线索!只有基本的地块才有24条痕迹。有基地和组合按钮,有127个痕迹。
我就是这样想出来的,并验证了修正的正确性。
#------------- trace count ----------------
# I used length(plt$x$attrs) to confirm the number of traces
       # -- that was a mistake!
# collect data, since it's not in the plotly object (errr)
pj = plotly_json(plt)

# read the JSON back
pjj = jsonlite::fromJSON(pj$x$data)

# number of traces:
nrow(pjj$data)
# [1] 24  # one trace for each color
这种组合的痕迹是:
#------------- add combination traces ----------------
# each of the possible button groups when both filters are opted
cmb = expand.grid(Product = levels(d2$Product),
                  Chip_type = levels(d2$Chip_type))
# create combo traces
invisible(
  lapply(1:nrow(cmb),  # filter for both
         function(x){
           d3 = d2 %>% filter(Product == cmb[x, 1] %>% toString(),
                              Chip_type == cmb[x, 2] %>% toString()) %>%
             droplevels
           if(nrow(d3) < 1) {
             print(cmb[x, ]) # let me know what was skipped
             return()        # if no rows, don't make the trace
           } # end if
           plt <<- plt %>%
             add_trace(inherit = F,
                       data = d2 %>%
                         filter(Product == cmb[x, 1] %>% toString(),
                                Chip_type == cmb[x, 2] %>% toString()),
                       x = ~Date, y = ~n,
                       color = ~Supplier_text,
                       type = 'scatter',
                       mode = 'lines',
                       text = ~Product,
                       hovertext = ~Chip_type,
                       hovertemplate = paste0("Products: %{text}",
                                              "\nChips: %{hovertext}"),
                       visible = F #,
                       #inherit = F
             )
         })
)
cmb # validate
现在检查跟踪的数量:
#------------- combination traces updated trace count ----------------
# collect count
pj = plotly_json(plt)

# read the JSON back
pjj = jsonlite::fromJSON(pj$x$data)

# number of traces:
nrow(pjj$data)
# [1] 127  # whoa!
从跟踪中创建数据,以确保T/F是正确的
#------------- trace data frame ----------------
# create data frame of the JSON content so that traces can be match with combos
plt.df = data.frame(nm = pjj$data$name, # this is Supplier_text
                    # valCount is the number of observations in the trace
                    valCount = unlist(map(pjj$data$x, ~length(.x))),
                    # whether it's visible (is it all or not?)
                    vis = pjj$data$visible)
# inspect what you expect
tail(plt.df)
按钮组合部分
#------------- set up for button for combos ----------------
tracs = d2 %>%
  group_by(Product, Chip_type, Supplier_text) %>%
  summarise(ct = n(), .groups = "drop") %>%
  mutate(traces = 25:127)

# is the order the same in the plot?
tail(tracs, 10)

tail(plt.df, 10) # definitely not!

# check?
tracs %>% arrange(Chip_type) %>% tail(10)
     # that's the right order

# update tracs' order
tracs <- tracs %>% arrange(Chip_type) %>%
  mutate(traces = 25:nrow(plt.df)) # fix trace assignment

# double-check!
plt.df[25:35,]
tracs[1:11,]
# they aren't the same, but plotting groups are

# adjust cmb to be ordered before id trace to group combos
cmb <- cmb %>% arrange(Chip_type)
现在数据是对齐的(按顺序排列),我们需要准确地找到哪些跟踪与哪些组匹配。组中的每种颜色都有一个痕迹(也就是说,如果Misc土卫六有3种不同颜色的5 in/ 5,那么Misc土卫六就会有三条痕迹。)
#--------------- collect group to trace number ----------------
# between cmb, d2, and the traces, the three vars - product, chip, and
# supplier text are ordered factors so the order will be the same
cmbo = invisible(
  lapply(1:nrow(cmb),
         function(x){
           rs = tracs %>% filter(Product == cmb[x, 1] %>% toString(),
                                 Chip_type == cmb[x, 2] %>% toString()) %>%
             select(traces) %>% unlist() %>% unique(use.names = F)
           list(traces = rs)
           }) %>% setNames(paste0(cmb[, 1], " ", cmb[, 2])) # add the names
)# 32 start and stop points for the 103 traces

# check
cmbo[1:6]
现在可以编写按钮布局代码:
#---------------------- the button ----------------------
# now for the buttons...finally
# create the empty
raw_v <- rep(F, nrow(plt.df))

cButton <-
  lapply(1:length(cmbo),
         function(x){
           traces <- cmbo[[x]][[1]] %>% unlist()
           raw_v[traces] <- T
           as.list(unlist(raw_v))
         }) %>% setNames(names(cmbo))
# validate
length(cButton[[1]])
# [1] 127
length(cButton)
# [1] 32

# looks good
cmbBtn2 = lapply(1:length(cButton),
                 function(x){
                   label = names(cButton)[x] %>% gsub("\\.", " ", x = .)
                   method = "restyle"
                   args = list("visible", cButton[[x]])
                   list(label = label, method = method, args = args)
})按钮的all部分
#------------- set up button for "all" ----------------
all = list(list(label = "All",
                method = "restyle",
                args = list("visible",
                            as.list(unlist(
                              c(rep(T, 24),
                                rep(F, nrow(plt.df) - 24)
                                )))) # end args
                )) # end list list
现在把它们放在一起:
#---------------------- the layout ----------------------
Parts_legend <- list(
  font = list(
    family = "sans-serif",
    size = 12,
    color = "#000"),
  title = list(text="<b> Delta previous month by Supplier - Absolute </b>"),
  bgcolor = "#E2E2E2",
  bordercolor = "#FFFFFF",
  borderwidth = 2,
  layout.legend = "constant",
  traceorder = "grouped")


plt %>%
  layout(legend = Parts_legend,
         title = "by supplier delta previous month",
         xaxis = list(title = 'Date'),
         yaxis = list(title = 'Chip Volume'),
         margin = list(l = 120, t = 100),
         updatemenus = list(
           list(
             active = 0,
             type = "dropdown",
             y = 1.2,
             direction = "down",
             buttons = append(all, cmbBtn2)))
  ) # end layout
一些支票:
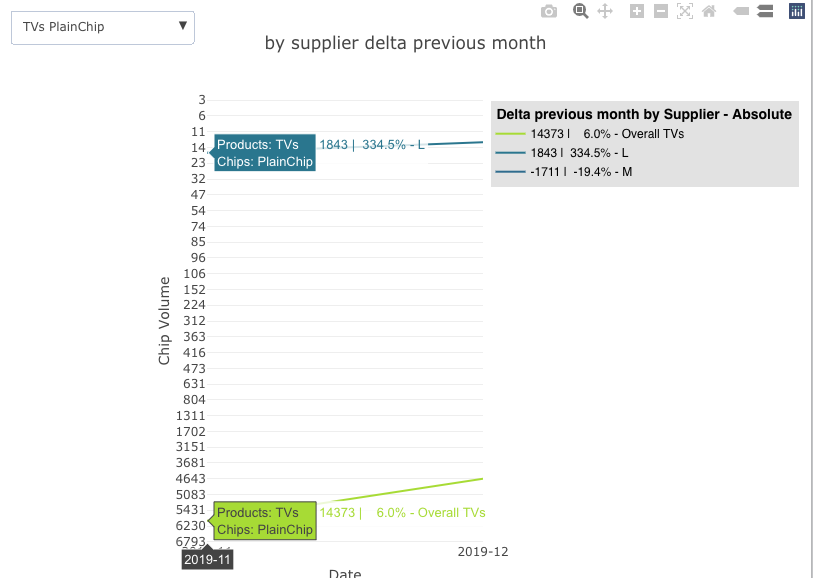
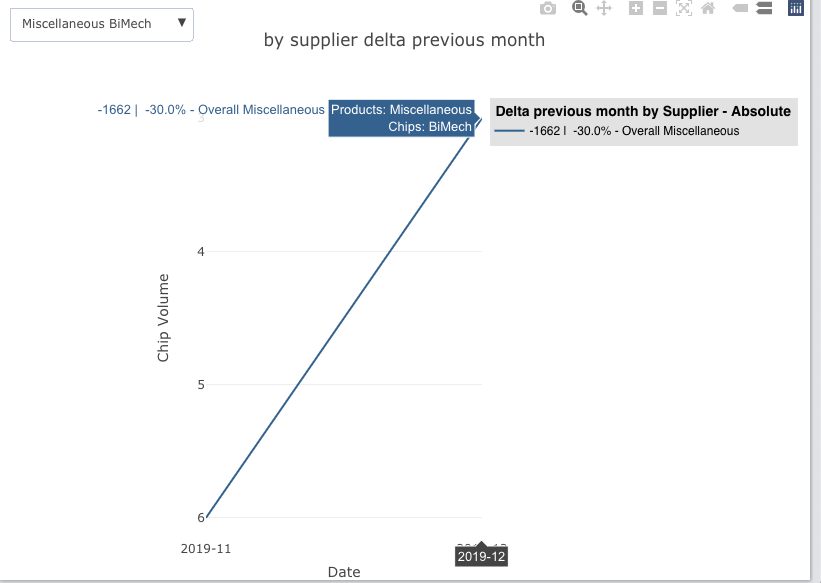
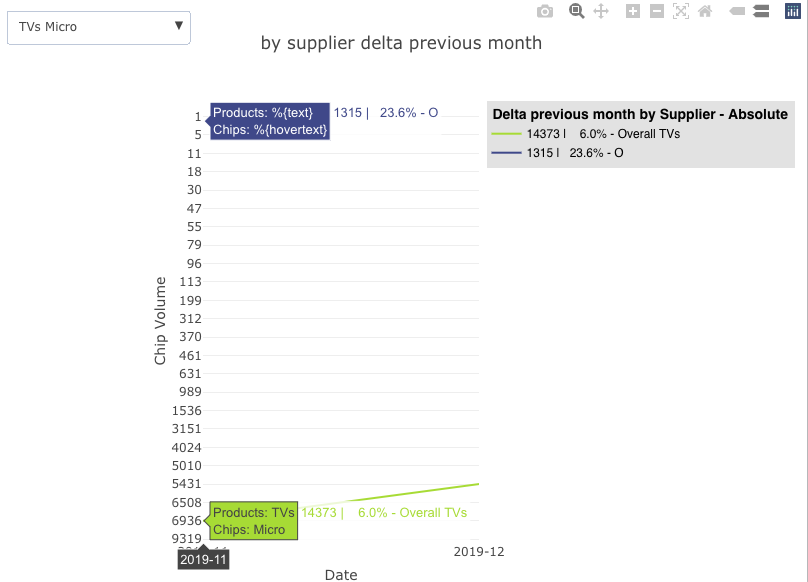
# check some of these for accuracy
d2 %>% filter(Product == "TVs", Chip_type == "PlainChip") # correct
d2 %>% filter(Product == "Miscellaneous", Chip_type == "BiMech") # correct
d2 %>% filter(Product == "Monitors", Chip_type == "Classic") # NOT right!
                    # there are 2 in and 2 out, but 1 in and 1 out match,
                    # the other's are different colors, so the line's not drawn
d2 %>% filter(Product == "TVs", Chip_type == "Micro") # not correct;
                    # that's because there is more in than out

最后一件事,我终于停下来了!垂直线--我放大了“全部”。这里有相同情节、相同缩放、相同准水平线、相同垂直线的多个视图:
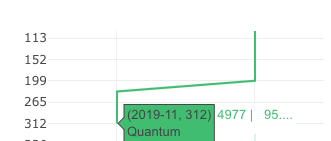
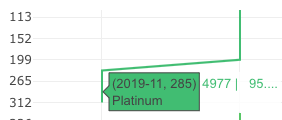

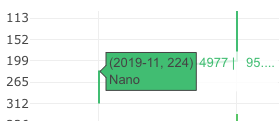
plotly所拥有的,比方说-规则,是x,y和颜色。它不关心其他数据,您没有这样绑定它(嗯,我没有)。
https://stackoverflow.com/questions/71485870
复制相似问题
腾讯云开发者
