
在GGplot2中向不同大小和形状的点添加边框
在GGplot2中向不同大小和形状的点添加边框
提问于 2022-03-21 12:11:54
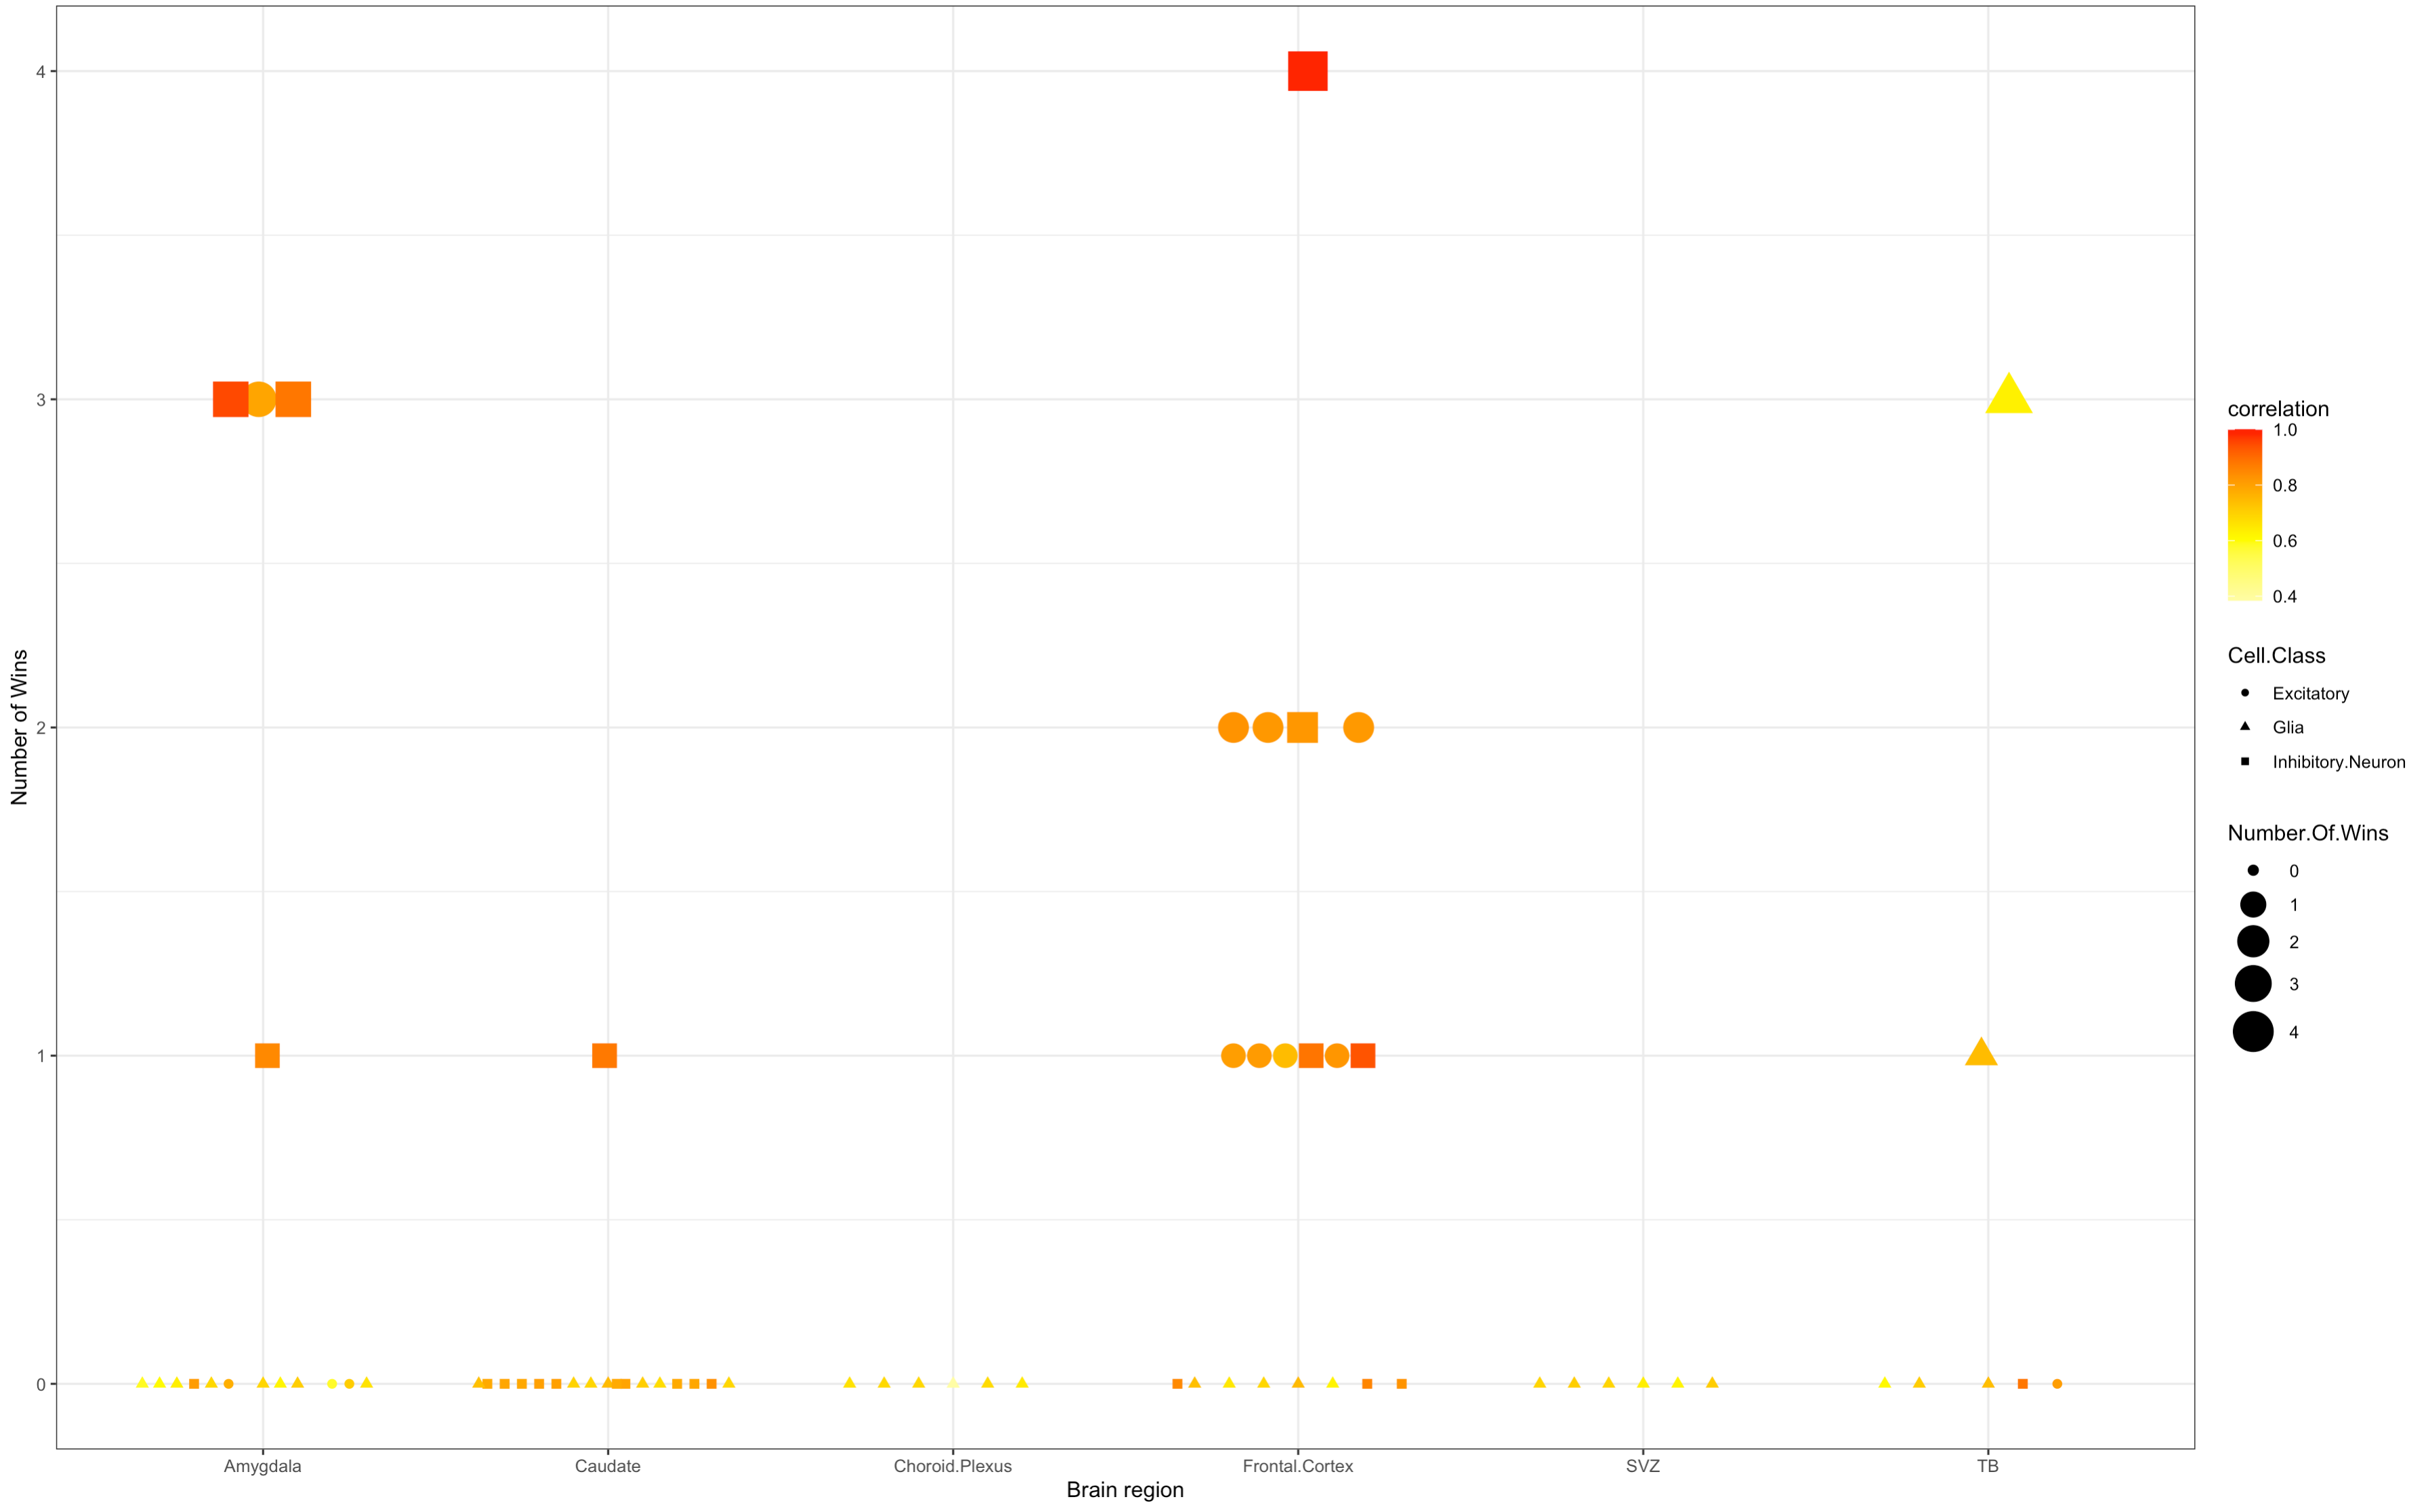
我想绘制一个散点图,其中的点是不同的形状和大小。重要的是,我希望每一个形状周围都有黑色边框。数据格式如下:
> dput(human.correlations[1:5, c(2:5)])
structure(list(variable = c("Caudate.Astrocytes", "Caudate.dSPNs_eccentric",
"Caudate.dSPNs_matrix", "Caudate.dSPNs_patch", "Caudate.Endothelia1"
), correlation = c(0.746433126, 0.80268901, 0.783305333, 0.790514121,
0.706648893), Number.Of.Wins = c(0L, 0L, 0L, 0L, 0L), Region = c("Caudate",
"Caudate", "Caudate", "Caudate", "Caudate")), row.names = c(NA,
5L), class = "data.frame")


mid <- 0.6 #set the midpoint


#scatterplot of figure
ggplot(human.correlations, aes(y=Number.Of.Wins, x=Region, color = correlation, shape = Cell.Class, size=Number.Of.Wins))+
  geom_quasirandom(groupOnX=TRUE)+
  scale_color_gradient2(midpoint=mid, low="white", mid="yellow", high="red")+
  scale_size(range = c(2,9))+
  theme_bw()+
  ylab("Number of Wins")+
  xlab("Brain region")
我该怎么做?
回答 2
Stack Overflow用户
回答已采纳
发布于 2022-03-21 12:31:04
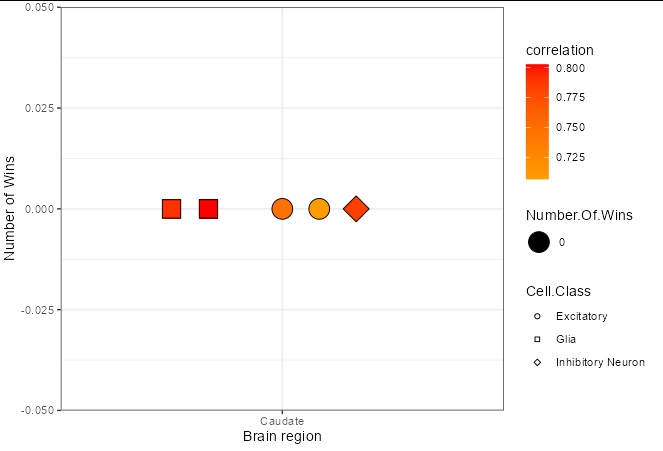
您需要将颜色美学更改为填充美学,并使用形状21、22、23,这些形状都是采用填充和颜色两种形式的轮廓。将它们的颜色设置为黑色以获得黑色的轮廓。
请注意,示例数据帧缺少了实际映射到形状的Cell.Class列,因此我添加了一个随机列:
# Make example reproducible
human.correlations$Cell.Class <- c("Excitatory", "Glia", "Inhibitory Neuron",
                                   "Glia", "Excitatory")
然后是绘图代码。
library(ggplot2)
library(ggbeeswarm)

ggplot(human.correlations, aes(y = Number.Of.Wins, x = Region, fill = correlation,
                               shape = Cell.Class, size = Number.Of.Wins)) +
  geom_quasirandom(groupOnX = TRUE, color = 'black') +
  scale_fill_gradient2(midpoint = mid, low = "white", mid = "yellow", high = "red") +
  scale_size(range = c(2, 9)) +
  scale_shape_manual(values = c(21, 22, 23)) +
  theme_bw() +
  ylab("Number of Wins") +
  xlab("Brain region")
Stack Overflow用户
发布于 2022-03-21 12:42:55
我以前没有见过geom_quasirandom,但可能需要您使用colour参数,所以请尝试
geom_quasirandom(groupOnX=TRUE, colour = "black")然后重新运行。如果此操作不起作用,则该函数选择的形状不具有可更改的边框。如果是这样,您将需要手动选择这些。
页面原文内容由Stack Overflow提供。腾讯云小微IT领域专用引擎提供翻译支持
原文链接:
https://stackoverflow.com/questions/71557448
复制相关文章
相似问题
腾讯云开发者
