
python操作数据文件
python操作数据文件
提问于 2022-03-23 11:52:14
我仍在试图找到一种方法,并考虑最好的方式开始。不幸的是,我还没有在网上找到任何可比的东西-也许你可以给我一些提示。
为此,我创建了一个小示例数据集;初始情况:
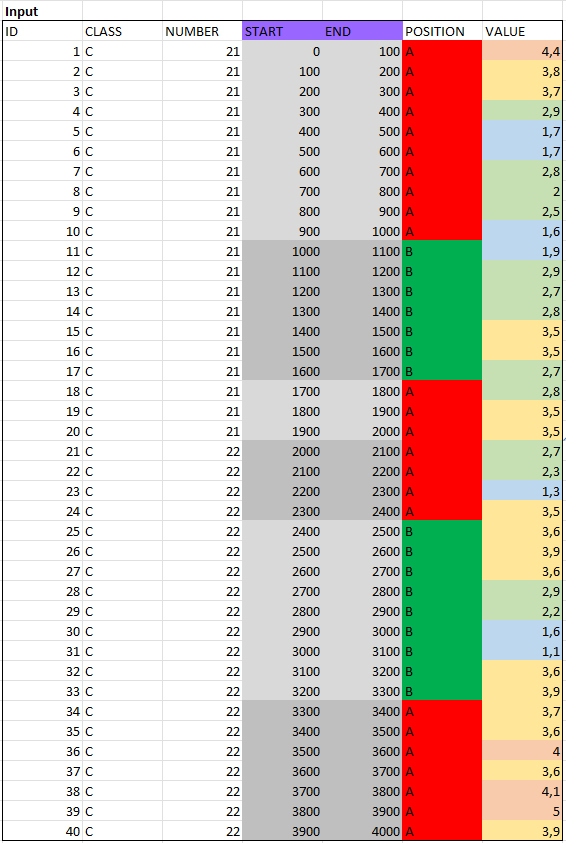
我想以某种方式准备数据,这样类的长度(C1到C4)就会不断地加起来--而位置字段和数字字段则是“分离”。我想有一幅画能更好地描述它:
长度与(结束-开始)相应地确定。
下面是Excel文件:https://easyupload.io/vb86lh点击这里的按钮(而不是其他东西):

到目前为止,这是我的开始:
import pandas as pd

d = {
    'ID': [1, 2, 3, 4, 5, 6, 7, 8, 9, 10, 11, 12, 13, 14, 15, 16, 17, 18, 19, 20, 21, 22, 23, 24, 25, 26, 27, 28, 29, 30, 31, 32, 33, 34, 35, 36, 37, 38, 39, 40],
    'CLASS': ['C', 'C', 'C', 'C', 'C', 'C', 'C', 'C', 'C', 'C', 'C', 'C', 'C', 'C', 'C', 'C', 'C', 'C', 'C', 'C', 'C', 'C', 'C', 'C', 'C', 'C', 'C', 'C', 'C', 'C', 'C', 'C', 'C', 'C', 'C', 'C', 'C', 'C', 'C', 'C'],
    'NUMBER': [21, 21, 21, 21, 21, 21, 21, 21, 21, 21, 21, 21, 21, 21, 21, 21, 21, 21, 21, 21, 22, 22, 22, 22, 22, 22, 22, 22, 22, 22, 22, 22, 22, 22, 22, 22, 22, 22, 22, 22],
    'START': [0, 100, 200, 300, 400, 500, 600, 700, 800, 900, 1000, 1100, 1200, 1300, 1400, 1500, 1600, 1700, 1800, 1900, 2000, 2100, 2200, 2300, 2400, 2500, 2600, 2700, 2800, 2900, 3000, 3100, 3200, 3300, 3400, 3500, 3600, 3700, 3800, 3900],
    'END': [100, 200, 300, 400, 500, 600, 700, 800, 900, 1000, 1100, 1200, 1300, 1400, 1500, 1600, 1700, 1800, 1900, 2000, 2100, 2200, 2300, 2400, 2500, 2600, 2700, 2800, 2900, 3000, 3100, 3200, 3300, 3400, 3500, 3600, 3700, 3800, 3900, 4000],
    'POSITION': ['A', 'A', 'A', 'A', 'A', 'A', 'A', 'A', 'A', 'A', 'B', 'B', 'B', 'B', 'B', 'B', 'B', 'A', 'A', 'A', 'A', 'A', 'A', 'A', 'B', 'B', 'B', 'B', 'B', 'B', 'B', 'B', 'B', 'A', 'A', 'A', 'A', 'A', 'A', 'A'],
    'VALUE': [4.4, 3.8, 3.7, 2.9, 1.7, 1.7, 2.8, 2.0, 2.5, 1.6, 1.9, 2.9, 2.7, 2.8, 3.5, 3.5, 2.7, 2.8, 3.5, 3.5, 2.7, 2.3, 1.3, 3.5, 3.6, 3.9, 3.6, 2.9, 2.2, 1.6, 1.1, 3.6, 3.9, 3.7, 3.6, 4.0, 3.6, 4.1, 5.0, 3.9]
    }

df = pd.DataFrame(data=d)

for number in df['NUMBER'].unique().tolist():

    print('to do')
如你所见,我还不知道如何最好地处理整件事。我不确定是否必须使用.groupby(),或者是否必须迭代数据帧,甚至两者都必须迭代。你有什么建议吗?
我仍在努力寻找一种有效的方法。你有什么建议吗?
回答 1
Stack Overflow用户
回答已采纳
发布于 2022-03-23 19:13:09
第一个问题是分组。
pandas中的标准pandas只创建两个组:A (与所有A一起)和B (与所有B一起),当POSITION更改值时,它不能分割这些组。我看不出还有其他专栏能帮上忙。
但是itertools.groupby()创建了预期的组
import pandas as pd

data = {
    'ID': [1, 2, 3, 4, 5, 6, 7, 8, 9, 10, 11, 12, 13, 14, 15, 16, 17, 18, 19, 20, 21, 22, 23, 24, 25, 26, 27, 28, 29, 30, 31, 32, 33, 34, 35, 36, 37, 38, 39, 40],
    'CLASS': ['C', 'C', 'C', 'C', 'C', 'C', 'C', 'C', 'C', 'C', 'C', 'C', 'C', 'C', 'C', 'C', 'C', 'C', 'C', 'C', 'C', 'C', 'C', 'C', 'C', 'C', 'C', 'C', 'C', 'C', 'C', 'C', 'C', 'C', 'C', 'C', 'C', 'C', 'C', 'C'],
    'NUMBER': [21, 21, 21, 21, 21, 21, 21, 21, 21, 21, 21, 21, 21, 21, 21, 21, 21, 21, 21, 21, 22, 22, 22, 22, 22, 22, 22, 22, 22, 22, 22, 22, 22, 22, 22, 22, 22, 22, 22, 22],
    'START': [0, 100, 200, 300, 400, 500, 600, 700, 800, 900, 1000, 1100, 1200, 1300, 1400, 1500, 1600, 1700, 1800, 1900, 2000, 2100, 2200, 2300, 2400, 2500, 2600, 2700, 2800, 2900, 3000, 3100, 3200, 3300, 3400, 3500, 3600, 3700, 3800, 3900],
    'END': [100, 200, 300, 400, 500, 600, 700, 800, 900, 1000, 1100, 1200, 1300, 1400, 1500, 1600, 1700, 1800, 1900, 2000, 2100, 2200, 2300, 2400, 2500, 2600, 2700, 2800, 2900, 3000, 3100, 3200, 3300, 3400, 3500, 3600, 3700, 3800, 3900, 4000],
    'POSITION': ['A', 'A', 'A', 'A', 'A', 'A', 'A', 'A', 'A', 'A', 'B', 'B', 'B', 'B', 'B', 'B', 'B', 'A', 'A', 'A', 'A', 'A', 'A', 'A', 'B', 'B', 'B', 'B', 'B', 'B', 'B', 'B', 'B', 'A', 'A', 'A', 'A', 'A', 'A', 'A'],
    'VALUE': [4.4, 3.8, 3.7, 2.9, 1.7, 1.7, 2.8, 2.0, 2.5, 1.6, 1.9, 2.9, 2.7, 2.8, 3.5, 3.5, 2.7, 2.8, 3.5, 3.5, 2.7, 2.3, 1.3, 3.5, 3.6, 3.9, 3.6, 2.9, 2.2, 1.6, 1.1, 3.6, 3.9, 3.7, 3.6, 4.0, 3.6, 4.1, 5.0, 3.9]
}

df = pd.DataFrame(data)

# it creates only two groups
#for val, grp in df.groupby('POSITION', sort=False):
#    print(val)

import itertools

for (position, number), group in itertools.groupby(df.iterrows(), key=lambda item:(item[1]['POSITION'], item[1]['NUMBER']) ):
    rows = (item[1] for item in group)
    new_df = pd.DataFrame(rows)
    print(new_df)
    print('---')
给出
   ID CLASS  NUMBER  START   END POSITION  VALUE
0   1     C      21      0   100        A    4.4
1   2     C      21    100   200        A    3.8
2   3     C      21    200   300        A    3.7
3   4     C      21    300   400        A    2.9
4   5     C      21    400   500        A    1.7
5   6     C      21    500   600        A    1.7
6   7     C      21    600   700        A    2.8
7   8     C      21    700   800        A    2.0
8   9     C      21    800   900        A    2.5
9  10     C      21    900  1000        A    1.6
---
    ID CLASS  NUMBER  START   END POSITION  VALUE
10  11     C      21   1000  1100        B    1.9
11  12     C      21   1100  1200        B    2.9
12  13     C      21   1200  1300        B    2.7
13  14     C      21   1300  1400        B    2.8
14  15     C      21   1400  1500        B    3.5
15  16     C      21   1500  1600        B    3.5
16  17     C      21   1600  1700        B    2.7
---
    ID CLASS  NUMBER  START   END POSITION  VALUE
17  18     C      21   1700  1800        A    2.8
18  19     C      21   1800  1900        A    3.5
19  20     C      21   1900  2000        A    3.5
---
    ID CLASS  NUMBER  START   END POSITION  VALUE
20  21     C      22   2000  2100        A    2.7
21  22     C      22   2100  2200        A    2.3
22  23     C      22   2200  2300        A    1.3
23  24     C      22   2300  2400        A    3.5
---
    ID CLASS  NUMBER  START   END POSITION  VALUE
24  25     C      22   2400  2500        B    3.6
25  26     C      22   2500  2600        B    3.9
26  27     C      22   2600  2700        B    3.6
27  28     C      22   2700  2800        B    2.9
28  29     C      22   2800  2900        B    2.2
29  30     C      22   2900  3000        B    1.6
30  31     C      22   3000  3100        B    1.1
31  32     C      22   3100  3200        B    3.6
32  33     C      22   3200  3300        B    3.9
---
    ID CLASS  NUMBER  START   END POSITION  VALUE
33  34     C      22   3300  3400        A    3.7
34  35     C      22   3400  3500        A    3.6
35  36     C      22   3500  3600        A    4.0
36  37     C      22   3600  3700        A    3.6
37  38     C      22   3700  3800        A    4.1
38  39     C      22   3800  3900        A    5.0
39  40     C      22   3900  4000        A    3.9
---下一步是在VALUE中计算“颜色”,但如果我使用C1、C2、C3、C4创建新列,则会更简单。
df['COLOR'] = 'C0'  # default value at start

df.loc[ (4 <= df['VALUE']), 'COLOR'] = 'C4'
df.loc[ (3 <= df['VALUE']) & (df['VALUE'] < 4), 'COLOR' ] = 'C3'
df.loc[ (2 <= df['VALUE']) & (df['VALUE'] < 3), 'COLOR' ] = 'C2'
df.loc[ (df['VALUE'] < 2), 'COLOR' ] = 'C1' ID CLASS NUMBER START END POSITION VALUE COLOR
0 1 C 21 0 100 A 4.4 C4
1 2 C 21 100 200 A 3.8 C3
2 3 C 21 200 300 A 3.7 C3
3 4 C 21 300 400 A 2.9 C2
4 5 C 21 400 500 A 1.7 C1
5 6 C 21 500 600 A 1.7 C1
6 7 C 21 600 700 A 2.8 C2
7 8 C 21 700 800 A 2.0 C2
8 9 C 21 800 900 A 2.5 C2
9 10 C 21 900 1000 A 1.6 C1
10 11 C 21 1000 1100 B 1.9 C1
11 12 C 21 1100 1200 B 2.9 C2
12 13 C 21 1200 1300 B 2.7 C2
13 14 C 21 1300 1400 B 2.8 C2
14 15 C 21 1400 1500 B 3.5 C3
15 16 C 21 1500 1600 B 3.5 C3
16 17 C 21 1600 1700 B 2.7 C2
17 18 C 21 1700 1800 A 2.8 C2
18 19 C 21 1800 1900 A 3.5 C3
19 20 C 21 1900 2000 A 3.5 C3
20 21 C 22 2000 2100 A 2.7 C2
21 22 C 22 2100 2200 A 2.3 C2
22 23 C 22 2200 2300 A 1.3 C1
23 24 C 22 2300 2400 A 3.5 C3
24 25 C 22 2400 2500 B 3.6 C3
25 26 C 22 2500 2600 B 3.9 C3
26 27 C 22 2600 2700 B 3.6 C3
27 28 C 22 2700 2800 B 2.9 C2
28 29 C 22 2800 2900 B 2.2 C2
29 30 C 22 2900 3000 B 1.6 C1
30 31 C 22 3000 3100 B 1.1 C1
31 32 C 22 3100 3200 B 3.6 C3
32 33 C 22 3200 3300 B 3.9 C3
33 34 C 22 3300 3400 A 3.7 C3
34 35 C 22 3400 3500 A 3.6 C3
35 36 C 22 3500 3600 A 4.0 C4
36 37 C 22 3600 3700 A 3.6 C3
37 38 C 22 3700 3800 A 4.1 C4
38 39 C 22 3800 3900 A 5.0 C4
39 40 C 22 3900 4000 A 3.9 C3接下来,我可以计算每组的颜色,然后乘以100。
在组中,我可以添加START和END (和其他值)。
result = pd.DataFrame()

for (position, number), group in itertools.groupby(df.iterrows(), key=lambda item:(item[1]['POSITION'], item[1]['NUMBER']) ):
    rows = (item[1] for item in group)
    new_df = pd.DataFrame(rows)
    #print(new_df)

    count = new_df['COLOR'].value_counts()*100

    count['CLASS'] = 'C'
    count['POSITION'] = position
    count['START'] = new_df['START'].min()
    count['END'] = new_df['END'].max()
    count['SERIAL'] = number % 10
    #print(count)

    result = result.append(count, ignore_index=True)
#print('---')创建result后,需要填充空位置,设置int类型并更改列的顺序
# fill empty cell
result = result.fillna(0)
# set type `int`
result[['C1','C2','C3','C4','START','END','SERIAL']] = result[['C1','C2','C3','C4','START','END','SERIAL']].astype(int)
# change columns order
result = result[['CLASS','SERIAL','START','END','POSITION','C1','C2','C3','C4']]
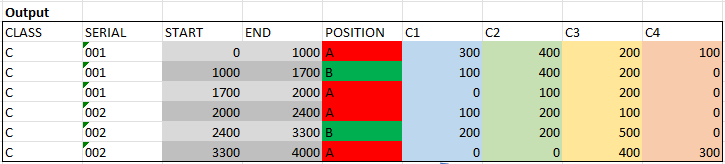
print(result)最终结果:
  CLASS  SERIAL  START   END POSITION   C1   C2   C3   C4
0     C       1      0  1000        A  300  400  200  100
1     C       1   1000  1700        B  100  400  200    0
2     C       1   1700  2000        A    0  100  200    0
3     C       2   2000  2400        A  100  200  100    0
4     C       2   2400  3300        B  200  200  500    0
5 C 2 3300 4000 A 0 0 400 300如果end - start可以与100不同,则可以创建列
df['LENGTH'] = df['END'] - df['START']后一组由COLOR和sum LENGTH组成
count = new_df.groupby('COLOR')['LENGTH'].sum()编辑:--我把它添加到代码中。
完整代码:
import pandas as pd
import itertools

data = {
    'ID': [1, 2, 3, 4, 5, 6, 7, 8, 9, 10, 11, 12, 13, 14, 15, 16, 17, 18, 19, 20, 21, 22, 23, 24, 25, 26, 27, 28, 29, 30, 31, 32, 33, 34, 35, 36, 37, 38, 39, 40],
    'CLASS': ['C', 'C', 'C', 'C', 'C', 'C', 'C', 'C', 'C', 'C', 'C', 'C', 'C', 'C', 'C', 'C', 'C', 'C', 'C', 'C', 'C', 'C', 'C', 'C', 'C', 'C', 'C', 'C', 'C', 'C', 'C', 'C', 'C', 'C', 'C', 'C', 'C', 'C', 'C', 'C'],
    'NUMBER': [21, 21, 21, 21, 21, 21, 21, 21, 21, 21, 21, 21, 21, 21, 21, 21, 21, 21, 21, 21, 22, 22, 22, 22, 22, 22, 22, 22, 22, 22, 22, 22, 22, 22, 22, 22, 22, 22, 22, 22],
    'START': [0, 100, 200, 300, 400, 500, 600, 700, 800, 900, 1000, 1100, 1200, 1300, 1400, 1500, 1600, 1700, 1800, 1900, 2000, 2100, 2200, 2300, 2400, 2500, 2600, 2700, 2800, 2900, 3000, 3100, 3200, 3300, 3400, 3500, 3600, 3700, 3800, 3900],
    'END': [100, 200, 300, 400, 500, 600, 700, 800, 900, 1000, 1100, 1200, 1300, 1400, 1500, 1600, 1700, 1800, 1900, 2000, 2100, 2200, 2300, 2400, 2500, 2600, 2700, 2800, 2900, 3000, 3100, 3200, 3300, 3400, 3500, 3600, 3700, 3800, 3900, 4000],
    'POSITION': ['A', 'A', 'A', 'A', 'A', 'A', 'A', 'A', 'A', 'A', 'B', 'B', 'B', 'B', 'B', 'B', 'B', 'A', 'A', 'A', 'A', 'A', 'A', 'A', 'B', 'B', 'B', 'B', 'B', 'B', 'B', 'B', 'B', 'A', 'A', 'A', 'A', 'A', 'A', 'A'],
    'VALUE': [4.4, 3.8, 3.7, 2.9, 1.7, 1.7, 2.8, 2.0, 2.5, 1.6, 1.9, 2.9, 2.7, 2.8, 3.5, 3.5, 2.7, 2.8, 3.5, 3.5, 2.7, 2.3, 1.3, 3.5, 3.6, 3.9, 3.6, 2.9, 2.2, 1.6, 1.1, 3.6, 3.9, 3.7, 3.6, 4.0, 3.6, 4.1, 5.0, 3.9]
}

df = pd.DataFrame(data)

#for val, grp in df.groupby('POSITION', sort=False):
#    print(val)

df['COLOR'] = 'C0'  # default value at start

df.loc[ (df['VALUE'] < 2), 'COLOR' ] = 'C1'
df.loc[ (2 <= df['VALUE']) & (df['VALUE'] < 3), 'COLOR' ] = 'C2'
df.loc[ (3 <= df['VALUE']) & (df['VALUE'] < 4), 'COLOR' ] = 'C3'
df.loc[ (4 <= df['VALUE']), 'COLOR'] = 'C4'

df['LENGTH'] = df['END'] - df['START']

#print(df)

result = pd.DataFrame()

for (position, number), group in itertools.groupby(df.iterrows(), key=lambda item:(item[1]['POSITION'], item[1]['NUMBER']) ):
    rows = (item[1] for item in group)
    new_df = pd.DataFrame(rows)
    #print(new_df)

    #count = new_df['COLOR'].value_counts()*100
    count = new_df.groupby('COLOR')['LENGTH'].sum()

    count['CLASS'] = 'C'
    count['POSITION'] = position
    count['START'] = new_df['START'].min()
    count['END'] = new_df['END'].max()
    count['SERIAL'] = number % 10
    #print(count)

    result = result.append(count, ignore_index=True)
    #print('---')

# fill empty cells
result = result.fillna(0)

# set type `int`
result[['C1','C2','C3','C4','START','END','SERIAL']] = result[['C1','C2','C3','C4','START','END','SERIAL']].astype(int)

# change columns order
result = result[['CLASS','SERIAL','START','END','POSITION','C1','C2','C3','C4']]

print(result)页面原文内容由Stack Overflow提供。腾讯云小微IT领域专用引擎提供翻译支持
原文链接:
https://stackoverflow.com/questions/71586737
复制相关文章
相似问题
腾讯云开发者
