
使用Chart.js注解的垂直线x轴上线性刻度插件
使用Chart.js注解的垂直线x轴上线性刻度插件
提问于 2022-03-27 13:32:24
当x轴使用线性标度时,我真的很难使用Chart.js的注释插件来生成垂直线。下面是代码:
const testConfig = {
    type: 'line',
    data: {
        datasets: [{
            label: 'Test dataset',
            data: [{x: .25, y: 65}, {x: .55, y: 59}, {x: .65, y: 80}, {x: .95, y: 81}, {x: 1, y: 56},
                {x: 1.5, y: 55}, {x: 2, y: 40}],
            fill: false,
            borderColor: 'rgb(75, 192, 192)',
            tension: 0.1
        }]
    },
    options: {
        scales: {
            xAxis: {
                type: 'linear'
            }
        },
        plugins: {
            annotation: {
                annotations: {
                    line1: {
                        type: 'line',
                        scaleId: 'x',
                        value: .55,
                        borderColor: 'rgba(255, 99, 132, 0.25)'
                    }
                }
            }
        }
    }
};
const testChart = new Chart(document.getElementById('testChart').getContext('2d'), testConfig);
结果是:
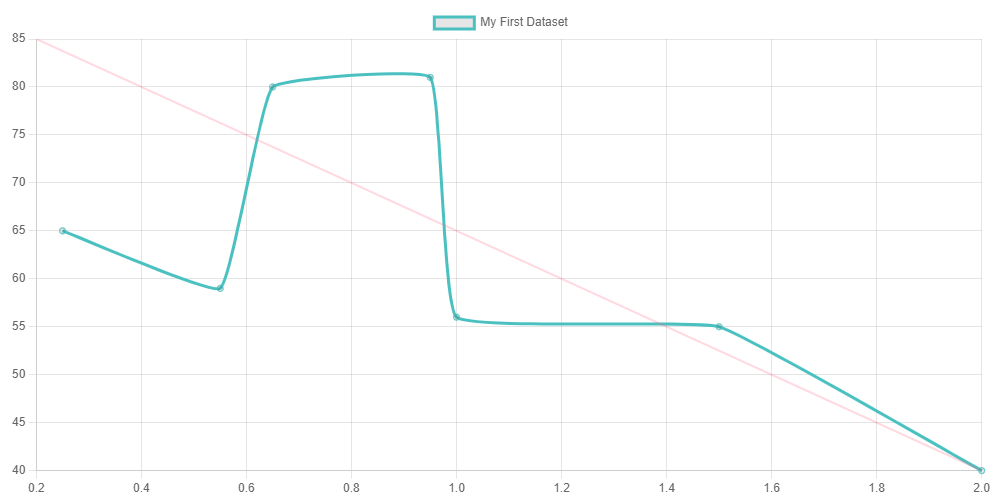
但是,我尝试指定垂直行(使用scaleID和value,或者使用xScaleID、xMin和xMax)注释总是以对角线形式出现,。指定一条水平线很好。使用box注释有类似的结果:我在整个图表中得到了一个水平框(换句话说,yMin和yMax工作得很好,但是xMin和xMax没有。
我正在使用注释插件v1.4.0。
我做错了什么?
回答 1
Stack Overflow用户
回答已采纳
发布于 2022-03-28 07:23:51
这是因为它不能与比例相匹配。给x轴一个xAxis的标度ID,同时对注释插件说它必须查看ID为x的标度。这两个必须是一样的
页面原文内容由Stack Overflow提供。腾讯云小微IT领域专用引擎提供翻译支持
原文链接:
https://stackoverflow.com/questions/71636782
复制相关文章
相似问题
腾讯云开发者
