
如何解决运行多个pyqt或pyqtgraph绘图组件时的自崩溃问题?
我设计了接口,定制组件试图输出多个绘图组件,程序在一段时间后就崩溃了。
该程序可能包括以下内容:ble. Py读取临时保存EMG数组的蓝牙值。main_plot.py实例化Show_EMG绘图类并输出Show_EMG绘图类,读取ble.PY的蓝牙值。
程序崩溃了,没有报告任何错误,我试图在不同的终端输出错误。
错误信息:
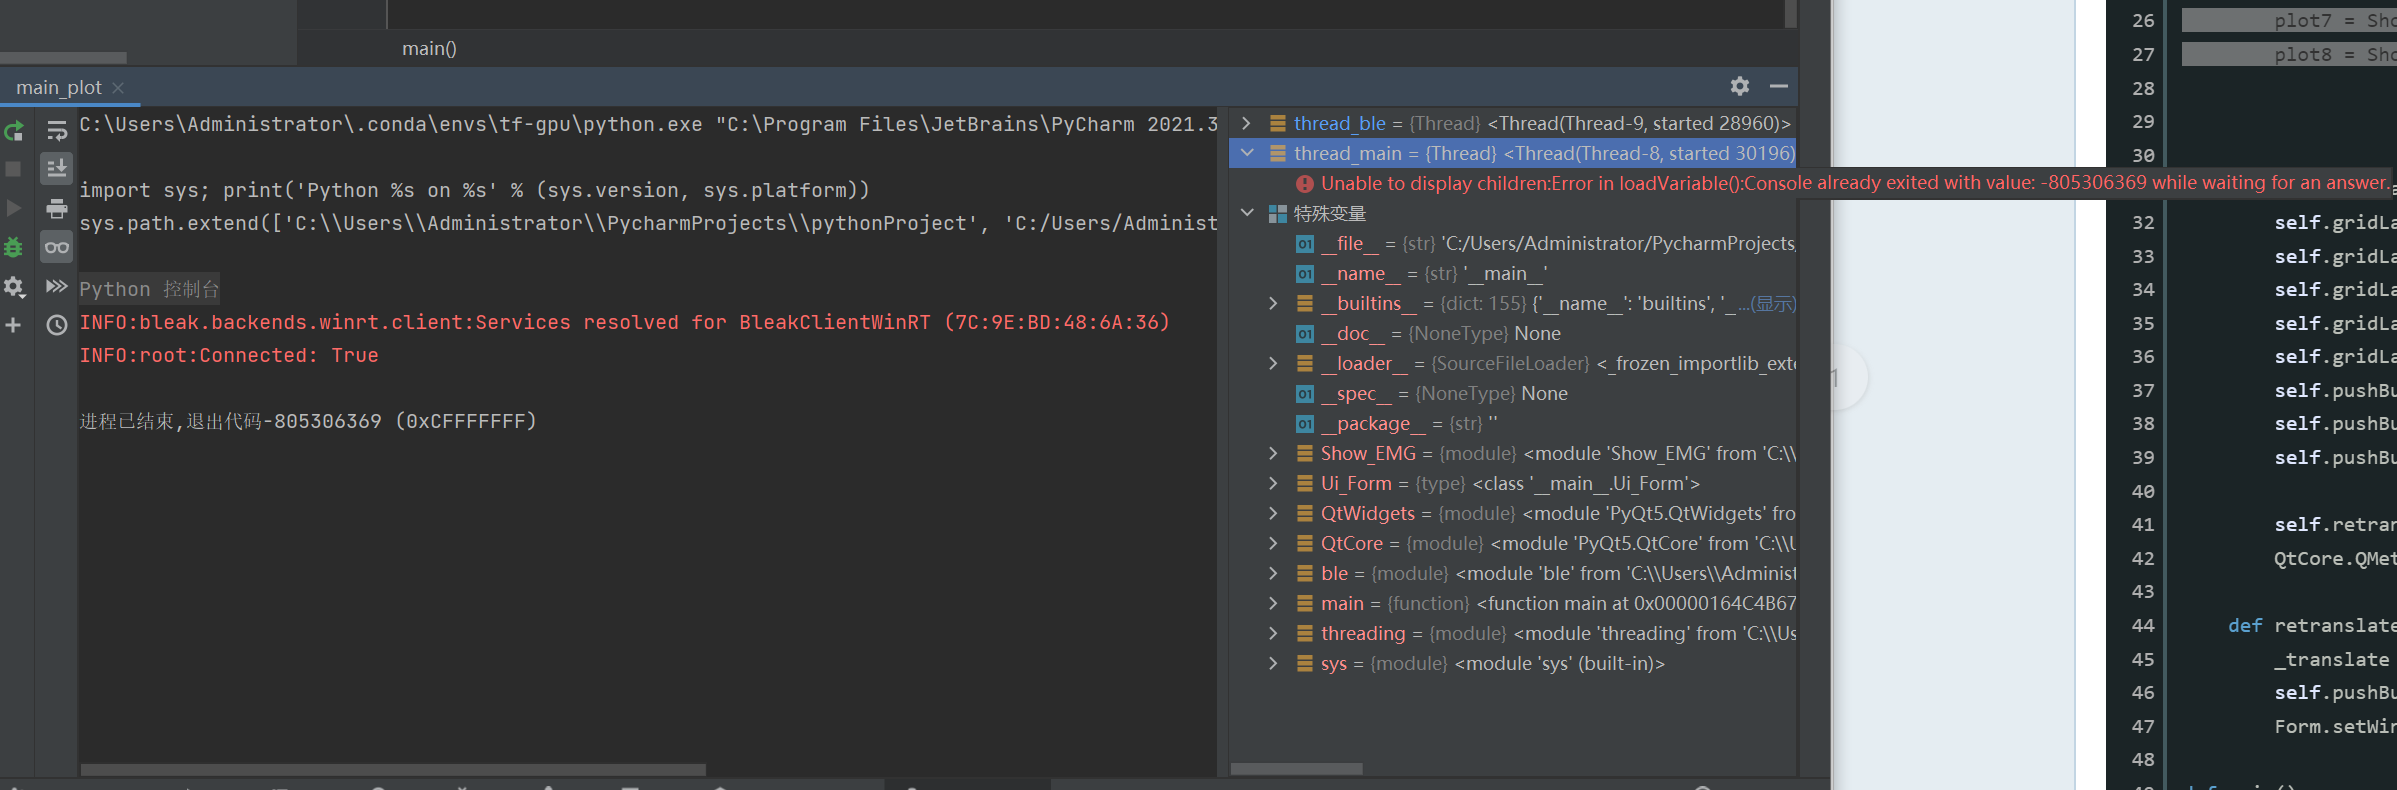
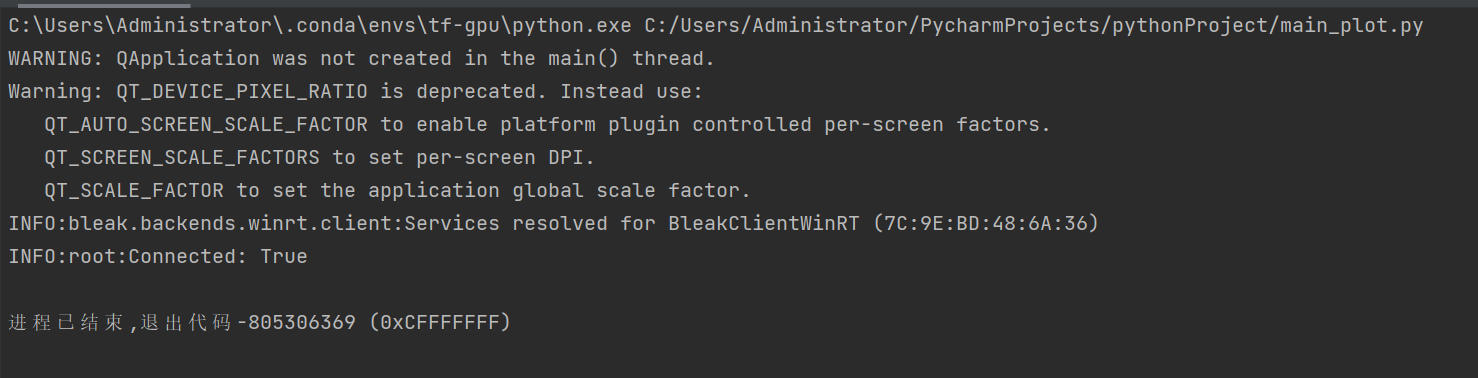
CMD:
比格图组件代码(Show_EMG.py):
import ble
from pyqtgraph import PlotWidget
import pyqtgraph as pg
import numpy as np
from PyQt5 import QtCore

class Plot_Show(object):
    '''
    Form,y,x,data,length = 1800, width = 250, high = 120, text = "sEMG Voltage"
    '''
    def __init__(self,Form,y,x,data,text=""):
        # length = 1800, width = 250, high = 120, text = "sEMG Voltage"
        self.Form=Form
        self.y=y
        self.x=x
        self.data=ble.EMG[data]
        self.length=1800
        if(text==""):
            self.test="sEMG Voltage"
        else:
            self.text = text
        self.graphicsView = PlotWidget(self.Form)
        self.initUI()


    def initUI(self):

        self.graphicsView.setGeometry(QtCore.QRect(self.y, self.x, 250, 120))
        self.graphicsView.hideButtons()
        self.graphicsView.setObjectName(self.text)


        self.graphicsView.setLabel(axis="left",text=self.text)
        self.graphicsView.setLabel(axis='bottom',text='Time')
        self.graphicsView.setMouseEnabled(x=False,y=False)
        self.graphicsView.setAntialiasing(True)
        self.graphicsView.setMenuEnabled(False)
        self.graphicsView.hideButtons()
        self.data1 = np.zeros(self.length)
        self.curve1 = self.graphicsView.plot(self.data1)
        self.ptr1 = 0

        def update1():
            global data1, ptr1
            self.graphicsView.setRange(xRange=[self.ptr1,self.ptr1+self.length],yRange=[5,550],padding=0)
            self.data1[:-1] = self.data1[1:]  # shift data in the array one sample left

            self.data1[-1] = self.data

            self.ptr1 += 1
            self.curve1.setData(self.data1)
            self.curve1.setPos(self.ptr1, 0)

        self.timer = pg.QtCore.QTimer()
        self.timer.timeout.connect(update1)
        self.timer.start(10)
main_plot.py代码:
import ble
import sys

import Show_EMG
from PyQt5 import QtCore, QtWidgets
import threading

class Ui_Form(object):
    def __init__(self):
        super().__init__()

    def setupUi(self, Form,**kwargs):
        Form.resize(820, 454)
        Form.setObjectName("Form")

                Show_EMG.Plot_Show(Form=Form, y=10, x=10, data=0, text="sEMG2 Voltage")
        Show_EMG.Plot_Show(Form=Form, y=10, x=140, data=1, text="sEMG2 Voltage")
        Show_EMG.Plot_Show(Form=Form, y=10, x=270, data=2, text="sEMG3 Voltage")
        Show_EMG.Plot_Show(Form=Form, y=280, x=10, data=3, text="sEMG4 Voltage")
        Show_EMG.Plot_Show(Form=Form, y=280, x=140, data=4, text="sEMG5 Voltage")
        Show_EMG.Plot_Show(Form=Form, y=280, x=270, data=5, text="sEMG6 Voltage")
        Show_EMG.Plot_Show(Form=Form, y=550, x=10, data=0, text="sEMG7 Voltage")
        Show_EMG.Plot_Show(Form=Form, y=550, x=140, data=0, text="sEMG8 Voltage")

        self.gridLayoutWidget = QtWidgets.QWidget(Form)
        self.gridLayoutWidget.setGeometry(QtCore.QRect(550, 270, 261, 121))
        self.gridLayoutWidget.setObjectName("gridLayoutWidget")
        self.gridLayout = QtWidgets.QGridLayout(self.gridLayoutWidget)
        self.gridLayout.setContentsMargins(0, 0, 0, 0)
        self.gridLayout.setObjectName("gridLayout")
        self.pushButton = QtWidgets.QPushButton(Form)
        self.pushButton.setGeometry(QtCore.QRect(370, 410, 75, 23))
        self.pushButton.setObjectName("pushButton")

        self.retranslateUi(Form)
        QtCore.QMetaObject.connectSlotsByName(Form)

    def retranslateUi(self, Form):
        _translate = QtCore.QCoreApplication.translate
        self.pushButton.setText(_translate("Form", "开始记录"))
        Form.setWindowTitle(_translate("Form", "Form"))

def main():
    app = QtWidgets.QApplication(sys.argv)
    Form = QtWidgets.QWidget()
    ui = Ui_Form()
    ui.setupUi(Form)
    Form.show()
    sys.exit(app.exec_())

if __name__ == "__main__":
    thread_main=threading.Thread(target=main)
    thread_main.start()
    thread_ble=threading.Thread(target=ble.ble)
thread_ble.start()Ble.EMG数组默认为:[200. 0. 0. 0. 0. 0.]
更详细的Ble:https://gist.github.com/allrobot/1547447f313942f278118cb2e569f59f
我试图在main_plot.py中添加线程,但是程序仍然崩溃.
也许QTimer应该是问题的根源?
如何更改代码以解决自崩溃问题?我需要修复自定义组件类,但我对PyQT还不熟悉,您有什么建议吗?
回答 2
Stack Overflow用户
发布于 2022-03-31 18:48:05
正如您已经知道的,(所有的)GUI不应该在分离的线程中运行。
但是,我在代码中遇到的主要问题是,如果没有分配给全局变量或类变量,PyQt中的一些元素就不能工作。
当Plot没有被分配给变量时,它的QTimer就不适合我了。
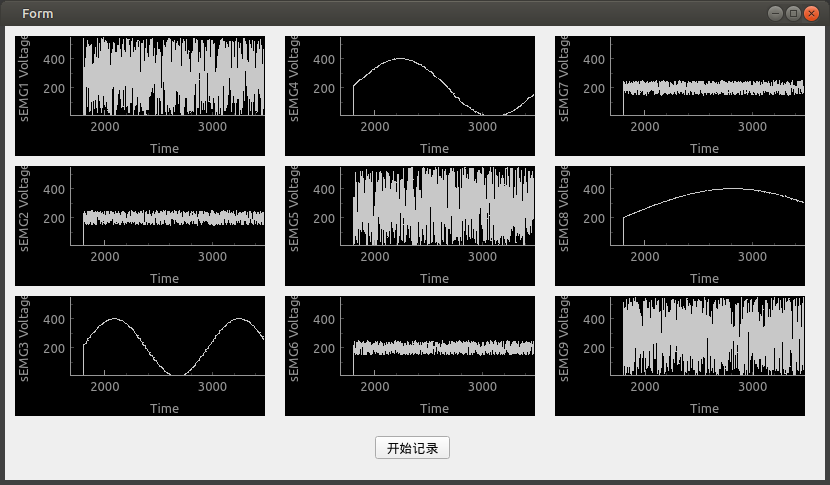
所以我把所有的情节都放在列表上,现在所有的QTimers (没有特殊的线程)都为我工作。
        self.plots = [
            PlotShow(...),
            PlotShow(...),
            PlotShow(...),
            # ...
        ]
完整的工作代码。
我使用类ble模拟模块ble.py,并将所有代码放在一个文件中(用于测试)。
我也做了一些小的改变:PEP 8 -- Python代码样式指南
#import ble
from PyQt5 import QtCore, QtWidgets
import pyqtgraph as pg   # pg.PlotWidget
import numpy as np
import threading


class ble:
    ''' Simulate module `ble.py` '''

    EMG = [0,0,0,0,0,0,0,0,0,0,0,0,0]

    def ble():
        import math
        import random
        import time

        counter = 0

        while True:

            for i in range(10):

                if i in (0, 4, 8):
                    ble.EMG[i] = random.randint(0, 550)
                elif i in (1, 5, 6):
                    ble.EMG[i] = random.randint(150, 250)
                else:
                    ble.EMG[i] = 200 + math.sin(math.radians(counter//i)) * 200

            counter += 1
            time.sleep(0.1)

class PlotShow():  # PE8: `CamelNames` for classes
    '''
    form, y, x, data, length=1800, width=250, high=120, text="sEMG Voltage"
    '''
    def __init__(self, form, y, x, data_number, text=""):   # PEP8: spaces after commans `,`
        self.form = form   # PE8: `lower_case_names` for variables
        self.y = y
        self.x = x
        self.data_number = data_number
        self.length = 1800

        self.data = np.zeros(self.length)
        self.ptr  = 0

        if not text:
            self.test="sEMG Voltage"
        else:
            self.text = text

        self.initUI()

        #print('start:', self.text)
        self.timer = pg.QtCore.QTimer()
        self.timer.timeout.connect(self.update_plot)
        self.timer.start(10)


    def initUI(self):
        self.graphicsView = pg.PlotWidget(self.form)

        self.graphicsView.setGeometry(QtCore.QRect(self.y, self.x, 250, 120))
        self.graphicsView.hideButtons()
        self.graphicsView.setObjectName(self.text)

        self.graphicsView.setLabel(axis="left",text=self.text)
        self.graphicsView.setLabel(axis='bottom',text='Time')
        self.graphicsView.setMouseEnabled(x=False,y=False)
        self.graphicsView.setAntialiasing(True)
        self.graphicsView.setMenuEnabled(False)
        self.graphicsView.hideButtons()

        self.curve = self.graphicsView.plot(self.data)

    def update_plot(self):
        #print('update:', self.text)

        self.data[:-1] = self.data[1:]  # shift data in the array one sample left
        self.data[-1]  = ble.EMG[self.data_number]

        self.ptr += 1

        self.curve.setData(self.data)
        self.curve.setPos(self.ptr, 0)
        self.graphicsView.setRange(xRange=[self.ptr, self.ptr+self.length], yRange=[5, 550], padding=0)  # PEP8: spaces after commans `,`


class UIForm():  # PE8: `CamelNames` for classes

    def setupUI(self, form, **kwargs):
        form.resize(820, 454)
        form.setObjectName("Form")

        self.plots = [
            PlotShow(form=form, y=10,  x=10,  data_number=0, text="sEMG1 Voltage"),
            PlotShow(form=form, y=10,  x=140, data_number=1, text="sEMG2 Voltage"),
            PlotShow(form=form, y=10,  x=270, data_number=2, text="sEMG3 Voltage"),
            PlotShow(form=form, y=280, x=10,  data_number=3, text="sEMG4 Voltage"),
            PlotShow(form=form, y=280, x=140, data_number=4, text="sEMG5 Voltage"),
            PlotShow(form=form, y=280, x=270, data_number=5, text="sEMG6 Voltage"),
            PlotShow(form=form, y=550, x=10,  data_number=6, text="sEMG7 Voltage"),
            PlotShow(form=form, y=550, x=140, data_number=7, text="sEMG8 Voltage"),
            PlotShow(form=form, y=550, x=270, data_number=8, text="sEMG9 Voltage"),
        ]

        self.gridLayoutWidget = QtWidgets.QWidget(form)
        self.gridLayoutWidget.setGeometry(QtCore.QRect(550, 270, 261, 121))
        self.gridLayoutWidget.setObjectName("gridLayoutWidget")

        self.gridLayout = QtWidgets.QGridLayout(self.gridLayoutWidget)
        self.gridLayout.setContentsMargins(0, 0, 0, 0)
        self.gridLayout.setObjectName("gridLayout")

        self.pushButton = QtWidgets.QPushButton(form)
        self.pushButton.setGeometry(QtCore.QRect(370, 410, 75, 23))
        self.pushButton.setObjectName("pushButton")

        self.retranslateUi(form)

        QtCore.QMetaObject.connectSlotsByName(form)

    def retranslateUi(self, form):
        _translate = QtCore.QCoreApplication.translate
        self.pushButton.setText(_translate("Form", "开始记录"))
        form.setWindowTitle(_translate("Form", "Form"))

def main():
    app = QtWidgets.QApplication([])
    form = QtWidgets.QWidget()  # PE8: `lower_case_names` for variables
    ui = UIForm()
    ui.setupUI(form)
    form.show()
    app.exec()

if __name__ == "__main__":
    # better start before GUI to create all needed variables and values
    thread_ble = threading.Thread(target=ble.ble)
    thread_ble.start()

    #thread_main = threading.Thread(target=main)
    #thread_main.start()
    #input() # keep running program when GUI runs in thread

    # GUI rather shouldn't run in separated thread
    main()
坦率地说,如果所有的地块都从同一个源和同一时间获得数据,那么您可以使用一个QTimer来运行所有绘图中的所有update1,但是这个计时器应该在UIForm而不是PlotShow中。
编辑:
版本,它只在UIForm中使用一个UIForm来对列表self.plots中的所有情节执行update_plot()。
#import ble
from PyQt5 import QtCore, QtWidgets
import pyqtgraph as pg   # pg.PlotWidget
import numpy as np
import threading


class ble:
    ''' Simulate module `ble.py` '''

    EMG = [0,0,0,0,0,0,0,0,0,0,0,0,0]

    def ble():
        import math
        import random
        import time

        counter = 0

        while True:

            for i in range(10):

                if i in (0, 4, 8):
                    ble.EMG[i] = random.randint(0, 550)
                elif i in (1, 5, 6):
                    ble.EMG[i] = random.randint(150, 250)
                else:
                    ble.EMG[i] = 200 + math.sin(math.radians(counter//i)) * 200

            counter += 1
            time.sleep(0.1)

class PlotShow():  # PE8: `CamelNames` for classes
    '''
    form, y, x, data, length=1800, width=250, high=120, text="sEMG Voltage"
    '''
    def __init__(self, form, y, x, data_number, text=""):   # PEP8: spaces after commans `,`
        self.form = form   # PE8: `lower_case_names` for variables
        self.y = y
        self.x = x
        self.data_number = data_number
        self.length = 1800

        self.data = np.zeros(self.length)
        self.ptr  = 0

        if not text:
            self.test="sEMG Voltage"
        else:
            self.text = text

        self.initUI()

        #print('start:', self.text)
        #self.timer = pg.QtCore.QTimer()
        #self.timer.timeout.connect(self.update_plot)
        #self.timer.start(10)


    def initUI(self):
        self.graphicsView = pg.PlotWidget(self.form)

        self.graphicsView.setGeometry(QtCore.QRect(self.y, self.x, 250, 120))
        self.graphicsView.hideButtons()
        self.graphicsView.setObjectName(self.text)

        self.graphicsView.setLabel(axis="left",text=self.text)
        self.graphicsView.setLabel(axis='bottom',text='Time')
        self.graphicsView.setMouseEnabled(x=False,y=False)
        self.graphicsView.setAntialiasing(True)
        self.graphicsView.setMenuEnabled(False)
        self.graphicsView.hideButtons()

        self.curve = self.graphicsView.plot(self.data)

    def update_plot(self):
        #print('update:', self.text)

        self.data[:-1] = self.data[1:]  # shift data in the array one sample left
        self.data[-1]  = ble.EMG[self.data_number]

        self.ptr += 1

        self.curve.setData(self.data)
        self.curve.setPos(self.ptr, 0)
        self.graphicsView.setRange(xRange=[self.ptr, self.ptr+self.length], yRange=[5, 550], padding=0)  # PEP8: spaces after commans `,`


class UIForm():  # PE8: `CamelNames` for classes

    def setupUI(self, form, **kwargs):
        form.resize(820, 454)
        form.setObjectName("Form")

        self.plots = [
            PlotShow(form=form, y=10,  x=10,  data_number=0, text="sEMG1 Voltage"),
            PlotShow(form=form, y=10,  x=140, data_number=1, text="sEMG2 Voltage"),
            PlotShow(form=form, y=10,  x=270, data_number=2, text="sEMG3 Voltage"),
            PlotShow(form=form, y=280, x=10,  data_number=3, text="sEMG4 Voltage"),
            PlotShow(form=form, y=280, x=140, data_number=4, text="sEMG5 Voltage"),
            PlotShow(form=form, y=280, x=270, data_number=5, text="sEMG6 Voltage"),
            PlotShow(form=form, y=550, x=10,  data_number=6, text="sEMG7 Voltage"),
            PlotShow(form=form, y=550, x=140, data_number=7, text="sEMG8 Voltage"),
            PlotShow(form=form, y=550, x=270, data_number=8, text="sEMG9 Voltage"),
        ]

        self.gridLayoutWidget = QtWidgets.QWidget(form)
        self.gridLayoutWidget.setGeometry(QtCore.QRect(550, 270, 261, 121))
        self.gridLayoutWidget.setObjectName("gridLayoutWidget")

        self.gridLayout = QtWidgets.QGridLayout(self.gridLayoutWidget)
        self.gridLayout.setContentsMargins(0, 0, 0, 0)
        self.gridLayout.setObjectName("gridLayout")

        self.pushButton = QtWidgets.QPushButton(form)
        self.pushButton.setGeometry(QtCore.QRect(370, 410, 75, 23))
        self.pushButton.setObjectName("pushButton")

        self.retranslateUi(form)

        QtCore.QMetaObject.connectSlotsByName(form)

        self.timer = pg.QtCore.QTimer()
        self.timer.timeout.connect(self.update_all_plots)
        self.timer.start(10)

    def update_all_plots(self):
        for plot in self.plots:
            plot.update_plot()

    def retranslateUi(self, form):
        _translate = QtCore.QCoreApplication.translate
        self.pushButton.setText(_translate("Form", "开始记录"))
        form.setWindowTitle(_translate("Form", "Form"))

def main():
    app = QtWidgets.QApplication([])
    form = QtWidgets.QWidget()  # PE8: `lower_case_names` for variables
    ui = UIForm()
    ui.setupUI(form)
    form.show()
    app.exec()

if __name__ == "__main__":
    # better start before GUI to create all needed variables and values
    thread_ble = threading.Thread(target=ble.ble)
    thread_ble.start()

    #thread_main = threading.Thread(target=main)
    #thread_main.start()
    #input() # keep running program when GUI runs in thread

    # GUI rather shouldn't run in separated thread
main()Stack Overflow用户
发布于 2022-03-31 12:43:49
感谢“furas”和“musicamante”,这个问题已经解决了。
这个bug令人惊讶地简单。
我把刷新率调得太快了。因为我在自定义组件类中设置了self.timer.start(10),所以程序崩溃itself.It只需要设置self.timer.start(100),程序可以工作.
https://stackoverflow.com/questions/71687893
复制相似问题
腾讯云开发者

Copyright © 2013 - 2026 Tencent Cloud. All Rights Reserved. 腾讯云 版权所有
深圳市腾讯计算机系统有限公司 ICP备案/许可证号:粤B2-20090059 ![]() 粤公网安备44030502008569号
粤公网安备44030502008569号
腾讯云计算(北京)有限责任公司 京ICP证150476号 | 京ICP备11018762号