
如果我的应用程序是blanck使用海运,那么是否有一种解决方案可以使用带流光的海运?
如果我的应用程序是blanck使用海运,那么是否有一种解决方案可以使用带流光的海运?
提问于 2022-04-01 09:48:25
MacOS + streamlit +Python3.9。
我在使用海运方面有问题。
import seaborn as sns

nb_currentprovider = plt.figure(figsize=(10,6))
sns.countplot(x="current_provider",data=df_ventes)

plt.title("Répartition des ventes selon l'opérateur actuel du client", fontsize=14)
plt.xlabel("Volume de ventes", fontsize=12)
plt.ylabel("Opérateur actuel", fontsize=12);
st.pyplot(nb_currentprovider)
我的应用程序是空白的,我在matplotlib上遇到了同样的问题,但现在它正在使用:
from matplotlib.backends.backend_agg import RendererAgg
_lock = RendererAgg.lock
海运是否存在类似的解决方案?
回答 1
Stack Overflow用户
发布于 2022-04-11 03:18:47
下面是windows 10上使用海运的一个示例。
代码
import seaborn as sns
import matplotlib.pyplot as plt
import streamlit as st
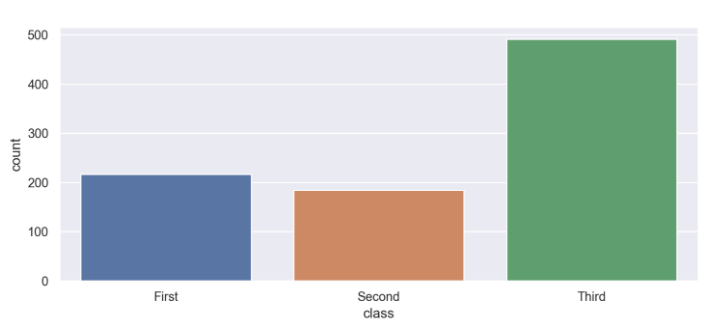
titanic = sns.load_dataset("titanic")
fig = plt.figure(figsize=(10, 4))
sns.countplot(x="class", data=titanic)
st.pyplot(fig)输出
页面原文内容由Stack Overflow提供。腾讯云小微IT领域专用引擎提供翻译支持
原文链接:
https://stackoverflow.com/questions/71704979
复制相关文章
相似问题
腾讯云开发者
